

Abstract
Objective
To assess prospectively the incidence of hypercalciuria and hypercalcemia on different doses of vitamin D and a calcium intake of ~ 1200mg/day
Methods
Design
A one year randomized placebo controlled study of vitamin D 400 to 4800 IU daily in 163 White women aged 57–90 years. Calcium citrate tablets 200mg were added to the diet to achieve a total calcium intake of ~1200 mg/day in all groups. All women had vitamin D insufficiency at baseline with serum 25OHD < 20ng/ml (50nmol/l). Serum and 24hour urine calcium were collected every 3 months; on supplementation any test that occurred above the upper normal range represented an episode of hypercalcemia or hypercalciuria. Mixed effects model, multivariate logistic regression were used in the analysis.
Results
Hypercalcemia >10.2mg/dl (2.55mmol/l) occurred in 8.8 percent of White women. Hypercalciuria >300 mg/d (7.5mmol) occurred in 30.6 percent of White women. Episodes of hypercalciuria were transient in half the group and recurrent in the other half. There was no relation between hypercalcemia or hypercalciuria with vitamin D dose and hypercalciuria was equally common as that in the placebo group.
Conclusions
Hypercalciuria and hypercalcemia occurs commonly on vitamin D and calcium supplements. Whether it is due to the calcium, vitamin D or both is unclear. These findings may have relevance to the reported increase in kidney stones in the WHI study.
Because Calcium 1200 mg and Vitamin D 800 IU are widely recommended in post menopausal women systematic evaluation of the safety of supplements is warranted in clinical management and in future studies.
Keywords: vitamin D, calcium, hypercalciuria, hypercalcemia
Introduction
Calcium and vitamin D supplements are widely recommended for the prevention of osteoporosis in post-menopausal women The Recommended Dietary Allowance (RDA) for vitamin D3 is 600–800IU/d and calcium 1200mg/d for older people (1).
There have been many trials of the effect of vitamin D and calcium on bone but no systematic study of potential adverse events such as hypercalcemia, hypercalciuria and kidney stones (1).
The exact dose of vitamin D associated with toxic symptoms in humans is not known but 56 women that developed vitamin D intoxication and hypercalcemia from drinking over fortified milk had serum 25OHD levels that varied from 56–696 ng/ml (140–1740 mmol/l) and some women (22%) were discharged with renal impairment and metastatic calcification (2). The Tolerable upper level (TUL) is 4000 IU/day (1) Recently, a reverse J-shaped curve demonstrated a 42% increase in mortality in 247,574 men and women with serum 25OHD > 55 ng/ml (137nmol/l) compared to 20ng/ml (50nmol/l) (3).
Studies of toxicity after high calcium intake are rare. The RDA for calcium for older adults age 50–70 years is 1000–1200 mg/day and the recommended upper limit is 2,000mg/day (1). Recent clinical cases of hypercalcemia have been attributed to an increased calcium intake usually calcium carbonate and in such cases the total calcium intake has been as small as 1000–2000 mg daily (4,5), hypercalcemia and renal failure has been reported with as little as 1700mg daily (6) Another possible adverse event reported recently was an increase in cardiovascular events of 31% in a meta analysis of osteoporosis trials that used calcium supplements (7) but it is not known if it can be attributed to hypercalcemia and hypercalciuria.
The Women’s Health Initiative (WHI) trial is the only large long term prospective controlled study of calcium and vitamin D supplementation and at 7 years they reported a 17% increase in the risk of nephrolithiasis compared to placebo in this study of 36,282 women (8).
There has never been an evidence-based evaluation of the safety of calcium and vitamin D supplements despite widespread use. In this paper we report on the incidence of hypercalciuria and hypercalcemia measured prospectively as a secondary outcome in a clinical trial of vitamin D supplementation and calcium in older postmenopausal women.
Methods
Study design
The clinical trial was a one-year randomized, double-blinded placebo controlled study (VIDOS-Vitamin D supplementation in Older Women) to determine the effects of increasing doses of vitamin D3. 163 White women were studied at Creighton University Medical Center, Omaha. They were at least seven years post menopause, ranging from age 57–90 years. The main inclusion criterion was vitamin D insufficiency defined as serum 25OHD ≤ 20 ng/ml (50 nmol/L). Women were enrolled in winter/spring 2007–2008 and followed for one year. Complete details of the trial are given in the primary paper (9).
Exclusion criteria were significant health problems, active nephrolithiasis or history of more than two kidney stones in their lifetime, chronic renal failure (serum creatinine >1.4 mg/dL), chronic liver disease, medical conditions severe enough to prevent reasonable physical activity, serum 25OHD < 5 ng/ml (12.5 nmol/L), serum calcium ≥ 10.3 mg/dl (2.575mmol/l) or > 0.3 mg/dl more than upper limit of normal on 2 baseline tests, 24 hour urine calcium > 300 mg/dl (7.5mmol) on 2 baseline tests, Medication exclusion were those currently taking bisphosphonates or who had taken them for more than 3 months in the past. No use of fluoride, PTH or its derivatives, calcitonin, estrogen in the last 6 months, corticosteroid therapy (> 10 mg/d), phenytoin or phenobarbital, high dose thiazide therapy (> 37.5 mg/d). No multivitamins containing vitamin D were allowed in study.
Randomization and Treatment
Women were randomly assigned to one of the 8 groups – vitamin D3 400, 800, 1600, 2400, 3200, 4000 or 4800 IU/d or placebo. Women, providers, researchers, and persons who assessed outcomes were blinded to treatment assignment. The statistician had access to treatment assignments. The randomization method was randomized blocks with block sizes of 8 and 16, stratified by screening serum 25OHD level <15 vs. ≥ 15 ng/ml (<37.4 vs. ≥ 37.4 nmol/L). The study statistician generated the randomization list with SAS software (SAS Institute Inc., Cary, NC).
Calcium citrate supplements (Citracal; Bayer HealthCare, Morristown, NJ) were given to women to maintain a total calcium intake between 1200–1400 mg/d after analysis of dietary calcium from 7-day food diaries; they were advised to take calcium tablets twice daily and vitamin d after food. The IRB at Creighton University approved the study protocol and participants were enrolled after signing an informed consent. A Data Safety and Monitoring Board (DSMB) was established at the beginning of the study. Adherence was measured at 3, 6, 9 and 12 months by counting the pills remaining in the bottles; new bottles of vitamin D and Calcium were supplied at each of these visits.
Outcomes and follow-up
The primary objectives of the study were dose response in serum 25OHD and serum PTH after treatment with vitamin D3. A secondary outcome was serum and 24 h urine calcium.
Fasting venous blood specimens were collected at baseline and then at 3,6,9 and 12 months. All serum and urine chemistries were measured in the Creighton University Clinical Chemistry Laboratory using standard auto analyzer equipment. 25OHD was measured by radioimmunoassay (RIA) in the Bone Metabolism laboratory (Diasorin, Inc. Stillwater, MN). The normal range for serum calcium at Creighton Medical center is 8.5–10.2mg/dl. Data from a previous study was used to define a normal range for 24h urine calcium of 30–300 mg (0.75–7.5mmol) (10). The dietary intake of calcium and vitamin D was calculated by a dietician from the 7-day food diaries at baseline and 12 months (‘Food processor II Plus’ nutrition and diet analysis system, ESHA Research, Salem, OR).
Management of hypercalcemia and hypercalciuria
Hypercalcemia
During study, hypercalcemia was defined as a fasting serum calcium level that was 0.3 mg/dl or 1 standard deviation higher than the upper normal range of 10.2mg/dl (i.e. >10.5mg/dl). For post study analysis hypercalcemia was defined if serum calcium exceeded the upper normal limit of >10.2 mg/dl (2.55mmol/l).
Hypercalciuria
During study, hypercalciuria was defined if 24h urine calcium exceeded 400mg (10 mmol). For post study analysis hypercalciuria was defined as a 24h urine calcium >300mg which is the upper normal limit. Hypercalciuria may occur spuriously if an individual collects for longer than 24 hours; to account for this potential error of over collection we averaged 24h urine creatinine values for all urine collections at the end of study and if a 24 h creatinine was 20 percent higher than the average for all tests then that episode of hypercalciuria was excluded from analysis.
If severe hypercalciuria >400 mg/d (10 mmol) or hypercalcemia (≥10.6mg/dl) developed, tests were repeated within 2 weeks. If elevated, then calcium supplements were withdrawn and dietary calcium levels were rechecked and labs were repeated in 2 weeks; if the elevation persisted, then calcium was withdrawn. If the condition still persisted then vitamin D was withdrawn.
Statistical Methods
The endpoints for this secondary analysis were urine and serum calcium. Analysis was done using all the women that were randomized. For those that dropped out or were removed from study, the data was included in the analysis if available. For the purpose of this analysis hypercalcemia was defined in usual clinical terms, that is a serum calcium ≥ 10.3mg/dl (2.75mmol/l). Similarly hypercalciuria was defined as a 24 hour urine calcium value > 300mg (7.5mmol/L) and severe hypercalciuria as > 400mg (10mmol/L).
Descriptive statistics are presented as means ± standard deviations unless otherwise specified. Mixed effects models were used to estimate the effect of time and dose on urine and serum calcium. Dose and time were included as fixed effects in the model and subject was included as a random effect. Log transformation was applied to urine calcium to meet modeling assumptions. Interactions between dose and time were also explored. Model fit was examined by looking at various residual plots.
As a post-hoc comparison, we compared women with hypercalciuria by dividing them into 3 groups based on 24h urine calcium during the course of the study defined as 24hour urine with anyone with a urine calcium >400 mg (10 mmol), anyone between 300–400 mg (7.5–10 mmol) and then less than <300 mg (7.5 mmol) in a complete case analysis (they had to have a urine calcium measurement at each time point to be included in this analysis. ANOVA models and chi-square tests were used to compare patient characteristics between these three categories. Variables significant in the univariate models were used as predictors in multivariate generalized logistic regression, eGFR (estimated glomerular filtration rate) was included in the model as well based on clinical experience.
We looked at >=300 mg at any time during the study versus <300 during the study in a logistic regression model. ROC analysis was used to find a cutpoint for the variable with the greatest predictive value in order to give a predictive category for detecting hypercalciuria. It was also tested in a multivariate logistic model
SAS software, version 9.2 (SAS Institute Inc., Cary, NC) was used for analysis. P-values less than 0.05 were considered statistically significant.
Results
163 women were randomized,147 completed the protocol, 5 were lost to follow up and 11 discontinued study medications. Those women that discontinued supplements came in for a final visit and were included in the analysis. (supplement figure 1)
The baseline characteristics are shown in table 1. There were no significant differences between the 8 groups at baseline. Mean baseline serum 25OHD was 15.6 ng/ml (39nmol/L) and increased on the highest dose of vitamin D 4800 IU to 45 ng/ml (112nmol/l). Mean daily dietary intake of calcium was 685 (± 259) mg at baseline and 671mg at 12 months. The mean calcium supplement was ~ 600mg and mean total calcium intake at 12 months was 1280mg/day. Mean vitamin D intake was 114 (±69) IU/d.
Table 1.
Baseline Characteristics
| Vitamin D dose (IU/d) Groups |
Age (years) |
Calcium Intake† (mg/day) |
VitaminD Intake† (IU/d) |
Protein intake† (g/d) |
Sodium intake† (mg/d) |
Serum Calcium (mg/dl) |
24-hour Urine Calcium (mg) |
Serum 25OHD (ng/ml) |
Serum 1,25(OH) 2D (pg/ml) |
|---|---|---|---|---|---|---|---|---|---|
| All (n=163) | 67(7.3) | 685(259) | 114(69) | 65(15) | 2428(589) | 9.5(0.3) | 141(67) | 15.3(3.7) | 45.2(18) |
| Placebo (n=21) | 66(6.5) | 593(182) | 105(61) | 60(16) | 2231(452) | 9.4(0.4) | 138(66) | 15.0(3.6) | 47.8(18) |
| 400 (n=20) | 68(8.6) | 606(212) | 98(58) | 66(15) | 2453(793) | 9.6(0.3) | 123(70) | 15.1(4.3) | 47.5(27) |
| 800 (n=21) | 68(8.1) | 741(247) | 135(70) | 62(13) | 2421(532) | 9.4(0.2) | 157(73) | 15.5(3.8) | 43.6(17) |
| 1600 (n=20) | 66(7.4) | 754(244) | 125(71) | 68(12) | 2644(615) | 9.6(0.3) | 133(57) | 15.0(4.0) | 46.1(11) |
| 2400 (n=21) | 66(6.3) | 621(190) | 98(55) | 64(13) | 2365(577) | 9.5(0.3) | 139(64) | 15.2(4.0) | 47.9(16) |
| 3200 (n=20) | 69(7.7) | 725(263) | 109(62) | 64(14) | 2383(572) | 9.4(0.4) | 151(59) | 15.9(3.2) | 46.1(12) |
| 4000 (n=20) | 66(7.1) | 673(324) | 106(83) | 64(16) | 2342(563) | 9.4(0.4) | 148(68) | 14.9(3.6) | 44.2(19) |
| 4800 (n=20) | 65(6.1) | 768(348) | 137(86) | 75(18) | 2596(569) | 9.5(0.3) | 134(79) | 15.6(3.6) | 38.3(19) |
Values are reported as mean (SD),
Obtained from 7-day food diary.
IU = International Units, 25OHD = 25 hydroxyvitamin D, 1,25(OH)2D = 1,25 dihydroxyvitamin D
Overall mean adherence for 12 months was 94%(±10%) for vitamin D3 and 91%(±18%) for calcium.
Serum calcium results
Mean baseline serum calcium was 9.47 mg/dl (2.36nmol/l) and increased to 9.52 mg/dl (2.38nmol/l) at 12 months (p=0.13). There were 20 episodes of hypercalcemia >10.2mg/dl in 14 women (Figure 1 and Table 2). The serum calcium peaked at 3 months and slightly declined thereafter but never reached baseline. There was no significant association between episodes of hypercalcemia and vitamin D dose or serum 25OHD level. Hypercalcemia was transient and did not lead to dose reduction of calcium or vitamin D. In retrospect there were 2 women who may have had mild primary hyperparathyroidism. They had 5 episodes of hypercalcemia that have been excluded from the above analysis of hypercalcemia.
Figure 1.
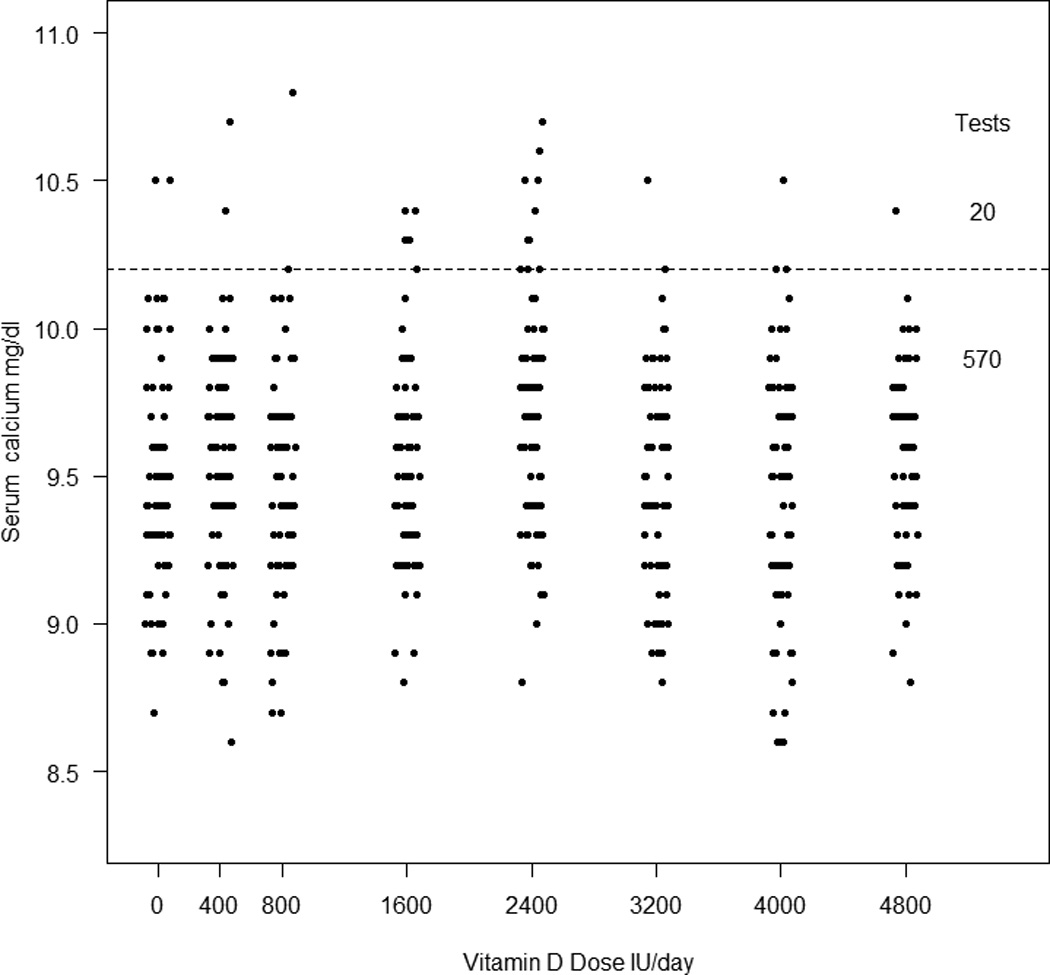
Incidence of hypercalcemia compared to placebo and vitamin D dose. The dotted line indicates the upper normal range of 10.2mg/dl. There were 20 episodes of hypercalcemia in 14 women. There is no significant association between episodes of hypercalcemia and vitamin D dose.
Table 2.
Incidence of hypercalcemia and hypercalciuria in White women that completed study*
| Dose Groups IU | Baseline Serum Calcium (mg/dl) |
12-month Serum Calcium (mg/dl) |
Baseline 24h Urine Calcium (mg) |
12-month 24h Urine Calcium (mg) |
Women† Serum calcium ≥10.3 mg/dl |
Episodes# Serum calcium ≥10.3 mg/dl |
Women† 24h Urine calcium >300 mg |
Episodes# 24h Urine calcium >300 mg |
|---|---|---|---|---|---|---|---|---|
| All (n=147) | 9.4(0.3) | 9.5(0.4) | 130(67) | 169(86) | 14 | 20 | 47 | 81 |
| Placebo (n=19) | 9.4(0.4) | 9.5(0.3) | 129(67) | 138(112) | 1 | 3 | 4 | 8 |
| 400 (n=18) | 9.6(0.4) | 9.5(0.4) | 113(71) | 148(87) | 1 | 2 | 8 | 13 |
| 800 (n=18) | 9.4(0.2) | 9.4(0.4) | 141(75) | 131(101) | 1 | 1 | 7 | 11 |
| 1600 (n=19) | 9.4(0.3) | 9.6(0.4) | 132(50) | 173(81) | 4 | 5 | 5 | 8 |
| 2400 (n=20) | 9.5(0.3) | 9.8(0.3) | 129(66) | 177(86) | 4 | 6 | 6 | 15 |
| 3200 (n=18) | 9.4(0.4) | 9.4(0.3) | 150(57) | 162(75) | 1 | 1 | 6 | 10 |
| 4000 (n=17) | 9.4(0.4) | 9.4(0.3) | 138(68) | 229(66) | 1 | 1 | 6 | 10 |
| 4800 (n=18) | 9.5(0.3) | 9.5(0.3) | 105(82) | 194(70) | 1 | 1 | 5 | 6 |
Values are reported as mean (SD) unless otherwise specified
Number of women who had ≥ 1 episode during the study
Number of episodes during the study.
24h urine calcium results
Mean baseline 24-hr urine calcium was 141 mg (3.5mmol) and increased at 12 months to 185 mg (4.6mmol)(p<0.0001), the changes for each time point are shown in Figure 2. There were 88 episodes of hypercalciuria > 300mg in 48 women(Figure 3). If we exclude over collections of 24h urine based on an individual’s average 24 h urine creatinine the episodes of hypercalciuria are reduced from 88 to 81 and number women from 48 to 47 (Table 2). These 81 episodes of hypercalciuria >300 mg/d (7.7mmol) occurred in 32% of women. Hypercalciuria occurred once in half and more than once in the other half of women, supplements were reduced in 5 women. The 2 women who may have had mild primary hyperparathyroidism did not have any episodes of hypercalciuria. There was no significant association between episodes of hypercalciuria and the vitamin D dose or serum 25OHD level. Women who develop hypercalciuria or hypercalcemia are not usually the same people and only 2 women developed both as shown in figure 4. All the data was used to plot the graphs.
Figure 2.
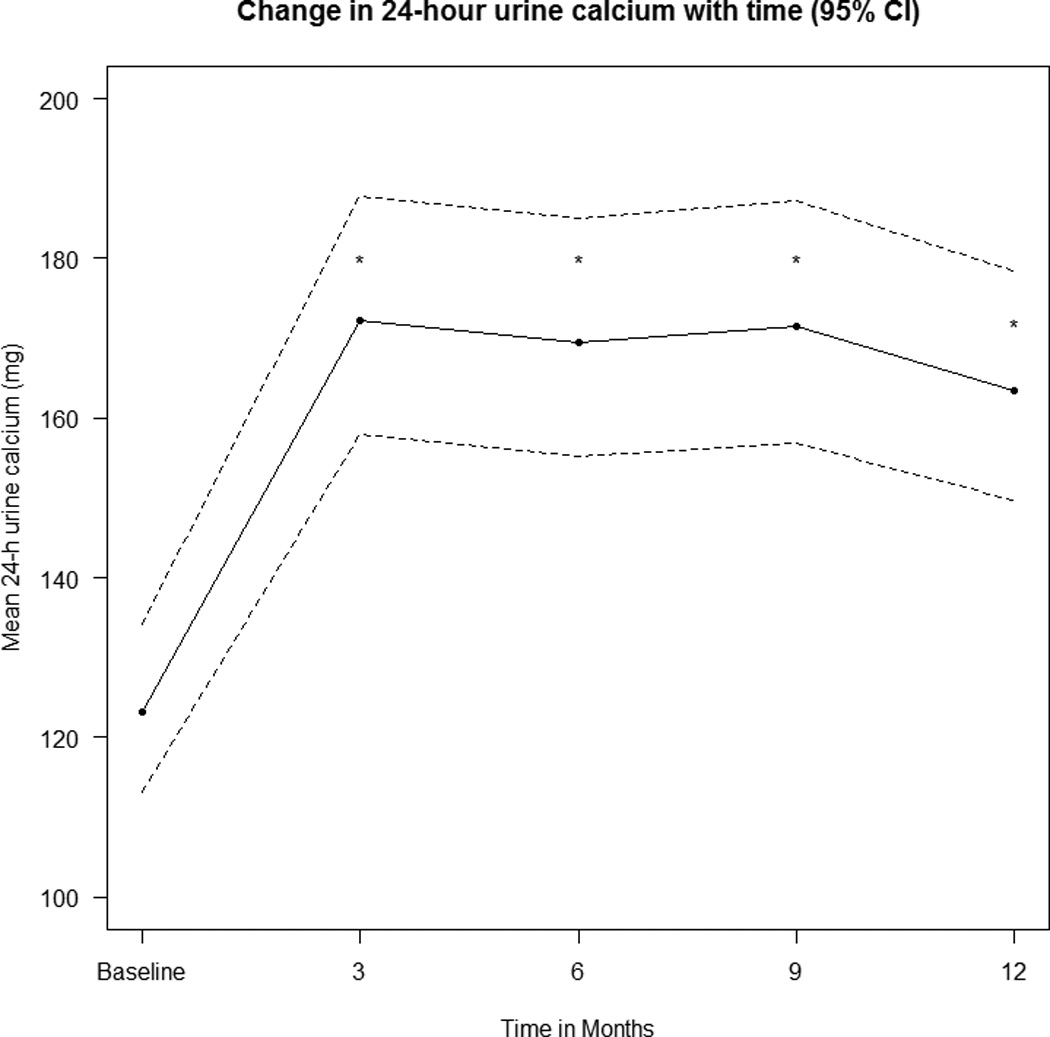
The change in mean (95% CL) 24h urine calcium over time and has been adjusted for dose, estimated by a mixed-effects model. * indicates that the result is significantly different from baseline with p<0.0001.
Figure 3.
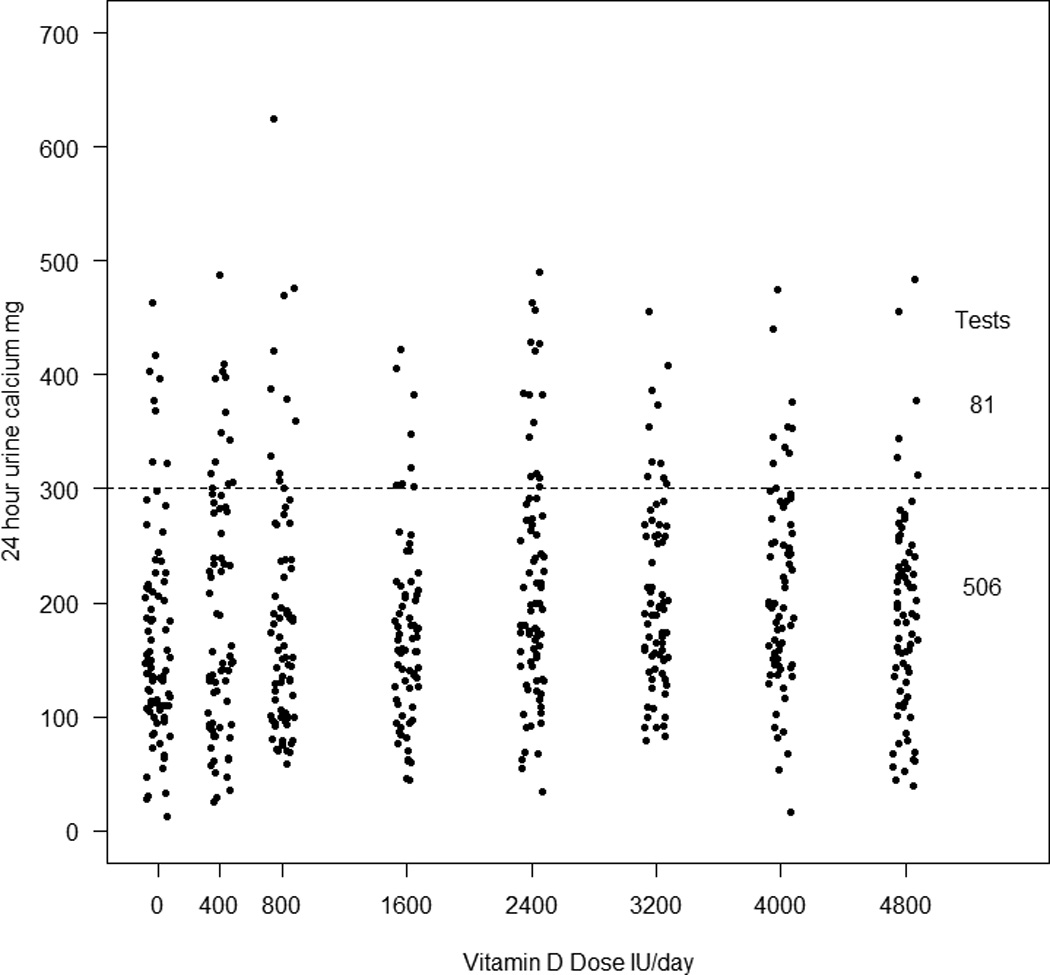
Incidence of hypercalciuria and vitamin D dose.The dotted line indicates an upper normal range of 300mg.There were 81 episodes of hypercalciuria > 300mg in 47 women (32%) and were unrelated to vitamin D dose.
Figure 4.
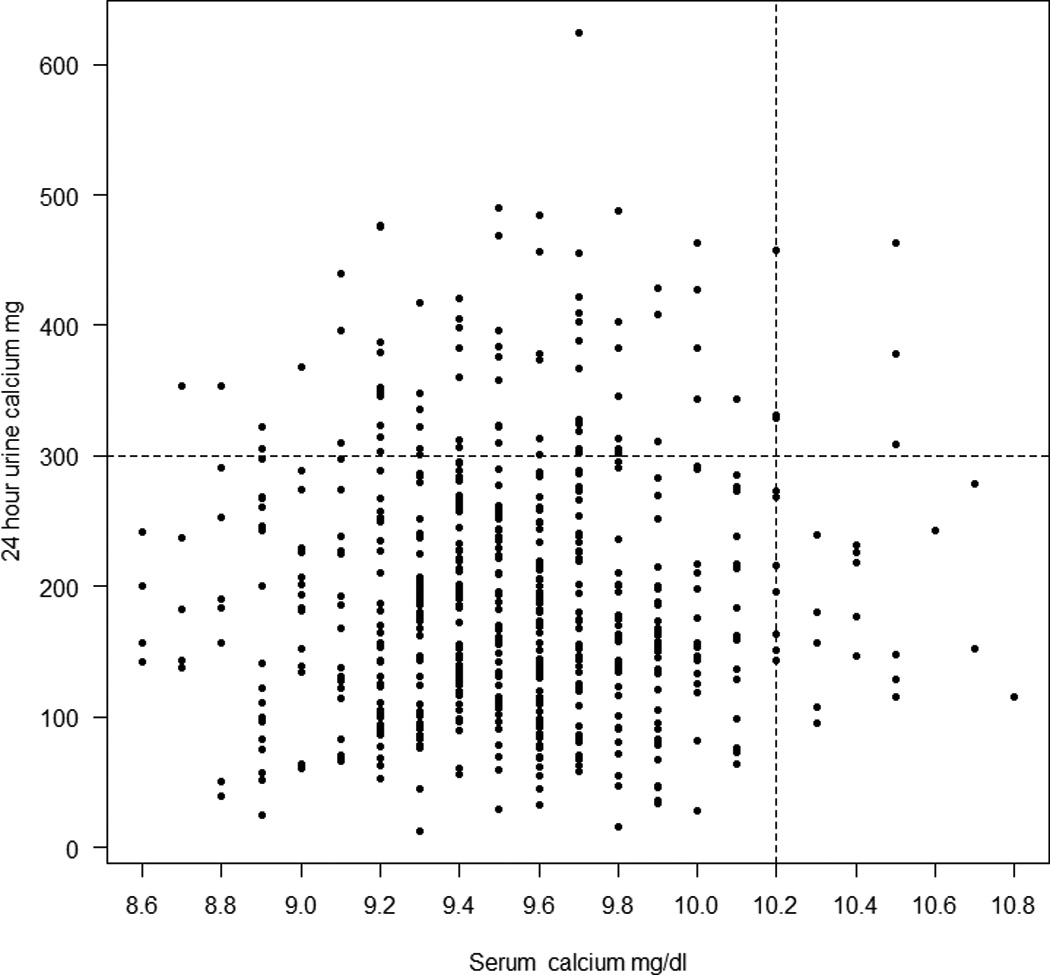
All serum calcium and 24h urine calcium values during study. The upper normal range for serum calcium and 24h urine calcium is indicated by the dotted lines. Only 2 women had both hypercalcemia and hypercalciuria ; most have either one or the other.
In 19 women 24-hour urine calcium increased to > 400 mg (10 mmol); after repeated testing urine calcium was below 300 mg (7.5 mmol) in 14 and remained high in 5. Out of these 5 women, calcium was discontinued in 2 and follow-up urine calcium was less than 300 mg/d (7.5 mmol). But in 2 women hypercalciuria continued and both calcium and vitamin D were discontinued permanently. One woman refused follow-up testing. We found marginal associations between the baseline 24 h urine calcium and calcium intake estimated from the 7 day food diary (p< 0.074) and with average caffeine intake (p< 0.077)
Mixed Effects Model
Log10 transformation of urine calcium improved the fit of the model. Model fit was examined with various residual plots and AIC values and the models were determined to fit well. In fitting the model 161 women had urine calcium at baseline, 154 at 3 months, 148 at 6 months, 146 at 9 months, and 146 at 12 months. 163 women had serum calcium at baseline, 154 at 3 months, 149 at 6 months, 148 at 9 months, and 147 at 12 months. The dose*time interaction was not significant for urine calcium (p=0.20) or serum calcium models (p=0.17). Baseline levels of 24h urine calcium were significantly lower than all the other time points (p<0.0001), but none of the other time points differed significantly from each other (figure 2). Urine calcium levels did not change significantly with vitamin D dose. There was a significant increase in serum calcium from baseline to 6 months (p=0.029), but none of the other pairwise comparisons were significant, including between baseline and 12 months (p=0.56). Serum calcium levels did not change significantly with vitamin D dose.
PTH Results
At baseline six women had high serum PTH (>65pg/ml), in 4 the values decreased to normal at 6 months and in two women PTH levels remained high at 6 and 12 months. In retrospect these 2 women may have had primary hyperparathyroidism and their data on serum and 24-h urine calcium has not been used. Mean PTH decreased at the end of the study while serum and 24h urine calcium increased.
Multivariate model
Generalized logistic regression was used to fit a multivariate model that predicts which women develop hypercalciuria of 300–400 mg and >400 mg. We considered baseline predictors that were significant in the univariate comparisons namely, age and urine calcium at baseline. From the model, age and urine calcium level at baseline are significant predictors of hypercalciuria. A one year increase in age results in 23% decrease in risk of developing 24h urine calcium >400 mg (10 mmol) (odds ratio (OR)=0.77; 95% CI=0.67, 0.90; p=0.0007). The odds of having a urine calcium 300–400 mg (7.5–10 mmol) versus < 300 mg (7.5 mmol) did not differ significantly with age (p=0.16). For every 1 mg increase in baseline 24h urine calcium results there was a 3% increase in the risk of urine calcium >400 mg (10 mmol) (OR=1.03; 95% CI=1.02, 1.04) and a 2% increase in the risk of urine calcium between 300–400 mg (7.5–10 mmol) (OR=1.02; 95% CI=1.01, 1.03) compared to the reference group of urine calcium <300 mg (7.5 mmol) (p<0.0001).
Prediction of Hypercalciuria using ROC curves for urine calcium at baseline
We used receiver operator curves (ROC) to determine a cutpoint of urine calcium at baseline that would predict a urine calcium >=300 mg during the course of the treatment. The ROC curve gave optimal sensitivity (87.2%) and specificity (70.1%) with an area under the curve of 0.85 (95% CI: 0.78–0.92) for a baseline urine calcium cutpoint of >132mg (Table 3)
Table 3.
Prediction of Hypercalciuria using ROC curves for urine calcium at baseline
| 24h urine calcium cut- off point |
Sensitivity | Specificity |
|---|---|---|
| > 132 mg | 87.2% (41/47) | 70.1%(68/97 |
| >=150 mg | 76.6% (36/47) | 80.4% (78/97) |
| >=170 mg | 76.6% (36/47) | 83.5% (81/97) |
| >=180 mg | 66.0% (31/47) | 89.7% (87/97) |
| >=190 mg | 55.3% (26/47) | 89.7% (87/97) |
| >=200 mg | 44.7% (21/47) | 93.8% (91/97) |
We used a multivariate logistic regression model to predict >=300 mg during the course of the study, using the cutpoint determined for baseline urine calcium and age. A subject with urine calcium at baseline >132 mg results in a 15 times greater risk of urine calcium >=300 during the course of the study than a subject with a urine calcium level at baseline <=132 mg (OR=15.3; 95% CI=5.44, 43.01, p<0.0001). A one year increase in age results in 10% decrease (or 0.90 times) in the risk of developing urine calcium >=300 mg (OR=0.90, 95% CI=0.84, 0.97; p=0.0044).
Other cutpoints were explored for baseline urine calcium using a multivariate logistic regression model (Table 3). If the cutpoint was >=180 for baseline urine calcium then there was a 20 times greater risk of urine calcium >=300 during the course of the study compared to a subject with a urine calcium level at baseline <180 mg. (OR=18.1; 95% CI=6.7,49.2; p<0.0001).
Adverse events Safety and Adverse Events
There were a total of 11 serious adverse events in 11 women. Three of these were rated as severe in intensity including diverticulitis, congestive heart failure and a tibia-fibula fracture and 7 of the events described as moderate including angina, syncope, hip surgery, radial fracture, COPD exacerbation, stroke and partial thyroidectomy for a nodule-none were attributed to vitamin D use. There was a small but significant increase of 0.068 mg/dl (95% confidence interval 0.041 to 0.096; p<0.0001) in serum creatinine. One subject had an increase of 0.4mg/dl, 4 had an increase of 0.3mg/dl and 12 had an increase of 0.2 mg/dl over 1 year. There were no symptomatic episodes of kidney stones.
Discussion
This is the first prospective controlled study that reports in detail the effects of vitamin D and calcium on serum and 24 hour urine calcium in older women. During a year of 3-monthly tests 8.8% of women developed hypercalcemia and 32% women developed hypercalciuria.
No relationship was found between episodes of hypercalcemia and hypercalciuria and either the vitamin D3 dose or serum 25OHD but 24h urine calcium was weakly related to the 12-month serum 25OHD level. The women that develop hypercalciuria appear to be different from those that develop hypercalcemia as shown in Figure 4 but we found no difference in any variables that explained this finding. It is notable that hypercalcemia and hypercalciuria occurs in the placebo group that received only calcium and placebo vitamin D so even a modest calcium supplementation of 600 mg day may be too high for some women. 16% of women increase urine calcium more than 400mg and another 14% increase more than 300mg. If other risk factors for stone formation are present then these results are clinically relevant since we know that stone formers occur in 6% of the population
It is notable that hypercalcemia and hypercalciuria occurs in the placebo group that received only calcium and placebo vitamin D so even a modest calcium supplementation of 600 mg day may be too high for some women.
Although all of our women were vitamin D insufficient on entry into study there is no evidence that in this group treatment with vitamin D and calcium can cause hypercalcemia and hypercalciuria as shown in a previous study (11)
Few studies have reported the occurrence of hypercalciuria or hypercalcemia. In a placebo controlled study of 583 elderly women in France, participants were randomized to either calcium 1200mg given as calcium phosphate and vitamin D 800 IU or double placebo; the baseline dietary calcium was 558mg/d. On calcium+ vitamin D there was a significant increase in serum calcium but there was no information about hypercalcemia. 24 h urine calcium increased from 119 to 167mg (3.0–4.1 mmol) compared to placebo and 3.4% had values > 350mg (8.7 mmol) (12). In a placebo controlled study 192 older women were treated twice daily with a combination tablet of vitamin D 400 IU and calcium 500 mg/d given as calcium carbonate; baseline calcium intake was 736 mg. Twenty percent of women had a 24-hour urine calcium excretion above the normal threshold in the treatment group compared to placebo (159 mg (4.0 mmol) vs 94 mg (2.3 mmol) P < 0.001).There was no significant difference in the incidence of hypercalcemia between the two groups (7.4% vs 11.5%)(13).
In a 4 year controlled study of calcium supplements given as calcium citrate only versus placebo, 236 healthy postmenopausal women took calcium 1234 mg/d together with a baseline calcium intake of 711 mg/day so women received a total calcium intake of about ~2,000 mg/day. In this study, 50% of women in the calcium treated group and 8% in the placebo group had 24 h urine calcium levels exceeding 350 mg/day (8.7 mmol) and 44% had to reduce their calcium supplement. Only 1 patient on calcium developed mild hypercalcemia (14).
In epidemiologic studies the risk of stone formation increases with higher levels of urine calcium even though stone formers are known to have other risk factors (15,16).
In the WHI trial (8), the group given vitamin D 400IU together with a calcium supplement of 1000 mg had a 17% increase in kidney stones compared to placebo (HR = 1.17; 95% CI 1.02–1.34). Since the baseline dietary calcium was 1100 mg and final calcium intake was 2200mg/day it is more likely that the high calcium intake was the major contributing factor given the findings in this study. It is commonly thought that vitamin D increases calcium absorption, however we showed in this older age group of women that there was no effect of vitamin D 400 IU daily on calcium absorption (17) and in younger women there was no effect of vitamin D up to a dose of 2400 IU daily on calcium absorption (18). It seems unlikely therefore that vitamin D 400 IU/d could cause hypercalciuria and renal stones in the WHI trial (8).
One explanation for the absence of kidney stones in calcium intervention studies in osteoporosis is that studies are small and last only 2–3 years compared to WHI study that followed women for 7 years. In the observational study from WHI there was a 2.5% incidence of kidney stones during 7 years of follow up. Stone risk decreased by 28% with the highest quartile of dietary calcium intake and decreased by 20% on higher water intakes (19). But the trial included women with a history of renal stones.
In the Nurses Heath Study (NHS II) of women age 27–44 years, higher dietary calcium was associated with a 45% lower stone risk, but there was no effect of calcium supplements on stone risk (20) Similar results were found in the Health Professional study (HPS) in men (21) but a later analysis of the same study reported that the effect of dietary calcium effect on reducing stone risk only applied to men under age 60 years and was not seen in men older than sixty years (22).In a 16 year follow up of women in the first Nurses Health Study (NHS I), higher dietary calcium was shown to reduce stone risk by 35% whereas the use of calcium supplements increased stone episodes by 20%; this was the first study to link calcium supplementation to stone risk (23).
The strengths of our study are systematic measurements of serum and 24h urine calcium, a 7-day food diary to record nutritional intake, adjustment for known covariates, excellent compliance and measurement of serum and 24h urine calcium every 3 months. We excluded women if they had a baseline 24h urine calcium > 300 mg (7.5 mmol) thereby limiting those at risk for hypercalciuria and thus may have underestimated the effects of the supplements.
Our study has some limitations. We did not use fixed dose calcium so women with low calcium intake received higher supplemental calcium, however, 70%of the women received an average of 600–800 mg/d. Because we did not have a placebo group without calcium supplementation we cannot be sure that hypercalciuria in these women is due only to the calcium supplements.
These results may not apply to other age groups or ethnic groups because of differences in calcium and vitamin D metabolism.
Healthcare practitioners who advise women on osteoporosis prevention seldom consider the issue of hypercalcemia and hypercalciuria by testing serum and urine calcium on an ongoing basis. It is known that 5–8% of men and women have idiopathic hypercalciuria which is a risk factor for kidney stones and one would expect that millions of men and women who take calcium supplements are in this risk group. The epidemiology studies discussed above suggest that a high dietary calcium intake is associated with a lower risk for kidney stones and that calcium supplements increased the risk (23).
CONCLUSIONS
In summary, episodes of hypercalcemia and hypercalciuria are common events on calcium and vitamin D supplementation; they are unrelated to the vitamin D dose or serum 25OHD. Whether it is due to calcium alone or the combination with vitamin D remains uncertain. Further investigation is needed to define better those that develop hypercalciuria and hypercalcemia but a high baseline 24h urine calcium is one predictor of hypercalciuria. It is advisable before starting calcium and vitamin D supplements to measure blood and urine calcium and perform a follow up measurement within 3 months.
Supplementary Material
Acknowledgements
We would like to thank all our study participants and the Bone Metabolism Unit Research staff for their hard work and contribution to the study and members of the Data Safety and Monitoring Board for their scientific guidance.
Primary Funding Source: This study was supported by grant AG28168 from the National Institutes of Aging and Office of Dietary Supplements.
Footnotes
Financial Disclosures: Dr. Gallagher received at no cost calcium supplements from Bayer for this study. No disclosures were reported from other authors.
References
- 1.Dietary reference intakes for calcium and vitamin D. Washington, DC: The National Academies Press; 2011. Institute of Medicine. [PubMed] [Google Scholar]
- 2.Blank S, Scanlon KS, Sinks TH, Lett S, Falk H. An outbreak of hypervitaminosis D associated with the overfortification of milk from a home-delivery dairy. Am J Public Health. 1995 May;85(5):656–659. doi: 10.2105/ajph.85.5.656. [DOI] [PMC free article] [PubMed] [Google Scholar]
- 3.Melamed ML, Michos ED, Post W, Astor B. 25-hydroxyvitamin D levels and the risk of mortality in the general population. Arch Intern Med. 2008 Aug 11;168(15):1629–1637. doi: 10.1001/archinte.168.15.1629. [DOI] [PMC free article] [PubMed] [Google Scholar]
- 4.Durup D, Jørgensen HL, Christensen J, Schwarz P, Heegaard AM, Lind B. A Reverse J-Shaped Association of All-Cause Mortality with Serum 25-Hydroxyvitamin D in General Practice: The CopD Study. J Clin Endocrinol Metab. 2012 Aug;97(8):2644–2652. doi: 10.1210/jc.2012-1176. [DOI] [PubMed] [Google Scholar]
- 5.Beall DP, Scofield RH. Milk-alkali syndrome associated with calcium carbonate consumption. Report of 7 women with parathyroid hormone levels and an estimate of prevalence among women hospitalized with hypercalcemia. Medicine (Baltimore) 1995 Mar;74(2):8. doi: 10.1097/00005792-199503000-00004. [DOI] [PubMed] [Google Scholar]
- 6.Picolos MK, Lavis VR, Orlander PR. Milk-alkali syndrome is a major cause of hypercalcaemia among non-end-stage renal disease (non-ESRD) in women. Clin Endocrinol (Oxf) 2005 Nov;63(5):566–576. doi: 10.1111/j.1365-2265.2005.02383.x. [DOI] [PubMed] [Google Scholar]
- 7.Bolland MJ, Avenell A, Baron JA, Grey A, MacLennan GS, Gamble GD, Ian R Reid. Effect of calcium supplements on risk of myocardial infarction and cardiovascular events: meta-analysis. BMJ. 2010;341:c369. doi: 10.1136/bmj.c3691. [DOI] [PMC free article] [PubMed] [Google Scholar]
- 8.Jackson RD, LaCroix AZ, Gass M, Wallace RB, Robbins J, Lewis CE, Bassford T, et al. Women’s Health Initiative Investigators. Calcium plus vitamin D and the risk of fractures. N Engl J Med. 2006;354:669–683. doi: 10.1056/NEJMoa055218. [DOI] [PubMed] [Google Scholar]
- 9.Gallagher JC, Sai A, Templin T, 2nd, Smith L. Dose response to vitamin D supplementation in postmenopausal women: a randomized trial. Ann Intern Med. 2012 Mar 20;156(6):425–437. doi: 10.7326/0003-4819-156-6-201203200-00005. [DOI] [PubMed] [Google Scholar]
- 10.Gallagher JC, Fowler SE, Detter JR, Sherman SS. Combination treatment with estrogen and calcitriol in the prevention of age-related bone loss. J Clin Endocrinol Metab. 2001 Aug;86(8):3618–3628. doi: 10.1210/jcem.86.8.7703. [DOI] [PubMed] [Google Scholar]
- 11.Leaf DE, Korets R, Taylor EN, Tang J, Asplin JR, Goldfarb DS, Gupta M, Curhan GC. Effect of vitamin D repletion on urinary calcium excretion among kidney stone formers. Clin J Am Soc Nephrol. 2012 May;7(5):829–834. doi: 10.2215/CJN.11331111. [DOI] [PubMed] [Google Scholar]
- 12.Chapuy MC, Pamphile R, Paris E, Kempf C, Schlichting M, Arnaud S, Garnero P, Meunier PJ. Combined calcium and vitamin D3 supplementation in elderly women: confirmation of reversal of secondary hyperparathyroidism and hip fracture risk: the Decalyos II study. Osteoporos Int. 2002 Mar;13(3):257–264. doi: 10.1007/s001980200023. [DOI] [PubMed] [Google Scholar]
- 13.Brazier M, Grados F, Kamel S, Mathieu M, Morel A, Maamer M, Sebert JL, Fardellone P. Clinical and laboratory safety of one year's use of a combination calcium + vitamin D tablet in ambulatory elderly women with vitamin D insufficiency: results of a multicenter, randomized, double-blind, placebo-controlled study. Clin Ther. 2005 Dec;27(12):1885–1893. doi: 10.1016/j.clinthera.2005.12.010. [DOI] [PubMed] [Google Scholar]
- 14.Riggs BL, O'Fallon WM, Muhs J, O'Connor MK, Kumar R, Melton LJ., 3rd Long-term effects of calcium supplementation on serum parathyroid hormone level, bone turnover, and bone loss in elderly women. J Bone Miner Res. 1998 Feb;13(2):168–174. doi: 10.1359/jbmr.1998.13.2.168. [DOI] [PubMed] [Google Scholar]
- 15.Robertson WG, Morgan DB. The distribution of urinary calcium excretions in normal persons and stone-formers. Clin Chim Acta. 1972;37:503–508. doi: 10.1016/0009-8981(72)90475-5. [DOI] [PubMed] [Google Scholar]
- 16.Curhan GC, Willett WC, Speizer FE, Stampfer MJ. Twenty-four-hour urine chemistries and the risk of kidney stones among women and men. Kidney Int. 2001;59:2290. doi: 10.1046/j.1523-1755.2001.00746.x. [DOI] [PubMed] [Google Scholar]
- 17.Gallagher JC, Yalamanchili V, Smith LM. The Effect of Vitamin D on Calcium Absorption in Older Women. J Clin Endocrinol Metab. 2012;97(10):3550–3556. doi: 10.1210/jc.2012-2020. [DOI] [PMC free article] [PubMed] [Google Scholar]
- 18.Gallagher JC, Jindal P, Lynette MS. Vitamin D does not Increase Calcium Absorption in Young Women: A Randomized Clinical Trial. J Bone Miner Res. 2013 Oct 28; doi: 10.1002/jbmr.2121. [Epub] [DOI] [PubMed] [Google Scholar]
- 19.Sorensen MD, Kahn AJ, Reiner AP, Tseng TY, Shikany JM, Wallace RB, Chi T, Wactawski-Wende J, Jackson RD, O'Sullivan MJ, Sadetsky N, Stoller ML. Impact of nutritional factors on incident kidney stone formation: a report from the WHI OS: J Urol. 2012 May;187(5):1645–1649. doi: 10.1016/j.juro.2011.12.077. [DOI] [PMC free article] [PubMed] [Google Scholar]
- 20.Curhan GC, Willett WC, Knight EL, Stampfer MJ. Dietary factors and the risk of incident kidney stones in younger women: Nurses' Health Study II. Arch Intern Med. 2004;164:885. doi: 10.1001/archinte.164.8.885. [DOI] [PubMed] [Google Scholar]
- 21.Curhan GC, Willett WC, Rimm EB, Stampfer MJ. A prospective study of dietary calcium and other nutrients and the risk of symptomatic kidney stones. N Engl J Med. 1993;328:833. doi: 10.1056/NEJM199303253281203. [DOI] [PubMed] [Google Scholar]
- 22.Taylor EN, Stampfer MJ, Curhan GC. Dietary factors and the risk of incident kidney stones in men: new insights after 14 years of follow-up. J Am Soc Nephrol. 2004 Dec;15(12):3225–3232. doi: 10.1097/01.ASN.0000146012.44570.20. [DOI] [PubMed] [Google Scholar]
- 23.Curhan GC, Willett WC, Speizer FE, Spiegelman D, Stampfer MJ. Comparison of dietary calcium with supplemental calcium and other nutrients as factors affecting the risk for kidney stones in women. Ann Intern Med. 1997 Apr 1;126(7):497–504. doi: 10.7326/0003-4819-126-7-199704010-00001. [DOI] [PubMed] [Google Scholar]
Associated Data
This section collects any data citations, data availability statements, or supplementary materials included in this article.