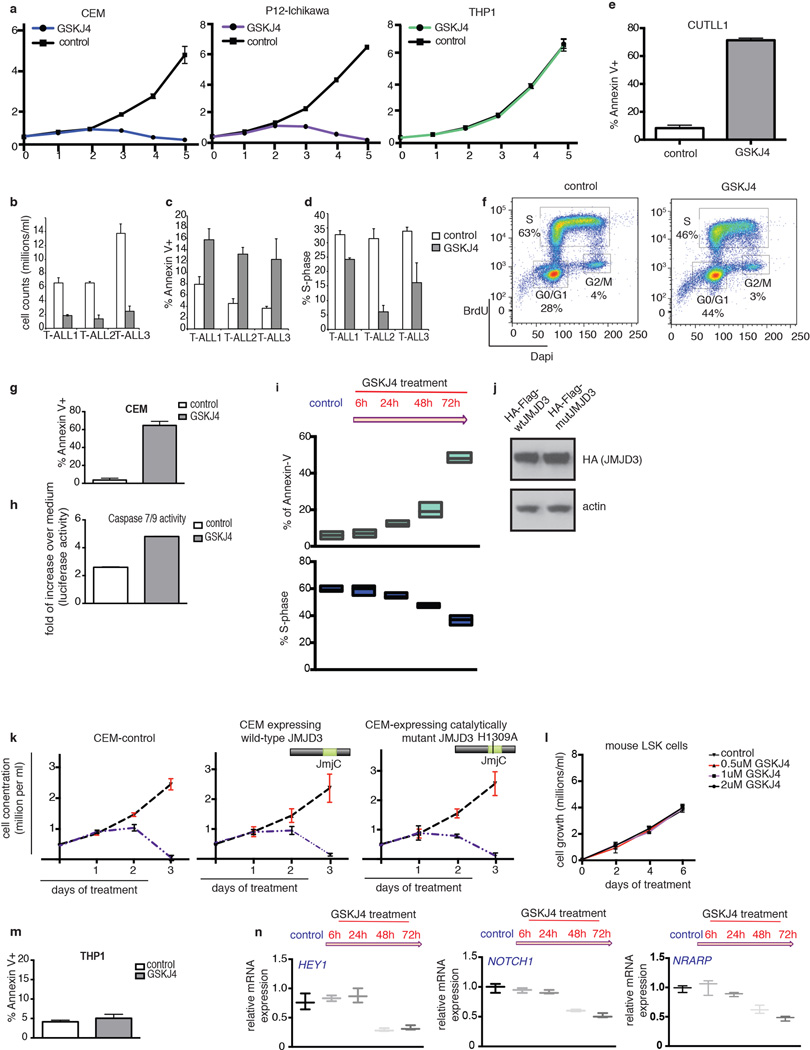
Extended Data Figure 8. GSKJ4 inhibitor induces apoptosis and cell cycle arrest of T-ALL-but not myeloid leukemia or physiological LSK-cells.
a, Effect of GSKJ4 (at 2µM concentration) on a panel of T-ALL and myeloid lines. The average of three representative studies is shown. b–d, Effects on cell growth (b), apoptosis (c) and cell cycle (d) in three primary T-ALL lines. The average of three representative studies is shown. e, f, Measurement of apoptosis (e, n=3) and cell cycle effects (f, representative study of three experiments) in CUTLL1 cells 72 hours post treatment with the inhibitor. g, h, Apoptosis assays using Annexin V staining of CEM (g) after a period of 72 hours of treatment and measuring caspase 7/9 activity upon treatment of CUTLL1 (h) T-ALL cells with GSKJ5 and GSKJ4 over a period of 24 hours. i, Timecourse studies of Annexin V (upper panel) and cell cycle (lower panel) analysis of CUTLL1 cells over a period of 72h during GSKJ4 treatment according to the scheme on top of the figure. j, Expression of wild-type and catalytic mutant of JMJD3 in T-ALL (CEM) cells. k, Cell growth analysis of T-ALL cells overexpressing wild type and catalytically mutant JMJD3 upon GSJ4 treatment over a period of 72h. Average representation of three independent experiments is shown. l, Cell growth of LSK upon treatment with control (2uM) and different concentrations of GSKJ4 inhibitor. m, Annexin V staining of THP1 cells after a period of 72 hours of GSKJ4 and GSKJ5 (control) treatment at 2mM concentration. Average representation of three independent experiments is shown. n, mRNA levels are shown for three classical NOTCH1 targets (HEY1, NRARP and NOTCH1) over a period of 72h during GSKJ4 treatment. Average representation of three independent experiments is shown.

