

Abstract
DCs develop from multipotent progenitors (MPPs), which commit into DC-restricted common dendritic cell progenitors (CDPs). CDPs further differentiate into classical DCs (cDCs) and plasmacytoid DCs (pDCs). Here, we studied the impact of histone acetylation on DC development in C57BL/6 mice by interfering with histone acetylation and deacetylation, employing histone deacetylase (HDAC) inhibitors. We observed that commitment of MPPs into CDPs was attenuated by HDAC inhibition and that pDC development was specifically blocked. Gene expression profiling revealed that HDAC inhibition prevents establishment of a DC-specific gene expression repertoire. Importantly, protein levels of the core DC transcription factor PU.1 were reduced in HDAC inhibitor-treated cells and consequently PU.1 recruitment at PU.1 target genes Fms-like tyrosine kinase 3 (Flt3), interferon regulatory factor 8 (IRF8), and PU.1 itself was impaired. Thus, our results demonstrate that attenuation of PU.1 expression by HDAC inhibition causes reduced expression of key DC regulators, which results in attenuation of DC development. We propose that chromatin modifiers, such as HDACs, are required for establishing a DC gene network, where Flt3/STAT3 signaling drives PU.1 and IRF8 expression and DC development. Taken together, our study identifies HDACs as critical regulators of DC lineage commitment and development.
Keywords: Dendritic cells, Flt3, HDAC, Histone acetylation, PU.1
Additional supporting information may be found in the online version of this article at the publisher's web-site
Introduction
DCs function as sentinels by continuously sampling their environment for the presence of antigens 1. As such, DCs are central in induction of adaptive immunity and tolerance to foreign and self-antigens, respectively. A number of DC subsets has been identified, each with a specialized function 1. DCs are categorized according to their location into lymphoid tissue-resident DCs, found, e.g. in spleen, and nonlymphoid tissue DCs, as present for example in skin 1. Lymphoid tissue-resident DCs include classical DCs (cDCs) and plasmacytoid DCs (pDCs). cDCs are further subdivided according to expression of specific surface markers into CD8α+ cDCs and CD11b+ cDCs.
DC development from HSCs and multipotent progenitors (MPPs) occurs via a set of precursors, which progressively loose developmental potential 1–3. The DC lineage consists of macrophage/DC precursors (MDPs), which further progress into fully DC-restricted common DC precursors (CDPs). CDPs develop into preDCs, which are precursors of cDCs, and pDCs 1,4.
Transcription factors are central mediators of cell fate decisions and are important for maintenance of cell identity and function. The ETS factor PU.1 for example, is one of the key regulators of hematopoiesis and is expressed by all hematopoietic cells 2,5. PU.1 associates with lineage-determining factors, e.g. E2A for B cells, to collaboratively occupy lineage-specific binding sites and induce lineage-specific gene expression 6. PU.1 is also a central player in DC development as it directly binds Fms-like tyrosine kinase 3 (Flt3) regulatory regions and induces Flt3 expression 7. The receptor tyrosine kinase Flt3 is expressed by DC precursors and DCs and Flt3/STAT3 signaling is considered as the central pathway for steady-state DC development 8,9. Flt3 expression is induced by PU.1 and thereby affects development of DCs from DC-committed precursors 7.
PU.1 also binds a specific enhancer region in the interferon regulatory factor 8 (IRF8) locus, which is a prerequisite to elevate IRF8 expression sufficiently for induction of DC lineage commitment 10. Furthermore, PU.1 regulates its own expression in a cell type-specific manner via interaction with cell type-specific transcription factors 11,12. Lack of PU.1, Flt3, or IRF8 causes a strong reduction in DC development 1,2. Other transcription factors have been identified that are critical for development of specific DC subsets, e.g. E2–2/Tcf4 and SpiB for pDCs and Id2 and Batf3 for CD8α+ cDCs 1,2,13,14. Yet, how expression of these factors is regulated and whether PU.1 is involved remains elusive.
Increasing evidence indicates that chromatin remodeling mediates hematopoietic cell fate decisions by affecting gene expression 15. Acetylation of histones increases accessibility of chromatin, which results in higher gene expression and is therefore seen as activating mark 16–18. The level of histone acetylation is regulated by histone acetyltransferases (HATs) and histone deacetylases (HDACs), which add and remove acetyl groups at lysine residues, respectively 17. Interestingly, genome-wide chromatin immunoprecipitation (ChIP-Seq) experiments showed that HATs as well as HDACs are positioned at actively transcribed genes, suggesting that both activities contribute to the level of gene expression 19. Thus, the net result of HAT and HDAC activity at a gene determines its acetylation status and expression level.
Specific HDAC inhibitors have been developed, which cause hyperacetylation of genes and which have been used to treat a variety of cells, in vitro and in vivo 17. We have shown previously, for example, that the broad-range HDAC inhibitor Trichostatin A (TSA) induces pluripotency-associated genes in neurosphere cells 20. In leukemia, HDAC inhibitors have a negative effect on cancer stem cells 21. In normal hematopoiesis, the effect of HDAC inhibition is diverse and the outcome depends on the cell state, cell type, and environment 22. MPPs, for example, are maintained in a more immature state and their differentiation is inhibited, when cells are treated with HDAC inhibitors 23,24. These observations are corroborated by using gene knockout mice 25. Deletion of HDAC3 in the hematopoietic compartment resulted in accumulation of immature MPPs and loss of lymphocytes.
In addition, HDAC inhibition has immunomodulatory consequences. DCs treated with HDAC inhibitor showed decreased expression of maturation markers and cytokines upon stimulation 21. Furthermore, HDAC inhibition blocked GM-CSF-induced development of inflammatory DCs 26,27. Yet, the impact of HDAC inhibition on steady-state DC development and cDC and pDC subset specification has not been analyzed so far.
In our previous work, we have shown that transition of MPPs to CDPs is accompanied by a switch in gene expression: stem and progenitor cell associated genes are downregulated and a DC-primed expression profile is activated 28,29. Further differentiation of CDPs into cDCs or pDCs establishes a cell type-specific gene expression repertoire. Such rewiring of gene expression, associated with cell fate decisions, is governed by chromatin remodeling. In this study, we have examined how histone acetylation and deacetylation affects DC lineage development.
Results
Cell type-specific histone acetylation during stem cell commitment and DC differentiation
MPP commitment toward CDPs and further differentiation into cDCs or pDCs entails increasingly restricted gene expression and induction of DC subset-specific genes. Such lineage decisions involve extensive chromatin remodeling, including changes in histone marks. Therefore, we determined whether changes in gene expression during differentiation of MPPs into CDPs and further into cDCs or pDCs are correlated with changes in histone acetylation.
Bone marrow cells were cultured as described 28 to obtain MPPs, CDPs, cDCs, and pDCs. Each cell population was purified by FACS and subjected to gene expression analysis by RT-qPCR and to ChIP for acetylation of histone 3 lysine 9 (H3K9ac). We focussed on a selected set of transcription factors and growth factor receptors, which are either involved in maintenance of stem cell identity and development of non-DC lineages (Id1, Gata2, Gfi1, c-kit, C/ebpα, and Id3) or in DC generation (PU.1, Flt3, IRF8, Id2, and Tcf4).
As expected, Id1, C/ebpα, Gata2, and Gfi1 cluster together, since expression of these genes was downregulated during transition from MPPs to CDPs and remained low or absent in cDCs and pDCs (Fig.1A). ChIP for H3K9ac showed that also histone acetylation levels of Id1 and Gfi1 decreased from MPPs to CDPs and further to DCs, to reach virtually background levels (Fig.1B).
Figure 1.
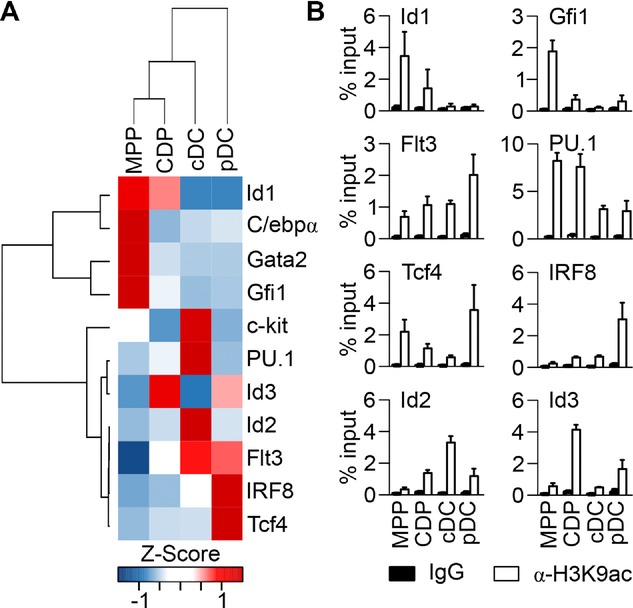
Gene expression and H3K9 acetylation during DC lineage commitment and differentiation. Bone marrow cells from C57BL/6 mice were cultured with Flt3L, hyper-IL-6, IGF-1, and SCF during 7 days. MPPs and CDPs were sorted by FACS as Gr1−Flt3−/loc-kithi cells and Gr1−Flt3+c-kitint cells, respectively. MPP/CDP cultures were also induced to differentiate with Flt3L into cDCs and pDCs, which were sorted as CD11c+CD11bhiB220lo cells and CD11c+CD11bloB220hi cells, respectively. (A) Sorted MPPs, CDPs, cDCs, and pDCs were lysed and total RNA was isolated and subjected to RT-qPCR. Gene expression data from 1 set of sorted MPPs, CDPs, cDCs, and pDCs were analyzed by bidirectional hierarchical clustering and are displayed in heatmap format (blue: expression levels below median; white: expression levels equal to median; red: expression levels above median). (B) To assess the level of histone acetylation, sorted MPPs, CDPs, cDCs, and pDCs were cross-linked with 1% formaldehyde and used for ChIP with an H3K9ac-specific antibody. An IgG isotype was used as control. Immunoprecipitated DNA was quantified by qPCR and H3K9ac levels are shown as percentage of input. Results (mean + SD) of three independent ChIP experiments are shown.
In contrast, genes associated with DC lineage, such as Flt3, PU.1, Tcf4, IRF8, and Id2, showed lowest expression in MPPs and were upregulated during DC differentiation (Fig.1A). Flt3 expression, the hallmark of the steady state DC lineage, was strongly induced from MPPs to CDPs and further to DCs. This gene expression pattern was reflected in the H3K9ac levels, which were lowest in MPPs and steadily increased toward DCs, showing highest acetylation in pDCs (Fig.1B). PU.1, a key regulator of DC development, was expressed at similar levels in MPPs and CDPs and this corresponded to similar levels of H3K9ac. Upon differentiation, PU.1 expression was upregulated towards cDCs. Interestingly, acetylation of PU.1 promoter clearly declined upon transition from CDPs to DCs, showing the same levels in both cDCs and pDCs.
Furthermore, DC subset-specific gene expression was accompanied by DC subset-specific histone acetylation. For example, Tcf4 and IRF8, which were highly expressed in pDCs, showed particularly high H3K9ac levels in these cells compared with cDCs. In contrast, Id2 exhibited highest expression and acetylation in cDCs. Finally, Id3, which showed CDP-specific expression, also displayed CDP-specific histone acetylation.
Taken together, changes in H3K9ac levels largely corresponded to changes in gene expression during the transition from MPPs to CDPs and also during differentiation of CDPs into cDCs or pDCs. Histone acetylation and deacetylation, therefore appears to undergo cell type-specific changes during DC lineage development.
HDAC inhibition interferes with DC lineage commitment in MPPs
Given the specific pattern of H3K9ac in MPPs, CDPs, cDCs, and pDCs, we next analyzed expression of Zn2+-dependent HDACs in each cell population. In general, HDACs of class I (HDAC1, 2, 3, and 8) are commonly expressed enzymes, whereas HDACs of class II and IV are more restricted in their expression pattern. We found that MPPs, CDPs, cDCs, and pDCs expressed all HDACs (Supporting Information Fig. 1A), but most of them at rather low levels. Highest expression was found for HDAC1, 2, and 3. Furthermore, several HDACs, such as HDAC1, 4, 6, and 7, were expressed at the same level in DC progenitors and DCs, whereas others (e.g. HDAC2, 3, 5, and 9) showed a more cell type-specific expression pattern (Supporting Information Fig. 1A).
The coordinated activity of HATs and HDACs determines the net acetylation status of histones. We reasoned that disturbance of this finely tuned balance would reveal the importance of histone acetylation for DC development. Therefore, MPP/CDP cultures were treated with HDAC inhibitors. We used broad-range inhibitors TSA, which inhibits all zinc-dependent HDACs (class I, IIa, IIb, and IV), and valproic acid (VPA), which affects HDACs of class I, IIa, and IV. Furthermore, we exposed MPP/CDP cultures to MS-275 (Entinostat), an inhibitor specific for class I HDAC1, 2, and 3. Supporting Information Fig. 1B shows the dose-dependent activity of each inhibitor on cell viability. High concentrations of TSA and MS-275 were toxic, whereas VPA had only a minor effect on cell viability at the concentrations used.
Next, we investigated if HDAC inhibition had an impact on cell fate decision from MPPs to CDPs. MPP/CDP cultures were treated with various concentrations of TSA, VPA, or MS-275 and 48 h later the percentage of MPPs and CDPs was determined by flow cytometry. All three inhibitors clearly affected the proportion of MPPs versus CDPs as with increasing concentrations TSA, VPA, and MS-275 the number of CDPs decreased (Fig.2A and B). At the highest inhibitor concentrations used, CDPs were reduced by more than 50% compared with control. Thus, HDAC inhibition keeps progenitor cells in a more primitive state and inhibits their commitment towards DC lineage. Moreover, the class I HDAC inhibitor MS-275 had a similar impact on MPP to CDP transition compared with the broad range inhibitors TSA and VPA. Therefore, activity of HDAC1, 2, and 3, which are abundantly expressed in DCs (Supporting Information Fig. 1A), is critical for DC lineage commitment.
Figure 2.
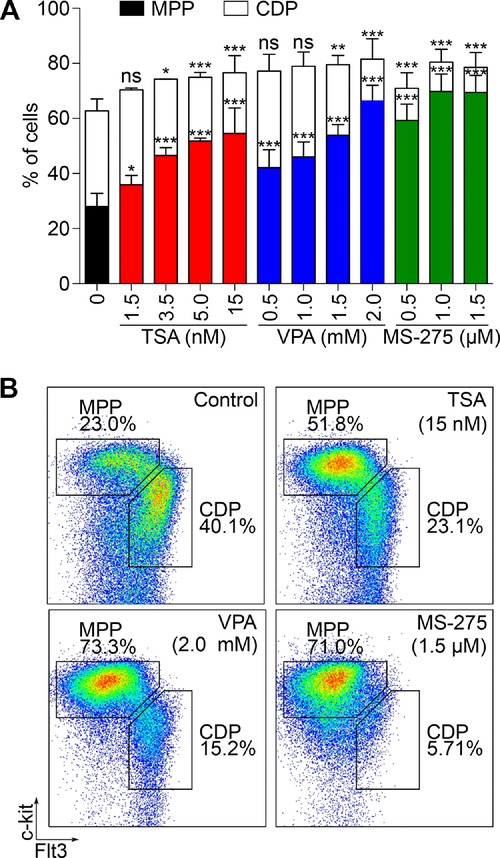
HDAC inhibition keeps progenitor cells in a primitive state. Bone marrow cells from C57BL/6 mice were amplified in vitro with Flt3L, hyper-IL-6, IGF-1, and SCF to obtain MPP/CDP cultures. On day 6 HDAC inhibitors (TSA, VPA, and MS-275) were added at indicated concentrations. Forty-eight hours later cells were collected, stained for Gr1, Flt3, and c-kit and analyzed by flow cytometry for MPPs and CDPs. Gating strategy for MPPs (Gr1−Flt3−/loc-kithi) and CDPs (Gr1−Flt3+c-kitint) is shown in Supporting Information Fig. 1C. (A) Percentages of MPPs and CDPs obtained by flow cytometry are depicted. Results are shown as mean + SD for Control (n = 12, three independent experiments), for TSA-treated cells (n = 3 or 6, one or two independent experiments, respectively) and for VPA and MS-275-treated cells (n = 4, two independent experiments). (B) Representative flow cytometry analysis of MPP and CDP populations after 48 h of HDAC inhibitor treatment. One representative analysis of three (Control) or two (TSA, VPA, and MS-275) independent experiments is shown. ***p < 0.001; **p < 0.01; *p < 0.05; p > 0.05: ns, not significant versus control cells (Student's t-test).
DC differentiation is impaired by HDAC inhibition
HDAC inhibition antagonised DC lineage commitment (Fig.2A and B) and thus we reasoned that it might also affect DC differentiation. To test this hypothesis, MPP/CDP cultures, amplified under standard conditions, were differentiated into DCs with Flt3L in the presence or absence of TSA, VPA, or MS-275. The effect of HDAC inhibition on histone acetylation was verified by Western blotting. Indeed, H4 acetylation was clearly higher in TSA-treated cells compared with untreated cells (Fig.3A).
Figure 3.

HDAC activity impacts on DC differentiation. MPP/CDP cultures derived from C57BL/6 bone marrow cells were induced to differentiate into DCs with Flt3L in the presence or absence of 3.5 nM TSA, 0.5 mM VPA, or 0.2 μM MS-275. (A) Cells were collected at various time points during differentiation, lysed, and subjected to Western blot analysis to determine H4 acetylation. β-Actin was used as loading control. One representative experiment of three independent experiments is shown. (B) In order to follow DC differentiation kinetics, cells were collected at indicated time points, stained for the DC marker CD11c and analyzed by flow cytometry. Percentages of CD11c+ cells are depicted as mean + SD (n = 9, two independent experiments for Control and n = 3, one experiment for TSA, VPA, and MS-275). (C) Cell proliferation was followed in time by determining total cell numbers with an electronic cell counter device. Cell numbers are depicted as mean + SD (n = 5 to 9, two independent experiments for Control, n = 3, one experiment for TSA, VPA, and MS-275). (D) DC subset development was followed in time by flow cytometry. On days 4, 7, and 9 of differentiation, cells were collected and stained for CD11c, CD11b, and B220. CD11c+ were selected by gating and further analyzed for CD11b and B220 expression. Gates shown indicate cDCs (CD11bhiB220lo) and pDCs (CD11bloB220hi). Detailed gating strategies for cDCs and pDCs are presented in Supporting Information Fig. 3A. One representative experiment of at least three independent experiments is depicted. Untreated cells were used as Control. Asterisk in (A), antibody-specific band; ***p < 0.001; **p < 0.01; *p < 0.05; p > 0.05; ns, not significant versus control (Student's t-test).
Cell growth and kinetics of differentiation were monitored by flow cytometry. As expected, control cells readily upregulated CD11c expression, indicating efficient DC differentiation (Fig.3B). Cells treated with TSA or VPA also upregulated CD11c, but the percentage of CD11c+ cells was clearly reduced compared with untreated cells. After 7 days of differentiation, more than 95% of control cells expressed high levels of CD11c, compared with only 60% of TSA-treated cells and 40% of VPA-treated cells (Fig.3B). This attenuation of differentiation due to HDAC inhibition was accompanied by enhanced proliferation (Fig.3C). At day 7 of differentiation TSA-treated and VPA-treated cells had expanded by 1.5- and 2.5-fold, respectively, compared with untreated cells. Additionally, colony formation assay confirmed the higher proliferative capacity of treated cells (Supporting Information Fig. 2A). Cells treated with MS-275 did not show a significant reduction in CD11c+ cells (Fig.3B) and expanded even less compared with control cells (Fig.3C).
To test reversibility of HDAC inhibition, pulse-chase experiments were performed (Supporting Information Fig. 2B). Interestingly, when TSA was removed after 3 days and cells were further grown in the absence of TSA, the block in differentiation was almost instantly abolished. Four days after TSA removal, total cell number and percentage of CD11c-expressing cells were virtually identical for pulse-treated and untreated cells (Supporting Information Fig. 2C and D).
HDAC activity is a prerequisite for pDC development
We next examined the impact of HDAC inhibition on differentiation into cDCs or pDCs. DC subset development was followed by flow cytometry for CD11b, B220, and SiglecH expression. As shown in Figure3D, from day 7 on control cells had differentiated into cDCs and pDCs. Importantly, pDC development was almost entirely blocked when TSA, VPA, or MS-275 were added as no B220hi cells were detected even after nine days of differentiation (Fig.3D). The same result was obtained when SiglecH was used as pDC-specific marker (Supporting Information Fig. 3B).
To investigate whether the loss of pDC potential was irreversible or not, TSA was removed after 3 days and cells were further cultured with Flt3L only. Pulse-chased cells differentiated into cDCs and pDCs very similar to control cells (Supporting Information Fig. 3C and D). Of note, we also treated cells for 9 days with TSA followed by a chase with culture medium for 4 days. Even these cells retained the capacity to progress into pDCs as a small population of B220hi cells developed (data not shown).
The impact of HDAC activity on DC differentiation and subset specification was further substantiated using freshly isolated bone marrow cells. These cells were cultured with Flt3L without initial amplification and treated with TSA, VPA, or MS-275 or left untreated. Again, we observed that TSA and VPA attenuated DC differentiation as the percentage of CD11c+ cells was reduced compared with untreated cells (Supporting Information Fig. 4A). Proliferation, in contrast, was favored and total cell numbers after 11 days of culture with TSA or VPA were 20-fold and fivefold higher, respectively, compared with control cells (Supporting Information Fig. 4B). Higher proliferative potential upon TSA treatment was confirmed by colony formation assay (Supporting Information Fig. 4C). As shown before, MS-275 did not attenuate DC differentiation or promote cell proliferation. However, MS-275 abrogated pDC differentiation to a similar extent as TSA and VPA (Supporting Information Fig. 4D).
Taken together, HDAC activity is critical for efficient DC differentiation and in particular for pDC development. More specifically, class I HDAC activity is required for pDC development. HDAC inhibitor-treated cells still respond to Flt3L, yet Flt3L does not initiate a robust DC differentiation program when HDAC activity is inhibited. Importantly, the inhibitory effect of TSA was reversible.
HDAC inhibition prevents establishment of a DC-specific gene expression repertoire
To address the question how HDAC inhibition impairs DC differentiation, we analyzed the influence of TSA treatment on expression of DC-associated genes. Therefore, MPP/CDP cultures were differentiated into DCs with Flt3L in the presence or absence of 3.5 nM TSA. To follow gene expression in time, samples were taken after 0, 2, 4, and 7 days and expression of PU.1, IRF8, Flt3, Id2, and Tcf4 was analyzed (Fig.4A). In untreated cells, expression of these genes was already upregulated after 2 days and further increased in time. In TSA-treated cells, however, the upregulation was largely inhibited resulting in a two to fourfold lower expression at day 7 of differentiation compared with untreated cells. TSA also inhibited expression of STAT3, a key component of the Flt3L/Flt3 signaling pathway (Fig.4A). In addition, when TSA was removed after 3 days, gene expression was quickly restored and appeared virtually identical to untreated control cells 4 days later (Supporting Information Fig. 5A). Importantly, expression of stem and progenitor cell related genes, like C/ebpα, Sca-1, c-kit, and Gfi1, was upregulated upon TSA treatment (Supporting Information Fig. 5B). This further supports our conclusion that HDAC inhibition impairs DC development and keeps cells in a more primitive state.
Figure 4.
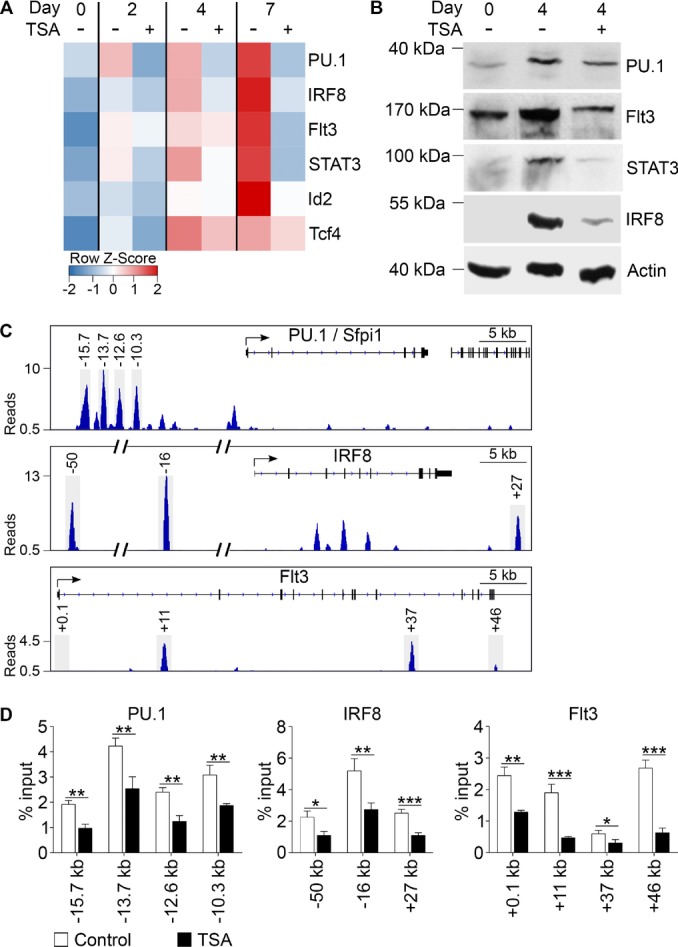
HDAC inhibition affects gene expression and PU.1 binding during DC differentiation. MPP/CDP cultures, obtained from C57BL/6 bone marrow by in vitro culture with Flt3L, hyper-IL-6, IGF-1, and SCF, were induced to differentiate into DCs with Flt3L in the presence or absence of 3.5 nM TSA. (A) RNA was isolated at various time points during differentiation (days 0, 2, 4, and 7) and gene expression was analyzed by RT-qPCR. ΔΔCt values were calculated relative to GAPDH and are presented in heatmap format (blue: expression levels below median; white: expression levels equal to median; red: expression levels above median). Data are mean of three independent experiments. (B) PU.1, Flt3, STAT3, and IRF8 protein levels in untreated and TSA-treated cells were determined by Western blotting on day 0 and 4 of differentiation. β-Actin was used as loading control. A representative Western blot of two independent experiments is shown. (C) Plots represent ChIP-Seq profiles of PU.1 binding at PU.1/Sfpi1, IRF8, and Flt3 locus. PU.1 ChIP-seq data of DCs from mouse bone marrow grown with GM-CSF were obtained from GEO (accession number GSM881099). PU.1 peaks represent number of reads per million reads per base pair. (D) On day 4 of DC differentiation, untreated (Control) and TSA-treated (TSA) cells were cross-linked with 1% formaldehyde and used for ChIP analysis with a PU.1-specific antibody. PU.1 binding at the PU.1, IRF8, and Flt3 loci was quantified by qPCR with primer pairs encompassing PU.1-binding sites determined in (C). These binding sites are located in the PU.1 locus at –15.7, –13.7, –12.6, and –10.3 kb (left bar diagram), the IRF8 locus at –50, –16, and +27 kb (middle bar diagram) and the Flt3 locus at +0.1, +11, +37, and +46 kb (right bar diagram). Locations are relative to transcription start site. PU.1 binding is shown as percentage of input and is mean + SD of three independent ChIP experiments. ***p < 0.001; **p < 0.01; *p < 0.05 versus control (Student's t-test).
We then proceeded to determine PU.1, Flt3, STAT3, and IRF8 protein levels by Western blot analysis. In progenitor cells (day 0), protein levels were low or absent (Fig.4B). Upon DC differentiation (day 4), PU.1, Flt3, STAT3, and IRF8 protein levels were clearly upregulated. Importantly, this upregulation was reduced when TSA was added during differentiation (Fig.4B).
Reduced PU.1 recruitment at PU.1 binding sites in TSA-treated cells
HDAC inhibition lead to elevated levels of histone acetylation (Fig.3A), yet, this hyperacetylation did not result in increased gene expression of key DC genes (Fig.4A). We found before that upregulation of PU.1 expression during DC differentiation was accompanied by a reduction in H3K9ac at the PU.1 promoter (Fig.1A and B). PU.1 has a key role in DC lineage development as it promotes Flt3 and IRF8 expression 7,10. Thus, we hypothesised that lower PU.1 levels, due to TSA-induced hyperacetylation, would result in reduced PU.1 binding to and expression of target genes.
Therefore, we investigated the level of PU.1 binding to regulatory elements in known PU.1 target genes (PU.1/Sfpi1, IRF8, and Flt3). We inspected published PU.1 ChIP-Seq data for PU.1 binding in DCs 30. PU.1 binding was found at different Sfpi1/PU.1 enhancer regions (–15.7, –13.7, –12.6, and –10.3 kb; Fig.4C), in line with the positive autoregulation described for PU.1. These regions are reported PU.1-binding sites in various hematopoietic cells 11,12.
Furthermore, we found prominent PU.1 binding at –50, –16, and +27 kb of the IRF8 locus. The –50 kb region was recently described to be important for efficient IRF8 expression in DCs 10. Finally, low levels of PU.1 binding were observed at the Flt3 locus. The +0.1 and +11 kb sites have been reported as PU.1-binding sites in DCs 7 and additional sites were at +37 and +46 kb.
Next, we determined PU.1 binding at the same regions in TSA-treated and untreated DCs. Cells were cross-linked and ChIP was performed with a PU.1-specific antibody, followed by qPCR. We confirmed PU.1 binding at all selected sites of Sfpi1/PU.1, IRF8, and Flt3 loci (Fig.4D) in untreated control cells. Intriguingly, the amount of PU.1 binding was significantly decreased in TSA-treated cells, compared with control cells (Fig.4D). These results indeed suggest that hyperacetylation of histones, due to inhibition of HDAC activity, affects DC differentiation in a PU.1-mediated manner.
Finally, we determined whether TSA-treated cells acquire alternative developmental options next to DCs. MPP/CDP cultures were differentiated with Flt3L in the presence or absence of 3.5 nM TSA for 3 days. Cells were then adoptively transferred into sublethally irradiated NOD-SCID-IL2rgnull mice. Six days after injection, mice were sacrificed and the differentiated progeny of transferred cells was determined in spleen and bone marrow by flow cytometry. Control cells and TSA-treated cells gave rise to splenic CD11b+ cDCs, CD8α+ cDCs, and pDCs in comparable amounts (Supporting Information Fig. 6B). In total, about 70% of donor cells were DCs (Supporting Information Fig. 6C) and no other myeloid or lymphoid populations were found (data not shown). Thus, HDAC inhibition during in vitro culture slowed down DC differentiation but did not open other and/or new developmental options and cells rather retained DC differentiation potential. Furthermore, these data underscore reversibility of the TSA effect.
Discussion
Epigenetic mechanisms maintain cell identity and function, and guide cell fate decisions during hematopoiesis 15. In this study, we investigated how histone acetylation impacts on DC commitment and subset specification. We observed that blocking HDAC activity inhibited the transition from MPPs to CDPs and thus kept the cells in a more primitive state. Furthermore, we found that HDAC activity was required for efficient DC differentiation and was indispensible for pDC development. Finally, we showed that HDAC activity is a prerequisite for high expression of PU.1 and its target genes, such as Flt3 and IRF8. We propose a model where HDAC activity is important for establishing a DC gene network with Flt3 signaling driving PU.1 and IRF8 expression and thus DC differentiation (Fig.5).
Figure 5.
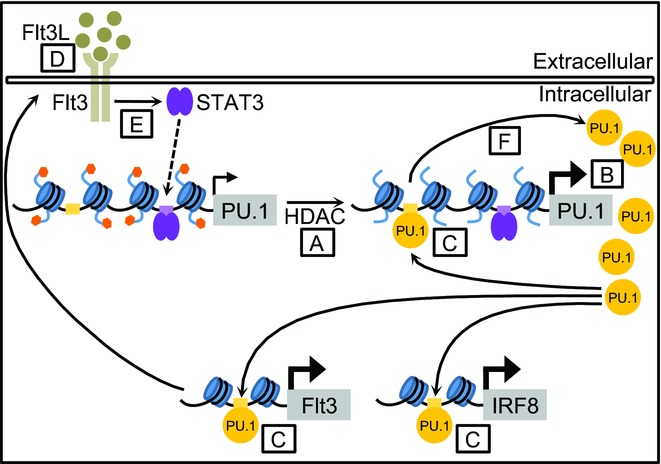
HDAC activity and signaling mechanisms in DC development. Model of HDAC activity in Flt3L-driven DC development. HDACs deacetylate the PU.1/Sfpi1 locus (A), which results in elevated PU.1 levels (B). This leads to increased PU.1 binding to regulatory elements in its target genes IRF8, Flt3, and PU.1 itself (C), which induces their expression. Upregulated Flt3 expression increases the cell's responsiveness to Flt3L (D). Increased Flt3L/Flt3/STAT3 signaling (E) upregulates PU.1 expression, thereby establishing a positive feedback loop (F).
Histone modifications impact on chromatin architecture and gene expression 15. Acetylation of histones, for example, converts chromatin into a more relaxed and open state, which is accessible for transcription factors and the transcriptional machinery to induce gene expression. We indeed observed that during DC differentiation the upregulation of DC-affiliated genes was accompanied by an increase in H3K9ac of these genes. Surprisingly, HDAC inhibition, which causes an increase of overall histone acetylation, did not induce the expression of these DC-associated genes but rather suppressed their expression. This seemingly contradicts the prevailing view that histone acetylation activates gene expression.
Several studies, however, reported that a large proportion of genes is downregulated in response to HDAC inhibition, for example in neurosphere cells and human cord blood cells 20,24. Many of these downregulated genes are associated with differentiation, whereas upregulated genes include stemness-related genes. This indicates that in specific cell types HDAC inhibitors promote a more primitive state. In committed hematopoietic progenitor cells, for example, HDAC inhibition induces expression of the stem cell marker Sca-1 31. Also in our DC progenitors we found that HDAC inhibitors induce expression of stem cell related genes. Furthermore, HDAC3 deficiency in mice results in accumulation of immature MPPs at the expense of more differentiated progenitors 25. HSCs and MPPs exhibit the potential to develop into all hematopoietic lineages through coexpression of specific master regulators, which, however, are expressed at low levels. Given their broad potential, immature cells are characterized by an open chromatin 32. Upon differentiation and lineage specification, HDACs cause lineage-inappropriate genes to be switched off by inducing a more compact chromatin configuration and resulting in a restricted gene expression repertoire. HDAC inhibition seems to counteract this transition and therefore cells are maintained in a more primitive state.
HDACs are positioned at inactive genes, but also at active genes, and HDAC occupancy correlates with histone acetylation and mRNA levels 19. Furthermore, HDACs are part of large protein complexes, which are directed to specific genes via interaction with sequence-specific transcription factors. These multisubunit complexes often contain other chromatin modifiers and can induce an increase or decrease in chromatin accessibility 33,34. Therefore, the chromatin status might be gene or cell type-specific and the level of histone acetylation might not necessarily reflect the level of gene expression. We found, for example, that in DCs, acetylation of the PU.1 promoter was low even though the PU.1 expression was high.
PU.1 is required for development of all hematopoietic lineages, however, PU.1 expression levels vary between different cell types 2,5. HSCs and MPPs, for example, require low levels of PU.1 and PU.1 expression in these cells is negatively regulated by other transcription factors, such as Gata factors 35. We found that HDAC inhibition reduced PU.1 expression, an observation also made in macrophages 36. We hypothesize that HDAC inhibition renders the PU.1 locus more accessible to transcriptional repressors, which keep PU.1 expression low. Yet, efficient DC development requires an increase in PU.1. This might be accomplished by decreasing acetylation of the PU.1 locus and thus loss of repressor binding. Alternatively, HDAC inhibition might directly affect transcriptional activators. STAT3, for example, induces PU.1 expression 37 and is an HDAC target 38. In lymphoma cells, acetylated STAT3 accumulates in the cytoplasm and is therefore unable to activate target genes. We did not detect acetylated STAT3 in our HDAC inhibitor-treated cells (data not shown), however, HDAC inhibition might affect STAT3 activity by different mechanisms. HDAC inhibition might repress also other activating factors, which then results in reduced PU.1 expression.
Flt3 is expressed by DC precursors and all steady-state DCs. Accordingly, Flt3/STAT3 signalling is of critical importance for development of DC precursors and their progeny 8,9. Carotta et al. showed that Flt3 expression is regulated by PU.1, via direct binding to Flt3 regulatory elements 7. Haploinsufficiency of PU.1 inhibits Flt3 expression and impairs DC development. Our data are in line with these observations. TSA-treated cells express significantly less PU.1, which results in decreased PU.1 binding to Flt3 gene and in reduced Flt3 expression. Yet, whereas reduced PU.1 levels affect mainly cDCs 7, HDAC inhibition affected both cDCs and pDCs and, as demonstrated here, was particularly prominent for pDCs. This impaired development of both cDCs and pDCs is in line with the phenotype of Flt3L- and STAT3-deficient mice 8,9. PU.1 is expressed at higher levels in cDCs compared with pDCs (7 and Fig.1A) and this might explain why PU.1 haploinsufficiency mostly affects cDCs 7. Flt3, however, is expressed at similar levels by cDCs and pDCs 8 and Flt3L injection into mice expands both DC populations to similar extent 39. Thus, HDAC inhibition, as observed here, appears to cause a similar phenotype as Flt3 deficiency.
The importance of HDAC activity for Flt3 expression is further substantiated by a recent report of Summers et al. 25. In this study transition of Flt3− LSK cells (MPPs) to Flt3+ LSK cells (LMPPs) is blocked in mice with a hematopoietic cell-specific deletion of HDAC3. Interestingly, these mice lack lymphopoiesis, which critically depends on Flt3L/Flt3 signaling 40,41. Given our observations, it is tempting to speculate that in HDAC3−/− mice also the DC compartment, which requires Flt3L/Flt3 signaling, is affected.
Finally, HDAC inhibition also impaired STAT3 expression. STAT3 is an autoregulatory factor 42, thus lower STAT3 levels could be the consequence of decreased Flt3/STAT3 signaling. This would be in agreement with Flt3 overexpression in Flt3− MEP causing upregulation of STAT3 and PU.1 expression and inducing a DC program 43. Furthermore, PU.1 has been identified as a STAT3 target gene 37. Thus, upregulation of the master regulator PU.1 induces expression of core DC genes, such as Flt3, IRF8, and PU.1 itself (Fig.5). The subsequent increase in Flt3/STAT3 signaling in turn upregulates PU.1, thereby reinforcing expression of the core DC genes. Establishment of this self-sustaining gene network drives efficient DC development (Fig.5). We propose that chromatin modifiers, such as HDACs, by regulating the epigenetic profile and gene expression pattern, impact on DC commitment and differentiation.
Materials and methods
Mice
C57BL/6 and NOD-SCID-IL2rgnull mice were maintained under specific pathogen-free conditions at the central animal facility of RWTH Aachen University Hospital, Aachen, Germany. Animal experiments were approved by local authorities (Landesamt für Natur, Umwelt und Verbraucherschutz Nordrhein-Westfalen – LANUV NRW) in compliance with the German animal protection law (Reference number 87–51–04.2010.A040).
Cell culture
Bone marrow cells from C57BL/6 mice were amplified in vitro as described previously 28 to generate MPPs and CDPs. Briefly, cells were amplified for up to 8 days in the presence of Flt3L (25 ng/mL; PeproTech), IL-6/soluble IL-6R fusion protein (hyper-IL-6, 25 ng/mL) 44, long-range insulin-like growth factor-1 (IGF-1, 40 ng/mL; Sigma-Aldrich), and stem cell factor (SCF, 30 U/mL; PeproTech). MPP/CDP cultures were treated for 48 h with 1.5–50 nM TSA, 0.5–10 mM VPA (both Sigma-Aldrich) or 0.5–4 μM MS-275 (Selleckchem), starting at day 6 of proliferation.
To obtain steady-state DCs, amplified MPPs/CDPs were further cultured in the presence of 50 ng/mL Flt3L only. TSA, VPA, and MS-275 were added at a concentration of 3.5 nM, 0.5 mM, and 0.2 μM, respectively, and refreshed every third day by partial medium change. Alternatively, DCs were differentiated from bone marrow cells with Flt3L without initial amplification 45.
Cell counting and live-dead analysis were performed with an electronic cell counter device (Casy1, Schärfe Systems) or by flow cytometry with Zombie Aqua (BioLegend).
Flow cytometry and cell sorting
Flow cytometry analysis and cell sorting of MPPs, CDPs, cDCs, and pDCs was performed as described previously 28. Amplified progenitor cells were deprived of Flt3L for 1.5–2 h and stained for Flt3, c-kit, and Gr1. MPPs and CDPs were defined as Gr1−Flt3−/loc-kithi and Gr1−Flt3+c-kitint, respectively. Gating strategy for MPPs and CDPs is shown in Supporting Information Figure 1C. DCs were stained for CD11c, CD11b, and B220. cDCs were identified as CD11c+CD11bhiB220lo whereas pDCs were defined as CD11c+CD11bloB220hi. Gating strategy for cDCs and pDCs is shown in Supporting Information Fig. 3A. Flow cytometry and cell sorting were performed on a FACSCanto II and FACSAria I device, respectively (BD Biosciences). Sorted cells were either directly cross-linked for ChIP or lysed for RNA isolation. The following antibodies were used: Flt3 (CD135, A2F10), c-kit (CD117, ACK2), CD11c (N418), CD11b (M1/70), B220 (RA3–6B2), SiglecH (eBio440c) (all from eBioscience), and Gr1 (RB6–8C5) (BD Biosciences).
RNA isolation and reverse transcription-quantitative PCR
RNA isolation and cDNA synthesis was performed as described previously 28. Five or 25 ng cDNA were used as template for qPCR with SYBR-green fluorescence (Fast SYBR Green Master Mix, Applied Biosystems). qPCR was performed with a StepOnePlus™ Real Time PCR System and data were analyzed with StepOne™ Software v2.1 (both Applied Biosystems) using GAPDH for normalization. Relative expression values were subjected to hierarchical cluster analysis using R software 46. MacVector software package (MacVector Inc., Cary, NC, USA) was used for primer design. Alternatively, published primers were used as indicated. Primer sequences for gene expression analysis are listed in Supporting Information Table 1.
ChIP-Seq data analysis
Raw reads from PU.1 ChIP-Seq data on GM-CSF-derived DCs were downloaded from GEO under accession number GSM881099. The reads were aligned to genome mm9 using BOWTIE 47. Read length was extended to a size of 200 bp and coverage profiles over the genome were created using IGV tools 48.
Chromatin immunoprecipitation
ChIP assays were performed as described previously with minor modifications 49. Briefly, cells were cross-linked at a concentration of 2 × 10⁶ cells/mL with 1% formaldehyde for 6 min at RT. Cross-linking was stopped with 0.125 M glycine. Chromatin sonication was performed with a Diagenode Bioruptor Standard with cooling device at 4°C for 10 min with 30 s pulse/pause cycles or with a Covaris M220 Focused-ultrasonicator device for 3 min. Ten microliters Dynabeads Protein A (10002D; Life Technologies) were incubated with either 2 μg rabbit anti-H3K9ac antibody (pAb-004–050; Diagenode), 2 μg rabbit anti-PU.1 antibody (T-21, sc-352; Santa Cruz), or 1 μg rabbit IgG (sc-2027; Santa Cruz) at 4°C and 40 rpm. Sheared chromatin from 0.5 – 1 × 10⁶ cells was added to the preincubated beads and incubated at 4°C and 40 rpm overnight. Bound chromatin complexes were magnetically selected (Dynal) and washed with RIPA and TE buffer. DNA was purified using NucleoSpin Gel and PCR Clean-up kit (Macherey & Nagel) or QIAquick PCR purification kit (Qiagen) according to the provided protocol and used for qPCR. Enrichment was calculated as percentage of input. MacVector software package (MacVector Inc., Cary, NC, USA) was used for primer design. Alternatively, published primers were used as indicated. Primer sequences are provided in Supporting Information Table 2 and 3.
SDS-PAGE and Western blotting
Cells were lysed in RIPA buffer and subjected to SDS-PAGE and Western blotting as described before 29. Protein equivalent to 1 × 10⁶ cells was loaded per lane, separated, and transferred to nitrocellulose membranes (0.45 μm, Thermo Scientific). The following primary antibodies were used: polyclonal rabbit anti-PU.1 (T-21, 1:500), polyclonal goat anti-IRF8 (C-19, 1:500), polyclonal rabbit anti-Flt3 (M-20, 1:500; all Santa Cruz), monoclonal mouse anti-STAT3 (84/Stat3, 1:1000; BD Transduction Laboratories), polyclonal rabbit anti-acetyl histone H4 (1:2000; Millipore), and monoclonal mouse anti-β-actin (AC-74, 1:8000; Sigma-Aldrich). Secondary antibodies were peroxidase conjugated rabbit anti-goat (affinity purified, 1:5000; Jackson), sheep anti-mouse and donkey anti-rabbit (both 1:5000; GE Healthcare). For detection, membranes were incubated with ECL reagent (SuperSignal West Pico) and exposed to X-ray film (CL-XPosure Film, both from Thermo Scientific).
Statistics
Statistical significance of experimental results was analyzed by Student's t-test using GraphPad Prism software version 5.0a (GraphPadsoftware, La Jolla, CA, USA). p-values below 0.001 were considered as extremely significant (***), between 0.001 and 0.01 as very significant (**), between 0.01 and 0.05 as significant (*) and higher than 0.05 as not significant (ns). Experimental data are expressed as means + SD.
Acknowledgments
We thank Qiong Lin and Ivan G. Costa for heatmap generation and ChIP-Seq data processing. We also want to thank Andrea Offergeld and Renate Sous for expert secretarial assistance. This research project is supported by the START-Program (AZ 22/13) of the Faculty of Medicine, RWTH Aachen University, Aachen, Germany to K.S. and in part by the donation of U. Lehmann and funds of the Deutsche Forschungsgemeinschaft (DFG, ZE432/5-2) to M.Z.
Glossary
Abbreviations
- cDC
classical DC
- CDP
common dendritic cell progenitor
- Flt3
Fms-like tyrosine kinase 3
- HAT
histone acetyltransferase
- HDAC
histone deacetylase
- IRF8
interferon regulatory factor 8
- MPP
multipotent progenitor
- pDC
plasmacytoid DC
- TSA
Trichostatin A
- VPA
valproic acid
Conflict of interest
The authors declare no financial or commercial conflict of interest.
Supporting Information
As a service to our authors and readers, this journal provides supporting information supplied by the authors. Such materials are peer reviewed and may be re-organized for online delivery, but are not copy-edited or typeset. Technical support issues arising from supporting information (other than missing files) should be addressed to the authors.
Figure S1 HDAC expression during DC lineage commitment and differentiation and influence of HDAC inhibitors on cell survival and proliferation.
Figure S2 HDAC inhibition restrains DC differentiation.
Figure S3 TSA reversibly inhibits DC differentiation.
Figure S4 pDC development is blocked upon inhibition of HDAC activity.
Figure S5 Impact of HDAC inhibition on gene expression.
Figure S6 TSA-treated cells give rise to DCs but no other lineages in vivo.
Table S1 Primer sequences for RT-qPCR.
Table S2 Primer sequences for ChIP-qPCR with an H3K9ac-specific antibody.
Table S3 Primer sequences for ChIP-qPCR with a PU.1-specific antibody.
References
- Merad M, Sathe P, Helft J, Miller J, Mortha A. The dendritic cell lineage: ontogeny and function of dendritic cells and their subsets in the steady state and the inflamed setting. Annu. Rev. Immunol. 2013;31:563–604. doi: 10.1146/annurev-immunol-020711-074950. [DOI] [PMC free article] [PubMed] [Google Scholar]
- Belz GT, Nutt SL. Transcriptional programming of the dendritic cell network. Nat. Rev. Immunol. 2012;12:101–113. doi: 10.1038/nri3149. [DOI] [PubMed] [Google Scholar]
- Geissmann F, Manz MG, Jung S, Sieweke MH, Merad M, Ley K. Development of monocytes, macrophages, and dendritic cells. Science. 2010;327:656–661. doi: 10.1126/science.1178331. [DOI] [PMC free article] [PubMed] [Google Scholar]
- Liu K, Victora GD, Schwickert TA, Guermonprez P, Meredith MM, Yao K, Chu FF, et al. In vivo analysis of dendritic cell development and homeostasis. Science. 2009;324:392–397. doi: 10.1126/science.1170540. [DOI] [PMC free article] [PubMed] [Google Scholar]
- Nutt SL, Metcalf D, D'Amico A, Polli M, Wu L. Dynamic regulation of PU.1 expression in multipotent hematopoietic progenitors. J. Exp. Med. 2005;201:221–231. doi: 10.1084/jem.20041535. [DOI] [PMC free article] [PubMed] [Google Scholar]
- Heinz S, Benner C, Spann N, Bertolino E, Lin YC, Laslo P, Cheng JX, et al. Simple combinations of lineage-determining transcription factors prime cis-regulatory elements required for macrophage and B cell identities. Mol. Cell. 2010;38:576–589. doi: 10.1016/j.molcel.2010.05.004. [DOI] [PMC free article] [PubMed] [Google Scholar]
- Carotta S, Dakic A, D'Amico A, Pang SH, Greig KT, Nutt SL, Wu L. The transcription factor PU.1 controls dendritic cell development and Flt3 cytokine receptor expression in a dose-dependent manner. Immunity. 2010;32:628–641. doi: 10.1016/j.immuni.2010.05.005. [DOI] [PubMed] [Google Scholar]
- Kingston D, Schmid MA, Onai N, Obata-Onai A, Baumjohann D, Manz MG. The concerted action of GMCSF and Flt3-ligand on in vivo dendritic cell homeostasis. Blood. 2009;114:835–843. doi: 10.1182/blood-2009-02-206318. [DOI] [PubMed] [Google Scholar]
- Laouar Y, Welte T, Fu XY, Flavell RA. STAT3 is required for Flt3L-dependent dendritic cell differentiation. Immunity. 2003;19:903–912. doi: 10.1016/s1074-7613(03)00332-7. [DOI] [PubMed] [Google Scholar]
- Schönheit J, Kuhl C, Gebhardt ML, Klett FF, Riemke P, Scheller M, Huang G, et al. PU.1 level-directed chromatin structure remodeling at the Irf8 gene drives dendritic cell commitment. Cell Rep. 2013;3:1617–1628. doi: 10.1016/j.celrep.2013.04.007. [DOI] [PubMed] [Google Scholar]
- Rosenbauer F, Owens BM, Yu L, Tumang JR, Steidl U, Kutok JL, Clayton LK, et al. Lymphoid cell growth and transformation are suppressed by a key regulatory element of the gene encoding PU.1. Nat. Genet. 2006;38:27–37. doi: 10.1038/ng1679. [DOI] [PubMed] [Google Scholar]
- Leddin M, Perrod C, Hoogenkamp M, Ghani S, Assi S, Heinz S, Wilson NK, et al. Two distinct auto-regulatory loops operate at the PU.1 locus in B cells and myeloid cells. Blood. 2011;117:2827–2838. doi: 10.1182/blood-2010-08-302976. [DOI] [PMC free article] [PubMed] [Google Scholar]
- Hacker C, Kirsch RD, Ju XS, Hieronymus T, Gust TC, Kuhl C, Jorgas T, et al. Transcriptional profiling identifies Id2 function in dendritic cell development. Nat. Immunol. 2003;4:380–386. doi: 10.1038/ni903. [DOI] [PubMed] [Google Scholar]
- Satpathy AT, Wu X, Albring JC, Murphy KM. Re(de)fining the dendritic cell lineage. Nat. Immunol. 2012;13:1145–1154. doi: 10.1038/ni.2467. [DOI] [PMC free article] [PubMed] [Google Scholar]
- Cedar H, Bergman Y. Epigenetics of haematopoietic cell development. Nat. Rev. Immunol. 2011;11:478–488. doi: 10.1038/nri2991. [DOI] [PubMed] [Google Scholar]
- Clayton AL, Hazzalin CA, Mahadevan LC. Enhanced histone acetylation and transcription: a dynamic perspective. Mol. Cell. 2006;23:289–296. doi: 10.1016/j.molcel.2006.06.017. [DOI] [PubMed] [Google Scholar]
- Suliman BA, Xu D, Williams BR. HDACi: molecular mechanisms and therapeutic implications in the innate immune system. Immunol. Cell Biol. 2012;90:23–32. doi: 10.1038/icb.2011.92. [DOI] [PubMed] [Google Scholar]
- Hassig CA, Schreiber SL. Nuclear histone acetylases and deacetylases and transcriptional regulation: HATs off to HDACs. Curr. Opin. Chem. Biol. 1997;1:300–308. doi: 10.1016/s1367-5931(97)80066-x. [DOI] [PubMed] [Google Scholar]
- Wang Z, Zang C, Cui K, Schones DE, Barski A, Peng W, Zhao K. Genome-wide mapping of HATs and HDACs reveals distinct functions in active and inactive genes. Cell. 2009;138:1019–1031. doi: 10.1016/j.cell.2009.06.049. [DOI] [PMC free article] [PubMed] [Google Scholar]
- Ruau D, Ensenat-Waser R, Dinger TC, Vallabhapurapu DS, Rolletschek A, Hacker C, Hieronymus T, et al. Pluripotency associated genes are reactivated by chromatin-modifying agents in neurosphere cells. Stem. Cells. 2008;26:920–926. doi: 10.1634/stemcells.2007-0649. [DOI] [PubMed] [Google Scholar]
- Frikeche J, Peric Z, Brissot E, Gregoire M, Gaugler B, Mohty M. Impact of HDAC inhibitors on dendritic cell functions. Exp. Hematol. 2012;40:783–791. doi: 10.1016/j.exphem.2012.06.008. [DOI] [PubMed] [Google Scholar]
- Sweet MJ, Shakespear MR, Kamal NA, Fairlie DP. HDAC inhibitors: modulating leukocyte differentiation, survival, proliferation and inflammation. Immunol. Cell Biol. 2012;90:14–22. doi: 10.1038/icb.2011.88. [DOI] [PubMed] [Google Scholar]
- Chung YS, Kim HJ, Kim TM, Hong SH, Kwon KR, An S, Park JH, et al. Undifferentiated hematopoietic cells are characterized by a genome-wide undermethylation dip around the transcription start site and a hierarchical epigenetic plasticity. Blood. 2009;114:4968–4978. doi: 10.1182/blood-2009-01-197780. [DOI] [PubMed] [Google Scholar]
- Walasek MA, Bystrykh L, van den Boom V, Olthof S, Ausema A, Ritsema M, Huls G, et al. The combination of valproic acid and lithium delays hematopoietic stem/progenitor cell differentiation. Blood. 2012;119:3050–3059. doi: 10.1182/blood-2011-08-375386. [DOI] [PubMed] [Google Scholar]
- Summers AR, Fischer MA, Stengel KR, Zhao Y, Kaiser JF, Wells CE, Hunt A, et al. HDAC3 is essential for DNA replication in hematopoietic progenitor cells. J. Clin. Invest. 2013;123:3112–3123. doi: 10.1172/JCI60806. [DOI] [PMC free article] [PubMed] [Google Scholar]
- Singh N, Thangaraju M, Prasad PD, Martin PM, Lambert NA, Boettger T, Offermanns S, et al. Blockade of dendritic cell development by bacterial fermentation products butyrate and propionate through a transporter (Slc5a8)-dependent inhibition of histone deacetylases. J. Biol. Chem. 2010;285:27601–27608. doi: 10.1074/jbc.M110.102947. [DOI] [PMC free article] [PubMed] [Google Scholar]
- Sebastian C, Serra M, Yeramian A, Serrat N, Lloberas J, Celada A. Deacetylase activity is required for STAT5-dependent GMCSF functional activity in macrophages and differentiation to dendritic cells. J. Immunol. 2008;180:5898–5906. doi: 10.4049/jimmunol.180.9.5898. [DOI] [PubMed] [Google Scholar]
- Felker P, Seré K, Lin Q, Becker C, Hristov M, Hieronymus T, Zenke M. TGF-beta1 accelerates dendritic cell differentiation from common dendritic cell progenitors and directs subset specification toward conventional dendritic cells. J. Immunol. 2010;185:5326–5335. doi: 10.4049/jimmunol.0903950. [DOI] [PubMed] [Google Scholar]
- Seré KM, Lin Q, Felker P, Rehage N, Klisch T, Ortseifer I, Hieronymus T, et al. Dendritic cell lineage commitment is instructed by distinct cytokine signals. Eur. J. Cell Biol. 2012;91:515–523. doi: 10.1016/j.ejcb.2011.09.007. [DOI] [PubMed] [Google Scholar]
- Garber M, Yosef N, Goren A, Raychowdhury R, Thielke A, Guttman M, Robinson J, et al. A high-throughput chromatin immunoprecipitation approach reveals principles of dynamic gene regulation in mammals. Mol. Cell. 2012;47:810–822. doi: 10.1016/j.molcel.2012.07.030. [DOI] [PMC free article] [PubMed] [Google Scholar]
- Walasek MA, Bystrykh LV, Olthof S, de Haan G, van Os R. Sca-1 is an early-response target of histone deacetylase inhibitors and marks hematopoietic cells with enhanced function. Exp. Hematol. 2013;41:113–123. doi: 10.1016/j.exphem.2012.09.004. e112. [DOI] [PubMed] [Google Scholar]
- Orkin SH, Zon LI. Hematopoiesis: an evolving paradigm for stem cell biology. Cell. 2008;132:631–644. doi: 10.1016/j.cell.2008.01.025. [DOI] [PMC free article] [PubMed] [Google Scholar]
- Zhang J, Jackson AF, Naito T, Dose M, Seavitt J, Liu F, Heller EJ, et al. Harnessing of the nucleosome-remodeling-deacetylase complex controls lymphocyte development and prevents leukemogenesis. Nat. Immunol. 2011;13:86–94. doi: 10.1038/ni.2150. [DOI] [PMC free article] [PubMed] [Google Scholar]
- Yang XJ, Seto E. The Rpd3/Hda1 family of lysine deacetylases: from bacteria and yeast to mice and men. Nat. Rev. Mol. Cell Biol. 2008;9:206–218. doi: 10.1038/nrm2346. [DOI] [PMC free article] [PubMed] [Google Scholar]
- Chou ST, Khandros E, Bailey LC, Nichols KE, Vakoc CR, Yao Y, Huang Z, et al. Graded repression of PU.1/Sfpi1 gene transcription by GATA factors regulates hematopoietic cell fate. Blood. 2009;114:983–994. doi: 10.1182/blood-2009-03-207944. [DOI] [PMC free article] [PubMed] [Google Scholar]
- Laribee RN, Klemsz MJ. Loss of PU.1 expression following inhibition of histone deacetylases. J. Immunol. 2001;167:5160–5166. doi: 10.4049/jimmunol.167.9.5160. [DOI] [PubMed] [Google Scholar]
- Hegde S, Ni S, He S, Yoon D, Feng GS, Watowich SS, Paulson RF, et al. Stat3 promotes the development of erythroleukemia by inducing Pu.1 expression and inhibiting erythroid differentiation. Oncogene. 2009;28:3349–3359. doi: 10.1038/onc.2009.202. [DOI] [PMC free article] [PubMed] [Google Scholar]
- Gupta M, Han JJ, Stenson M, Wellik L, Witzig TE. Regulation of STAT3 by histone deacetylase-3 in diffuse large B-cell lymphoma: implications for therapy. Leukemia. 2012;26:1356–1364. doi: 10.1038/leu.2011.340. [DOI] [PMC free article] [PubMed] [Google Scholar]
- Karsunky H, Merad M, Cozzio A, Weissman IL, Manz MG. Flt3 ligand regulates dendritic cell development from Flt3+ lymphoid and myeloid-committed progenitors to Flt3+ dendritic cells in vivo. J. Exp. Med. 2003;198:305–313. doi: 10.1084/jem.20030323. [DOI] [PMC free article] [PubMed] [Google Scholar]
- Mackarehtschian K, Hardin JD, Moore KA, Boast S, Goff SP, Lemischka IR. Targeted disruption of the flk2/flt3 gene leads to deficiencies in primitive hematopoietic progenitors. Immunity. 1995;3:147–161. doi: 10.1016/1074-7613(95)90167-1. [DOI] [PubMed] [Google Scholar]
- McKenna HJ, Stocking KL, Miller RE, Brasel K, De Smedt T, Maraskovsky E, Maliszewski CR, et al. Mice lacking flt3 ligand have deficient hematopoiesis affecting hematopoietic progenitor cells, dendritic cells, and natural killer cells. Blood. 2000;95:3489–3497. [PubMed] [Google Scholar]
- Ichiba M, Nakajima K, Yamanaka Y, Kiuchi N, Hirano T. Autoregulation of the Stat3 gene through cooperation with a cAMP-responsive element-binding protein. J. Biol. Chem. 1998;273:6132–6138. doi: 10.1074/jbc.273.11.6132. [DOI] [PubMed] [Google Scholar]
- Onai N, Obata-Onai A, Tussiwand R, Lanzavecchia A, Manz MG. Activation of the Flt3 signal transduction cascade rescues and enhances type I interferon-producing and dendritic cell development. J. Exp. Med. 2006;203:227–238. doi: 10.1084/jem.20051645. [DOI] [PMC free article] [PubMed] [Google Scholar]
- Fischer M, Goldschmitt J, Peschel C, Brakenhoff JP, Kallen KJ, Wollmer A, Grotzinger J, et al. I. A bioactive designer cytokine for human hematopoietic progenitor cell expansion. Nat. Biotechnol. 1997;15:142–145. doi: 10.1038/nbt0297-142. [DOI] [PubMed] [Google Scholar]
- Naik SH, Proietto AI, Wilson NS, Dakic A, Schnorrer P, Fuchsberger M, Lahoud MH, et al. Cutting edge: generation of splenic CD8+ and CD8– dendritic cell equivalents in Fms-like tyrosine kinase 3 ligand bone marrow cultures. J. Immunol. 2005;174:6592–6597. doi: 10.4049/jimmunol.174.11.6592. [DOI] [PubMed] [Google Scholar]
- R Development Core Team. R: A language and environment for statistical computing. R foundation for statistical computing, Vienna, Austria 2012.
- Langmead B, Trapnell C, Pop M, Salzberg SL. Ultrafast and memory-efficient alignment of short DNA sequences to the human genome. Genome Biol. 2009;10:R25. doi: 10.1186/gb-2009-10-3-r25. [DOI] [PMC free article] [PubMed] [Google Scholar]
- Thorvaldsdottir H, Robinson JT, Mesirov JP. Integrative genomics viewer (IGV): high-performance genomics data visualization and exploration. Brief Bioinform. 2012;14:178–192. doi: 10.1093/bib/bbs017. [DOI] [PMC free article] [PubMed] [Google Scholar]
- Dahl JA, Collas P. A rapid micro chromatin immunoprecipitation assay (microChIP. Nat. Protoc. 2008;3:1032–1045. doi: 10.1038/nprot.2008.68. [DOI] [PubMed] [Google Scholar]
Associated Data
This section collects any data citations, data availability statements, or supplementary materials included in this article.
Supplementary Materials
Figure S1 HDAC expression during DC lineage commitment and differentiation and influence of HDAC inhibitors on cell survival and proliferation.
Figure S2 HDAC inhibition restrains DC differentiation.
Figure S3 TSA reversibly inhibits DC differentiation.
Figure S4 pDC development is blocked upon inhibition of HDAC activity.
Figure S5 Impact of HDAC inhibition on gene expression.
Figure S6 TSA-treated cells give rise to DCs but no other lineages in vivo.
Table S1 Primer sequences for RT-qPCR.
Table S2 Primer sequences for ChIP-qPCR with an H3K9ac-specific antibody.
Table S3 Primer sequences for ChIP-qPCR with a PU.1-specific antibody.