Abstract
The human DF3/MUC1 mucin-like glycoprotein is aberrantly overexpressed by most carcinomas of the breast and other epithelia. The contribution of MUC1 overexpression to the malignant phenotype is, however, not known. In the present studies, we have stably expressed MUC1 in rat 3Y1 fibroblasts. MUC1-positive cells were selected from independent transfections. The results demonstrate that, as found in human carcinomas, MUC1 is expressed on the cell surface and as a complex with α-catenin in the nucleus of the transfectants. Colony formation in soft agar demonstrates that cells expressing MUC1, but not the empty vector, exhibit anchorageindependent growth. The results also show that MUC1 expression confers tumor formation in nude mice. These findings provide the first evidence that MUC1 induces cellular transformation.
Keywords: DF3/MUC1, 3Y1 cells, anchorage-independent growth, cellular transformation
Introduction
The human DF3/MUC1 mucin-like transmembrane protein is normally expressed on the apical borders of secretory epithelial cells (Kufe et al., 1984). Transformation of the epithelium is, by contrast, associated with expression of MUC1 at high levels over the entire carcinoma cell surface (Kufe et al., 1984). The MUC1 protein is translated as a single polypeptide, which is cleaved into N- and C-terminal subunits (Ligtenberg et al., 1992). The >250 kDa N-terminal ectodomain consists of variable numbers of 20 amino-acid tandem repeats that are extensively modified by O-glycosylation (Gendler et al., 1988; Siddiqui et al., 1988). Formation of a heterodimer with the C-terminal subunit (C-ter) anchors the N-terminal ectodomain to the cell surface. The ~25 kDa MUC1 C-ter includes a 58 amino-acid extracellular region, a transmembrane domain and a 72 amino-acid cytoplasmic domain (CD). The β-catenin signaling protein binds directly to MUC1-CD at a serine-rich motif (Yamamoto et al., 1997). Phosphorylation of MUC1-CD by glycogen synthase kinase 3β downregulates the interaction between MUC1-CD and β-catenin (Li et al., 1998). Conversely, phosphorylation of MUC1-CD by c-Src or protein kinase Cδ increases the formation of MUC1-β-catenin complexes (Li et al., 2001a; Ren et al., 2002). Other studies have shown that phosphorylation of MUC1-CD by the epidermal growth factor receptor regulates the interaction of MUC1 with c-Src and β-catenin (Li et al., 2001b). These findings have indicated that MUC1 functions in integrating the growth factor receptor and Wnt signaling pathways.
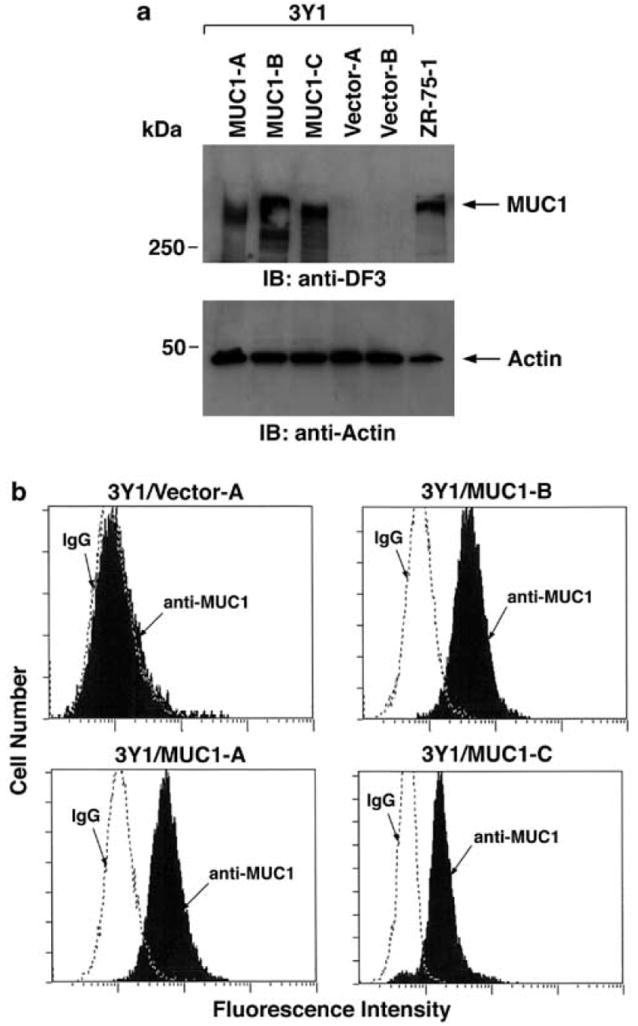
To assess the effects of expressing MUC1, rat 3Y1 fibroblasts were transfected with the empty vector pIRESpuro2 or the expression vector encoding MUC1 (Li et al., 2001b). The 3Y1 cells were used rather than the NIH3T3 cell line because of the spontaneous transformation that occurs with NIH3T3 cells (Bromberg et al., 1999). Stable transfectants were selected in the presence of puromycin and analysed for MUC1 expression by immunoblotting with the DF3 anti-MUC1 antibody that recognizes the N-terminal subunit (Kufe et al., 1984). The results show the detection of MUC1 in lysates of 3Y1 cells selected from three independent transfections (Figure 1a). The level of MUC1 expression was comparable to that in human ZR-75-1 breast cancer cells (Figure 1a). By contrast, there was no detectable MUC1 expression in cells transfected with the empty vector (Figure 1a). MUC1 is expressed on the surface of human breast cancer cells (Kufe et al., 1984). To determine whether the 3Y1 cells similarly express MUC1 on the cell surface, flow cytometry was performed with the DF3 antibody. The results demonstrate that, like breast carcinoma cells, MUC1 is expressed on the surface of the 3Y1 cell transfectants (Figure 1b). These findings indicate that the level and distribution of the MUC1 in the 3Y1 cells is comparable to that in carcinoma cells that endogenously express the glycoprotein.
Figure 1.

Cell surface expression of MUC1 in 3Y1 cell transfectants. (a) Lysates from 3Y1/MUC1-A, 3Y1/MUC1-B, 3Y1/MUC1-C, 3Y1/Vector-A and 3Y1/Vector-B cells were subjected to immunoblotting (IB) with anti-MUC1 (MAb DF3) (upper panel) and anti-actin (lower panel) antibodies. ZR-75-1 cell lysate was used as positive control. (b) The indicated cells were incubated with anti-MUC1 (solid bars) or a control mouse IgG (open panels) and analysed by flow cytometry
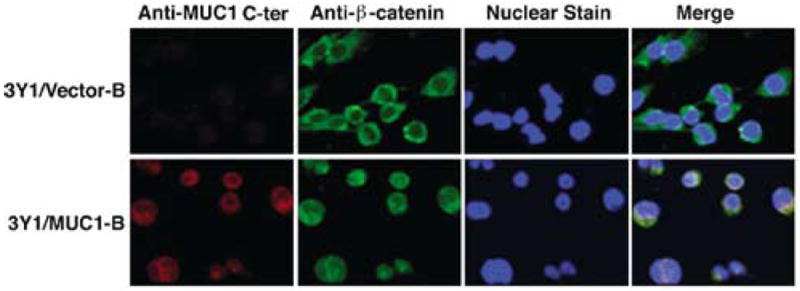
The MUC1 C-ter interacts directly with β-catenin (Yamamoto et al., 1997) and our recent studies have demonstrated colocalization of MUC1 C-ter and β-catenin in the nucleus (Li et al., 2003). To assess the subcellular distribution of MUC1 C-ter in 3Y1/MUC1 cells, confocal microscopy was performed with an antibody against this subunit. The results demonstrate no detectable reactivity of anti-MUC1 C-ter in 3Y1/vector cells (Figure 2). By contrast, prominent staining of MUC1 C-ter was detectable in the nuclei of 3Y1/MUC1-B cells (Figure 2). The results also demonstrate that localization of β-catenin to the nucleus is markedly increased in the MUC1-expressing cells (Figure 2). Moreover, merging of the images demonstrated nuclear colocalization of the MUC1 C-ter and β-catenin (Figure 2). Similar results were obtained with the 3Y1/MUC1-A and 3Y1/MUC1-C cells (data not shown). These results indicate that MUC1 may function in the import and/or stabilization of nuclear β-catenin.
Figure 2.

Nuclear colocalization of the MUC1 C-ter and β-catenin. 3Y1/Vector-B and 3Y1/MUC1-B cells were fixed, permeabilized and incubated with anti-MUC1 C-ter and anti-β-catenin as described (Li et al., 2003). Nuclei were stained with TO-PRO-3 (Molecular Probes, Eugene, OR, USA). The cells were analysed by confocal microscopy as described (Li et al., 2003)
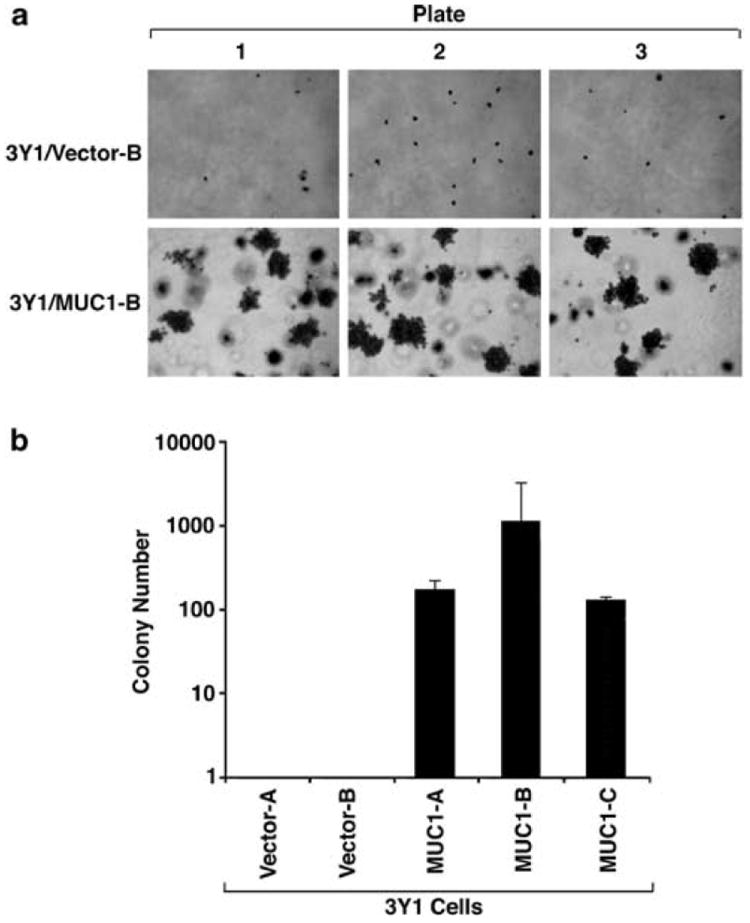
To assess the effects of MUC1 expression on growth, the 3Y1 cells were analysed under anchorage-dependent and -independent conditions. Compared to cells transfected with the empty vector, MUC1 expression had no apparent effect on anchorage-dependent growth in tissue culture plates (data not shown). Anchorageindependent growth was assessed by the formation of colonies in soft agar. Under these conditions, there was no apparent growth of 3Y1 cells expressing the empty vector (Figure 3a). However, soft agar colonies were readily obtained with 3Y1 cells expressing MUC1 (Figure 3a). The plating efficiency was determined by seeding 104 cells into soft agar and then counting colonies after 10 days. The results from three independent experiments demonstrate that the plating efficiencies of 1.5, 11.7a nd 1.4% for the 3Y1/MUC1-A, 3Y1/MUC1-B and 3Y1/MUC1-C cells, respectively (Figure 3b). These findings are comparable to those obtained when 3Y1 cells are transformed with v-Src (Bromberg et al., 1999).
Figure 3.

MUC1 confers anchorage-independent 3Y1 cell growth in soft agar. (a) 3Y1/Vector-A, 3Y1/Vector-B, 3Y1/MUC1-A, 3Y1/MUC1-B and 3Y1/MUC1-C cells (1 × 10⁴/plate) were suspended in soft agar and incubated for 3 weeks. Representative photomicrographs are shown for 3Y1/Vector-B and 3Y1/MUC1-B cells each seeded into triplicate plates. Similar results were obtained with the other independently selected cells expressing the empty vector or MUC1. (b) Colonies larger than 25 cells were counted for each of the indicated cells. The results are expressed as the number of colonies (mean±s.d.) obtained in three independent experiments
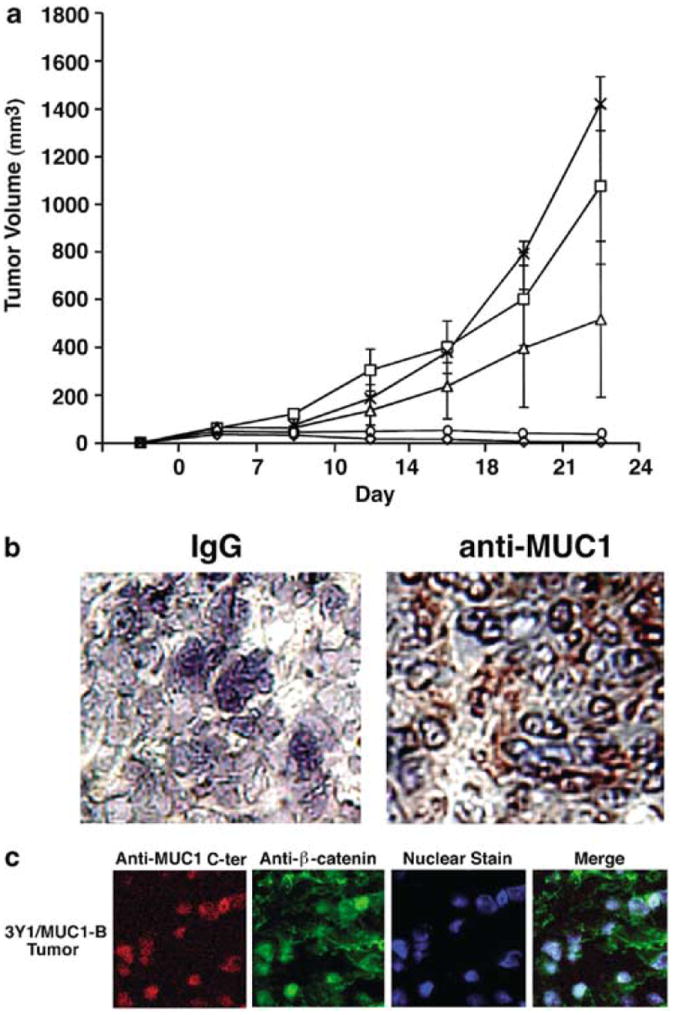
To determine whether MUC1 expression contributes to tumorigenicity, 107 3Y1/vector or 3Y1/MUC1 cells were injected subcutaneously into six to eight nude mice. Tumors were not detectable in mice injected with 3Y1/vector cells (Figure 4a). By contrast, tumors were apparent at the injection site in mice given the 3Y1/MUC1 cells (Figure 4a). Tumor growth was comparable in the three different MUC1 transfectants and there was no evidence of distant metastases (Figure 4b). The 3Y1/MUC1-B cells, however, exhibited a somewhat stronger tumorigenic phenotype (Figure 4b), perhaps consistent with the demonstration that these cells express relatively higher MUC1 levels (Figure 1a) and exhibit more efficient anchorage-independent growth (Figure 3b). Staining of the 3Y1/MUC1 tumors with the DF3 antibody further demonstrated that the growing cells maintain expression of this protein (Figure 4b). Confocal microscopy of tumor sections further showed that, as found in cultured cells, the transfectants express the MUC1 C-ter in a nuclear complex with β-catenin (Figure 4c). These findings indicate that MUC1 induces tumor formation.
Figure 4.

MUC1 induces tumorigenicity of 3Y1 cells in nude mice. (a) 3Y1/Vector-A (◇), 3Y1/Vector-B (○), 3Y1/MUC1-A (□), -B (X) and -C (Δ) cells (1 × 10⁷) were injected subcutaneously into the posterior flank of nude mice. Tumor volumes were calculated from bidimensional measurements at each time point. The results are expressed as the tumor volume (mean±s.d.) obtained from two independent experiments that each included six to eight mice per group. (b) Frozen tumor tissue was sectioned and stained with a control IgG or the DF3 anti-MUC1 antibody. (c) Fixed sections from a 3Y1/MUC1-B tumor were permeabilized and incubated with anti-MUC1 C-ter and anti-β-catenin. Nuclei were stained with TO-PRO-3. Confocal microscopy was performed as described (Li et al., 2003). Little if any staining was obtained when the Texas Red- and fluorescein-conjugated secondary antibodies were used alone as controls (data not shown)
Estimates indicate that, of the 1.3 million tumors diagnosed in the US each year, greater than 800,000 will aberrantly overexpress the MUC1 protein (Jemal et al., 2003). Based on the high frequency of MUC1 overexpression in carcinomas of the breast and other epithelial tissues, this alteration is among the more common events that occur in human tumors. The present findings now provide support for involvement of MUC1 in mediating cellular transformation. The results show that MUC1 expression causes anchorageindependent growth and tumor formation. Few insights are available regarding the mechanism(s) responsible for the effects of MUC1 on the malignant phenotype. The available evidence indicates that MUC1 and E-cadherin compete for binding to the same pool of β-catenin and that MUC1 disrupts E-cadherin-mediated cell adhesion (Kondo et al., 1998; Li et al., 1998). Importantly, disruption of E-cadherin function in homotypic recognition is associated with tumor development (Vleminckx et al., 1991; Kintner, 1992; Shiozaki et al., 1996; Guilford et al., 1998). The effects of MUC1 on anchorage-independent cell growth and tumorigenicity might also be attributed to disruption of cell adhesion by the heavily glycosylated ectodomain. However, the finding that expression of the MUC1-CD is also sufficient for cell transformation indicates that the intracellular signaling function of MUC1 is responsible for the malignant phenotype. In this context, the present results and recent studies (Li et al., 2003) further demonstrate that the MUC1 C-ter colocalizes with β-catenin in the nucleus and thereby may regulate gene transcription.
Acknowledgments
This work was supported in part by Grant CA97098 awarded by the National Cancer Institute. The authors acknowledge Kamal Chauhan for excellent technical support.
Footnotes
DK has a financial interest in ILEX.
References
- Bromberg JF, Wrzeszczynska MH, Devgan G, Zhao Y, Pestell RG, Albanese C, Darnell JE., Jr Cell. 1999;98:295–303. doi: 10.1016/s0092-8674(00)81959-5. [DOI] [PubMed] [Google Scholar]
- Gendler S, Taylor-Papadimitriou J, Duhig T, Rothbard J, Burchell JA. J Biol Chem. 1988;263:12820–12823. [PubMed] [Google Scholar]
- Guilford P, Hopkins J, Harraway J, McLeod M, McLeod N, Harawira P, Taite H, Scoular R, Miller A, Reeve AE. Nature. 1998;392:402–405. doi: 10.1038/32918. [DOI] [PubMed] [Google Scholar]
- Jemal A, Murray T, Samuels A, Ghafoor A, Ward E, Thun M. CA Cancer J Clin. 2003;53:5–26. doi: 10.3322/canjclin.53.1.5. [DOI] [PubMed] [Google Scholar]
- Kintner C. Cell. 1992;69:225–236. doi: 10.1016/0092-8674(92)90404-z. [DOI] [PubMed] [Google Scholar]
- Kondo K, Kohno N, Yokoyama A, Hiwada K. Cancer Res. 1998;58:2014–2019. [PubMed] [Google Scholar]
- Kufe D, Inghirami G, Abe M, Hayes D, Justi-Wheeler H, Schlom J. Hybridoma. 1984;3:223–232. doi: 10.1089/hyb.1984.3.223. [DOI] [PubMed] [Google Scholar]
- Li Y, Bharti A, Chen D, Gong J, Kufe D. Mol Cell Biol. 1998;18:7216–7224. doi: 10.1128/mcb.18.12.7216. [DOI] [PMC free article] [PubMed] [Google Scholar]
- Li Y, Chen W, Ren J, Yu W, Li Q, Yoshida K, Kufe D. Cancer Biol Ther. 2003;2:187–193. doi: 10.4161/cbt.2.2.282. [DOI] [PubMed] [Google Scholar]
- Li Y, Kuwahara H, Ren J, Wen G, Kufe D. J Biol Chem. 2001a;276:6061–6064. doi: 10.1074/jbc.C000754200. [DOI] [PubMed] [Google Scholar]
- Li Y, Ren J, Yu W-H, Li G, Kuwahara H, Yin L, Carraway KL, Kufe D. J Biol Chem. 2001b;276:35239–35242. doi: 10.1074/jbc.C100359200. [DOI] [PubMed] [Google Scholar]
- Ligtenberg M, Buijs F, Vos H, Hilkens J. Cancer Res. 1992;52:223–232. [PubMed] [Google Scholar]
- Ren J, Li Y, Kufe D. J Biol Chem. 2002;277:17616–17622. doi: 10.1074/jbc.M200436200. [DOI] [PubMed] [Google Scholar]
- Shiozaki H, Oka H, Inoue M, Tamura S, Monden M. Cancer. 1996;77:1605–1613. doi: 10.1002/(SICI)1097-0142(19960415)77:8<1605::AID-CNCR28>3.0.CO;2-2. [DOI] [PubMed] [Google Scholar]
- Siddiqui J, Abe M, Hayes D, Shani E, Yunis E, Kufe D. Proc Natl Acad Sci USA. 1988;85:2320–2323. doi: 10.1073/pnas.85.7.2320. [DOI] [PMC free article] [PubMed] [Google Scholar]
- Vleminckx K, Vakaet LJ, Mareel M, Fiers W, van Roy F. Cell. 1991;66:107–119. doi: 10.1016/0092-8674(91)90143-m. [DOI] [PubMed] [Google Scholar]
- Yamamoto M, Bharti A, Li Y, Kufe D. J Biol Chem. 1997;272:12492–12494. doi: 10.1074/jbc.272.19.12492. [DOI] [PubMed] [Google Scholar]


