

Abstract
Glucocorticoids (GCs) induce insulin resistance (IR), a condition known to alter oral homeostasis. This study investigated the effects of long-term dexamethasone administration on morphofunctional aspects of salivary glands. Male Wistar rats received daily injections of dexamethasone [0.1 mg/kg body weight (b.w.), intraperitoneally] for 10 days (DEX), whereas control rats received saline. Subsequently, glycaemia, insulinaemia, insulin secretion and salivary flow were analysed. The parotid and submandibular glands were collected for histomorphometric evaluation and Western blot experiments. The DEX rats were found to be normoglycaemic, hyperinsulinaemic, insulin resistant and glucose intolerant (P < 0.05). DEX rat islets secreted more insulin in response to glucose (P < 0.05). DEX rats had significant reductions in the masses of the parotid (29%) and submandibular (16%) glands (P < 0.05) that was associated with reduced salivary flux rate. The hypotrophy in both glands observed in the DEX group was associated with marked reduction in the volume of the acinar cells in these glands of 50% and 26% respectively (P < 0.05). The total number of acinar cells was increased in the submandibular glands of the DEX rats (P < 0.05) but not in the parotid glands. The levels of proteins related to insulin and survival signalling in both glands did not differ between the groups. In conclusion, the long-term administration of dexamethasone caused IR, which was associated with significant reductions in both mass and flux rate of the salivary glands. The parotid and submandibular glands exhibited reduced acinar cell volume; however, the submandibular glands displayed acinar hyperplasia, indicating a gland-specific response to GCs. Our data emphasize that GC-based therapies and insulin-resistant states have a negative impact on salivary gland homeostasis.
Keywords: dexamethasone, glucocorticoids, glucose intolerance, insulin resistance, parotid gland, submandibular gland
Due to their potent anti-inflammatory, anti-allergic and immunosuppressive effects, synthetic glucocorticoid (GC) analogues, including dexamethasone, are widely used to treat allergies, asthma, dermatitis, rheumatoid arthritis and ulcerative colitis, as well as physiological brain disorders and several types of haematological cancers (Revollo & Cidlowski 2009; Baschant & Tuckermann 2010). However, chronic treatment with dexamethasone is associated with several side effects, such as reduced muscle tone, osteoporosis, weight gain, cardiovascular risks, mood changes, glaucoma and metabolic disturbances including peripheral insulin resistance (IR), glucose intolerance, dyslipidaemia and type 2 diabetes mellitus (T2DM) in susceptible individuals (Baschant & Tuckermann 2010; Lannan et al. 2012).
In addition to lubricating oral tissues and facilitating speaking, eating and swallowing (Asl Aminabadi et al. 2013), saliva has important biological functions involving the salivary flow rate, pH, buffering capacity, dilution and elimination of sugar and balancing demineralization/remineralization; moreover, it contains critical components, such as proteins, calcium and the products of the antioxidant defence system, which exert anti-microbial activity to prevent caries and improve oral health (Llena-Puy 2006; Preethi et al. 2010). However, IR linked to obesity and T2DM can alter salivary functions by increasing inflammation and causing submandibular gland derangements (Mozaffari et al. 2011). This insulin-resistant state associated with T2DM leads to an increase in salivary Ca2+ and reductions in magnesium (Mg2+), zinc (Zn2+) and potassium (K+) in parallel with a diminished secretory capacity of the salivary glands, increasing the susceptibility to oral infections (Mata et al. 2004).
Changes in salivary components or salivary flow are recognized to lead to periodontal disease, in which the use of certain medications, for example dexamethasone, is the reason for such salivary alterations (Sreebny & Schwartz 1997). Rats treated with dexamethasone had a 75% reduction in the volume of saliva produced by the parotid gland in parallel with increased protein concentrations and changes in salivary composition (Johnson et al. 1987a,b). Another study reported that the administration of dexamethasone to rats for one week resulted in no significant changes in salivary flow or in the ultrastructure of submandibular gland acinar cells; however, significant increases in the Ca2+ and K+ salivary content and alterations in the salivary protein concentration were observed (Sagulin & Roomans 1989).
A previous study demonstrated that insulin-resistant individuals were at increased risk of developing severe periodontitis (Benguigui et al. 2010). Additionally, a study of non-diabetic and non-smoking subjects revealed an elevated incidence of periodontal disease among insulin-resistant obese individuals between 30 and 49 years of age (Timonen et al. 2011). The authors suggested that IR might favour the development of periodontal disease and that several alterable obesity-related factors could contribute to the development of periodontal disease. According to an earlier report, severe periodontitis may be related to elevated blood glucose, which in turn is commonly associated with IR (Tsai et al. 2002).
IR can be accompanied by disorders in advanced glycation endproducts (AGE)/receptor for AGE (RAGE) and in oxidative stress, in addition to an imbalance in cytokines related to the immune response, which can lead to periodontal tissue damage (Taylor et al. 2013). Elevated blood glucose levels may induce the non-enzymatic glycation of proteins and lipids, resulting in AGE formation and an increase in RAGE expression in periodontal tissues (da Silva 2003). Thus, an increase in AGE/RAGE signalling may result in proinflammatory actions by increasing the expression levels of the NF-κB, TNF-α and IL-6 cytokines (Katz et al. 2005) as well as oxidant effects (Schmidt et al. 1996).
Considering that salivary dysfunction may be associated with an insulin-resistant state and that a salivary function imbalance induces periodontitis, caries and oral mucosal changes, we investigated the effects of moderate IR and glucose intolerance caused by long-term dexamethasone treatment on oral homeostasis and on the morphofunctional aspects of the parotid and submandibular glands.
Methods
Ethical approval
The experiments with rats were approved by the Institutional Review Board on Animal Experimentation of São Paulo State University under protocol n. 1479/46/01/08 and in accordance with the eighth edition of the guide for the care and use of laboratory animals – OACU-NIH.
Materials
Dexamethasone phosphate (Decadron®) was manufactured by Aché (Campinas, SP, Brazil). Pilocarpine hydrochloride was from Galena (Campinas, SP, Brazil). Human recombinant insulin (Humulin®) was manufactured by Lilly (Indianapolis, IN, USA). The reagents used for the radioimmunoassay (RIA) to determine the hepatic glycogen and histological procedures were supplied by LabSynth (Diadema, SP, Brazil), Merck KGaA (Darmstadt, Germany) and Sigma (St. Louis, MO, USA). The 125I-labelled insulin (human recombinant) for RIA was purchased from PerkinElmer (Waltham, MA, USA). SDS-PAGE and immunoblotting were performed using Bio-Rad systems (Hercules, CA, USA). Anti-serine-threonine kinase Akt (PKB) (goat polyclonal), anti-phosphorylated PKB (Ser473) (pPKB) (rabbit polyclonal), anti-Bcl2 (rabbit polyclonal), anti-Bax (rabbit polyclonal) and anti-α-tubulin (mouse monoclonal) antibodies were obtained from Santa Cruz Biotechnology (Santa Cruz, CA, USA).
Animals and dexamethasone treatment
Experiments were performed on male Wistar rats aged three months. The rats were obtained from the Campinas State University Animal Breeding Center and were kept at 22 ± 1 °C on a 12 h light/dark cycle (lights on 06:00 – lights off 18:00). The rats had access to food (commercial standard chow, Nuvilab® CR-1; Nuvital, PR, Brazil) and water ad libitum. A total of 70 rats were used in this study. Half of the rats received daily dexamethasone injection [0.1 mg/kg, body weight (b.w.), intraperitoneally (i.p)], at a time between 7:30 and 8:30 h, for 10 consecutive days (DEX), while the other group of control rats (CTL) received 0.9% NaCl (1 ml/kg b.w., i.p.). All experiments were performed the day after the last dexamethasone administration.
Body weight, food intake, blood glucose and serum insulin
Body weight and food intake were measured from two days before treatment onset until the day of euthanasia. Fasted (12–14 h) rats had blood collected from the tail for measurement of blood glucose levels with a glucometer (Accu-Check® Performa, Roche Diagnostics GmbH, Mannheim, Germany). Subsequently, the group of rats (CTL and DEX) used for metabolic determinations (serum insulin, hepatic glycogen content, retroperitoneal fat and insulin secretion protocols) was killed (exposure to CO2 followed by decapitation) and the trunk blood was collected. Retroperitoneal fat was gently withdrawn and weighed (Metler-Toledo AT261 Delta Rang®). The serum, obtained after blood clotting and centrifugation in saline-washed tubes, was used to measure the insulin concentrations by RIA utilizing a Guinea pig anti-rat insulin antibody and rat insulin as standard (Rafacho et al. 2008a,b). The group of rats (CTL and DEX) used for salivary gland analysis (histological and immunoblotting) was killed after anaesthetic overdose with ketamine/xylazine (100/25 mg/kg b.w. i.p.) followed by exsanguination. Subsequently, liver samples and the parotid (PaG) and submandibular (SbG) glands were gently withdrawn and weighed (Metler-Toledo AT261 Delta Rang®).
Liver glycogen measurements
Determination of hepatic glycogen was performed according to Lo et al. 1970; with some previously described modifications (Lo et al. 1970; Giozzet et al. 2008). Briefly, the liver samples (300–500 mg) were transferred to test tubes containing 30% KOH (w/v) and boiled for 1 h until complete homogenization. Na2SO4 was then added, and the glycogen was precipitated with ethanol. The samples were centrifuged at 800 g for 10 min, the supernatants were discarded, and the glycogen was dissolved in hot distilled water. Ethanol was added and the pellets obtained after a second centrifugation were dissolved in distilled water in a final volume of 25 ml. Glycogen content was measured by treating a fixed volume of sample with phenol reagent and H2SO4. Absorbance was then read at 490 nm with a spectrophotometer (Berthold technologies, Oak Ridge, TN, USA).
Intraperitoneal glucose tolerance test (ipGTT)
A separate group of fasted (12 h) CTL and DEX rats were used for ipGTT experiments. Conscious rats had their tail tip cut for collection of two drops of blood. The first drop was discarded, and the second was used for determination of glycaemia (time 0) using a glucometer, as described before. Immediately, 50% glucose solution (2 g/kg b.w., i.p.) was administered and blood samples were collected at 30, 60, 90 and 120 min from the tail tip for blood glucose level measurements (Rafacho et al. 2010).
Intraperitoneal insulin tolerance test (ipITT)
A separate group of fed CTL and DEX rats were used for ipITT. Conscious rats had glycaemia measured at time 0, as for ipGTT. Immediately, human recombinant insulin (equivalent to 2 IU/kg b.w., i.p.) was administered. Additional samples were collected at 10, 20 and 30 min for blood glucose measurement. The constant rate for glucose disappearance (KITT) was calculated from the slope of the regression line obtained with log-transformed glucose values between 0 and 30 min after insulin administration (linear phase of glucose decay) (Angelini et al. 2010; Rafacho et al. 2010).
Insulin content and secretion
Insulin content and secretion were measured as previously described in detail (Rafacho et al. 2008a,b, 2010). Briefly, after islet isolation, groups of five islets were first incubated for 1 h at 37 °C in 1 ml of Krebs–bicarbonate buffer solution containing 5.6 mM glucose, supplemented with 0.5% of bovine serum albumin and equilibrated with a mixture of 95% O2: 5% CO2, pH 7.4. The medium was then replaced by fresh buffer containing 1 ml 2.8 mM or 16.7 mM glucose and incubated for a further 1 h period. At the end of incubation, the supernatant was collected and appropriately stored at −20 °C for subsequent measurement of insulin content by RIA, as described above.
Protein extraction and immunoblotting
Fragments of parotid and submandibular glands were homogenized in ice-cold cell lysis buffer (Cell Signaling, MA, USA) using a tissue homogenizer T18 UltraTurrax® (IKA®; Staufen, Germany) for three periods of 10 s at the maximum speed (Rafacho et al. 2008a,b, 2009). Then, the samples were centrifuged at 4 °C at 14,000 g for 20 min. Protein concentration from the supernatant was determined by the Bradford method, according to the manufacturer’s instructions (Bio-Rad). Immunoblotting experiments were performed at least four times. Protein obtained from glands (100 μg) was used for each experiment, being one rat equivalent to n = 1. After blocking at room temperature (RT) for 2 h in TBST/5% dry skimmed milk, membranes containing gland lysates were washed in TBST (3 × 7 min) and incubated overnight with primary antibodies at the dilutions recommended by the manufacturers in TBST/3% dry skimmed milk. After washing in TBST (3 × 10 min), membranes were incubated with the appropriate secondary antibody conjugated with HRP for 90 min in TBST/1% dried skimmed milk at RT. Antibody binding was detected by enhanced SuperSignal® West Pico Chemiluminescent Substrate (PIERCE, Rockford, IL, USA), as described by the manufacturer. Blots were scanned (Epson expression 1600), and the densitometry of protein bands was determined by pixels intensity using Scion Image software (Scion Corporation, Bethesda, MD, USA).
Histological analysis
After weighing the glands they were fixed in 10% formalin–phosphate buffer for a week at RT. Then, the fragments were washed with water overnight, dehydrated and embedded in Histosec (Merck). Slices (5 μm) were cut in a rotation microtome Leitz-Jung® (Leica Microsystems, Wetzlar, Germany), with intervals of 50 μm, and stained with haematoxylin/eosin (H&E).
Stereological analysis
Determination of the processed gland volume
In the parotid and submandibular glands of 10 rats (n = 5 for CTL and DEX groups), the volume of the processed gland (Vp) was calculated using the formula Vp = m/δ) × rf, where m = gland mass, δ = gland density and rf = correction of the retraction factor caused by histological processing. The gland density (δ) was determined in the right glands using Mettler Toledo AR 261 Delta Rang scale containing accessories for determination of density. The average density obtained for both groups was 1.058 mg/cm³ for parotid gland and 1.060 mg/cm3 for submandibular gland (P > 0.05). The rf was evaluated in the left gland using the method described by Sesso and Taga (1978). In this method, linear measurements are obtained from the square trimmed fresh organ (Sf) and after histological processing (Sp). The means of Sf and Sp linear values are raised to the third power. The retraction factor (rf) was estimated using the relationship: rf = Sp3/Sf3. The mean rf was 0.760 for both groups (P > 0.05).
Stereological measurements of volume density (Vvi), total volume (Vti) and absolute cell number (Ni) of each gland structure (i) and of nuclear density ρNi of each cell type
These morphometric measurements were obtained using a Zeiss 8× eyepiece containing a Zeiss II integration graticule with 10 parallel lines and 100 points in quadrangular area and a 100× oil-immersion objective in an Olympus light microscope (Olympus America Inc., New York, NY, USA). In 50 histological fields per animal, selected by systematic sampling (Weibel 1969), the following parameters were counted: a) number of points (Pi) over the images of each structure (i) and over the entire gland (P); b) number of points over the nuclei (Pni) and the cytoplasm (Pcyti) of acinar cells (i); c) number of nuclei (ni) of acinar cells; and d) number of intersections (c) of the acinar nuclei with the graticule lines. Knowing the processed gland volume (Vp), the distance between the graticule line (d); the total area examined (A); and the thickness of the section (t), the following was calculated with data obtained in the counts: Vvi = Pi/p, Vti = Vvi·Vp, Ni = (2n·Vp)/A[(c/n) d + 2t] and ρni = Pni/Pni + Pcyt (Weibel 1969; Ahern & Dunnil 1982).
Determination of the volume of nucleus and cytoplasm of each cell type
The orthogonal diameters of 50 nuclei of each cell type per rat were measured using a 10× Ramsden type Olympus eyepiece and a 100× oil-immersion objective. The mean nucleus volume was calculated by the formula Vni = 4/3π·r3. The nuclear volume density (ρni) determined by point-counting method was overestimated because of the Holmes effect. This overestimation was corrected using the correction factor (Ko) calculated by the relationship Ko = (1 + 3t)/2D, where D = mean nucleus diameter and t = section thickness. The corrected volume densities of the nucleus (ρni corr) and cytoplasm (ρcyti corr) are ρni corr = ρni/Ko and ρcyti corr = 1 − ρni corr. Knowing the mean volume of the nucleus (Vni), the cytoplasmic volume (Vcyti) was calculated by the relationship Vcyti = (Vni·ρcyti corr)/ρni corr.
Salivary flow determination
A separate group of fed CTL and DEX rats were used for determination of salivary flux. According to Bernarde’s method for salivary collection, after 12 h fasting, rats were anaesthetized with ketamine (45 mg/kg, intramuscular) and xylazine (5 mg/kg, intramuscular) and the salivary flow was stimulated by pilocarpine hydrochloride (5 mg/kg b.w., i.p.; Galena, Campinas, Brazil). After the pilocarpine injection, the animals were placed in an inclined bed. The stimulated salivary flux was collected in flasks. The salivary volume was calculated from the difference in weight of full and empty flasks, considering the saliva density as 1 mg/ml. As the rat body weight was altered during dexamethasone treatment, the salivary flow rate was normalized and expressed as ml/min.100 g/b.w. (Picco et al. 2012).
Statistical analysis
The results were expressed as the means ± standard error of the mean (SEM) of the indicated number (n) of experiments. Statistical comparisons between data from DEX and CTL groups were performed using the unpaired Student’s t-test. Statistical analyses were performed on the SigmaStat software (Jadel Scientific Corporation, San Jose, CA, USA) at a significance level of P < 0.050.
Results
DEX rats have reduced body weight and food intake
Before the initiation of dexamethasone treatment, no differences in body weight were observed between the DEX and the CTL group (Figure 1a). The DEX rats exhibited a linear and sustained reduction in body weight, which was significant from the fifth day of dexamethasone treatment until the day before sacrifice (n = 10, P < 0.050). On the day before killing, the body weight of the DEX rats was approximately 13% lower than that of the CTL rats (Figure 1a). As expected, both groups had similar food intake before the onset of dexamethasone administration. After the first day of dexamethasone treatment, the DEX rats demonstrated a sharp decrease in food intake, which was sustained until the tenth day of the experimental protocol (n = 10, P < 0.050). On the day before euthanasia, the DEX rats were ingesting 10% less chow compared with the CTL rats (Figure 1b). These data demonstrate that prolonged dexamethasone treatment induces body weight loss in parallel with hypophagia.
Figure 1.
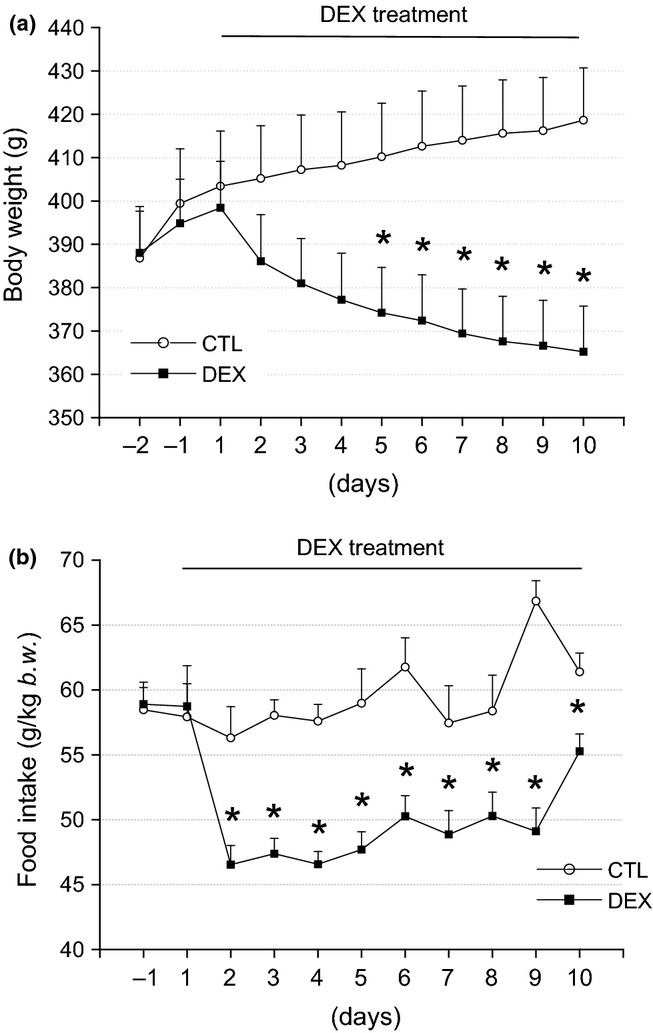
Reduced body weight and food intake in the DEX rats. In (a), the average body weight values during the DEX treatment. Observe the significant reduction of body weight in the DEX rats after the 4th day of DEX treatment compared with the CTL rats. In (b), the average food intake values during the DEX treatment. Note the significant reduction in the food intake after the first day of treatment in the DEX compared with the CTL group. These values remained reduced until the day before euthanasia. Data are presented as the means ± SEM *significantly different vs. control group using unpaired Student’s t-test (P < 0.05; n = 10).
DEX rats are hyperinsulinaemic in parallel with normoglycaemia
To examine the rats’ glucose homeostasis, their fasting blood glucose and serum insulin levels were measured. The DEX and CTL rats had similar blood glucose values (n = 10) (Figure 2a). However, the DEX rats exhibited significantly increased (3.6-fold) serum insulin values compared with the CTL rats (n = 10, P < 0.001) (Figure 2b). The fasting serum insulin values were 2.1 ± 0.2 ng/ml for the CTL rats and 9.9 ± 0.3 ng/ml for the DEX rats. A 5.5-fold increase in the hepatic glycogen content was observed in the DEX rats vs. the CTL rats (n = 10, P < 0.001) (Figure 2c). No significant difference in the retroperitoneal fat mass was observed in the DEX rats compared with the CTL rats (n = 10) (Figure 2d). These observations indicated that the DEX rats were in a state of peripheral IR, in which hyperinsulinaemia compensated for reduced insulin action at the periphery to maintain the blood glucose values within physiological limits.
Figure 2.
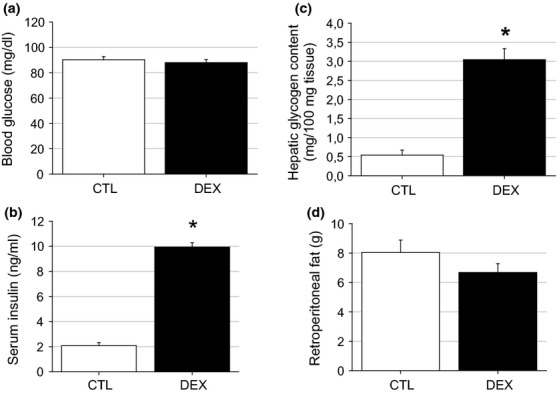
Blood glucose and serum insulin values in the DEX rats. Blood glucose (a), serum insulin (b), hepatic glycogen content (c) and retroperitoneal fat (d) in the DEX and CTL rats on the day of killing. The fasting blood glucose and the retroperitoneal values were similar between the DEX and the CTL groups. The fasting serum insulin and the hepatic glycogen content were higher in the DEX compared with the CTL rats. Data are presented as the means ± SEM *significantly different vs. control group using unpaired Student’s t-test (P < 0.05; n = 10).
DEX rats are insulin resistant and glucose intolerant
We evaluated whether the hyperinsulinaemia exhibited by the DEX rats was associated with reduced peripheral insulin sensitivity. The DEX rats exhibited reduced peripheral insulin sensitivity, as indicated by the constant glucose disappearance rate (KITT) values obtained during the ipITT experiment (P = 0.003) (Figure 3a, b). The KITT values were 2.4 ± 0.35% per min for the CTL rats and 1.6 ± 0.05% per min for the DEX rats (n = 10). IR is commonly accompanied by glucose intolerance (Weir & Bonner-Weir 2004). A glucose tolerance test (ipGTT) was performed to verify the presence of glucose intolerance in the insulin-resistant rats. As expected, the DEX rats showed higher blood glucose values after a D-glucose challenge (60 and 90 min) compared with the CTL animals (n = 10, P < 0.001) (Figure 3c). The ability to properly metabolize glucose appeared to be slightly impaired in the DEX rats, according to their higher area under the curve (AUC) glucose values obtained during the ipGTT (7322 ± 610 mg/dl per 120 min for the CTL rats and 10756 ± 387 mg/dl per 120 min for the DEX rats) (Figure 3d). These observations demonstrate the negative impact of dexamethasone on peripheral insulin sensitivity and glucose tolerance.
Figure 3.
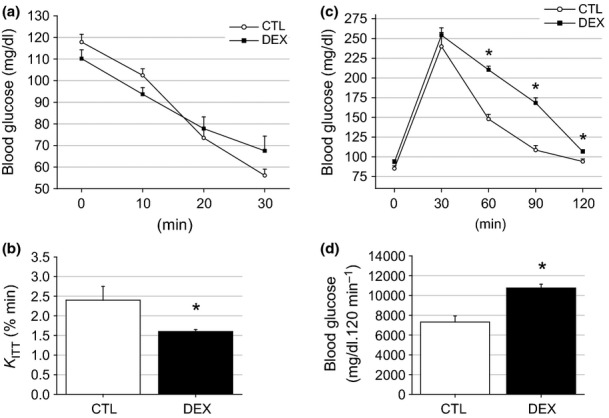
Insulin sensitivity and glucose tolerance are impaired in the DEX rats. Insulin tolerance test (ipITT) (a), the constant rate for glucose disappearance during ipITT (KITT) (b), the average blood glucose values during an intraperitoneal glucose tolerance test (ipGTT) (c) and the area under glucose curve (AUC) obtained during the ipGTT (d). According to the ipITT and the KITT, there was a reduction in the insulin sensitivity in the DEX compared with the CTL rats. Also, dexamethasone treatment resulted in mild glucose intolerance in the DEX rats as can be observed by the calculus of the AUC. Data are presented as the means ± SEM *significantly different vs. control group using unpaired Student’s t-test (P < 0.05; n = 10).
DEX rats exhibit insulin hypersecretion under glucose stimulation
To determine whether hyperinsulinaemia is associated with insulin hypersecretion or whether glucose intolerance results from inadequate insulin secretion, the glucose-stimulated insulin secretion (GSIS) protocol was used. Islets from the DEX rats were more responsive to glucose both at substimulatory (2.8 mM) and stimulatory (16.7 mM) glucose concentrations compared with the CTL islets (n = 12 wells, P < 0.001) (Figure 4a). The insulin secretion values at 16.7 mM glucose were 9.4 ± 1.2 ng/ml islet/h for the CTL islets and 20.5 ± 1.8 ng/ml islet/h for the DEX islets. Increasing the glucose concentration from 2.8 to 16.7 mM resulted in increases in insulin secretion of 7.1-fold for the CTL group and 8.9-fold for the DEX group (n = 12, NS) (Figure 4b). These data reveal that the DEX rats displayed a stronger insulin response to glucose, which supported the elevation in fasting insulinaemia but was not sufficient to prevent transient glucose intolerance.
Figure 4.
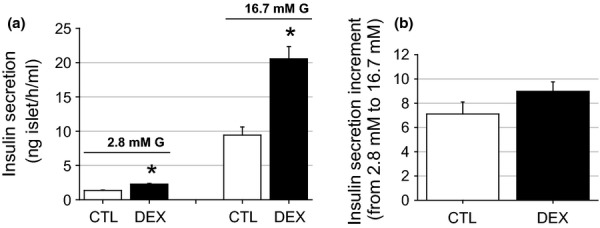
Increased glucose-stimulated insulin secretion (GSIS) in islets from the DEX rats. Insulin release from isolated islets in the CTL and in the DEX rats. At a concentration of 2.8 mM glucose, insulin secretion was higher in the DEX compared with the CTL islets. At a stimulatory glucose concentration (16.7 mM), the insulin secretion was enhanced 2.2-fold in islets from the dexamethasone-treated rats. Data are means ± SEM *significantly different vs. control group using unpaired Student’s t-test (P < 0.05; n = 12 wells).
DEX rats develop salivary glands atrophy and reduced salivary flow
Representative photomicrographs and weight and morphometric data from the parotid and submandibular glands from the CTL and DEX groups are shown in Figures 5 and 6 a and b respectively, and in Table 1. The masses of the parotid and submandibular glands of the DEX group were 29.33% (P = 0.003) and 16.4% (P = 0.040) lower than those of the CTL group respectively (Table 1). The reduction in the mass of both glands in the DEX group affected salivary flow, which was reduced by 38% (P = 0.019) compared with the CTL group (Table 1). The volume density of the parotid acinar cells in the DEX group was 20% lower than in the CTL group (P = 0.001), whereas the volume densities of the ducts and stroma were 50% (P = 0.016) and 60% (P = 0.005) higher in the DEX group respectively (Figure 5c). The total acinar volume in the DEX group was 40% lower compared with the CTL group (P = 0.017), whereas the total volumes of the other duct and stromal structures did not differ between the groups (Figure 5d). This finding indicated that only acinar structures were morphologically affected by the dexamethasone treatment. Related to acinar structures, the acinar cell volume was 50% lower (P = 0.003), whereas the cell number was similar between the CTL and DEX groups (P = 0.285) (Figure 5e, f), indicating that the reduction in the parotid gland volume in the DEX group was due to the reduced volume of the acinar cells. Concerning the submandibular glands, the stromal volume density was 29% lower (P = 0.035) and the total stromal volume was 43% lower (P = 0.002) in the DEX group compared with the CTL group (Figure 6c, d). The other structures did not differ between the groups. Compared with the CTL group, the acinar cell volume in the submandibular gland in the DEX group was 26% lower (P = 0.019), whereas the number of acinar cells was 26% higher (P = 0.036) (Figure 6e, f).
Figure 5.
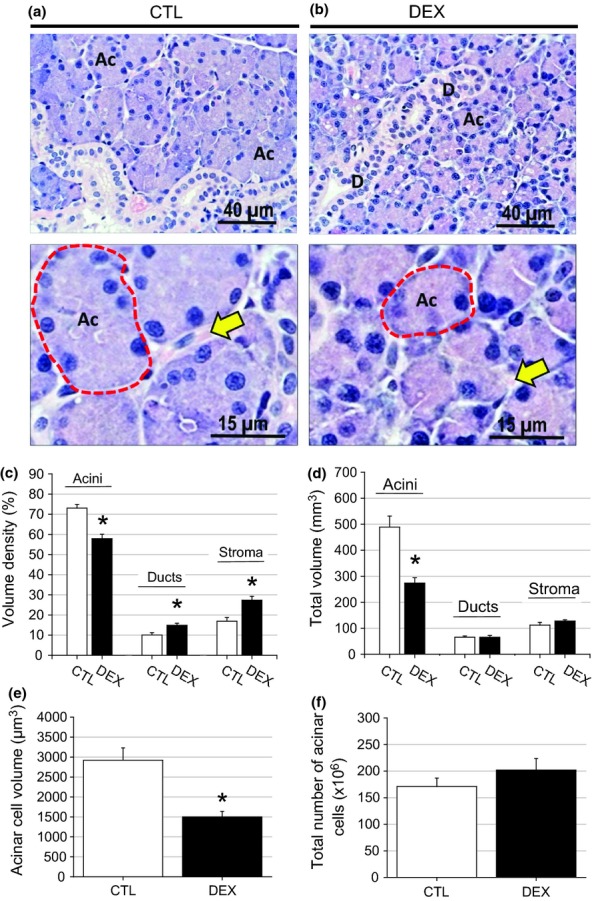
Decrease of parotid gland mass in the DEX rats. In the parotid gland of the CTL group (a), large acinar structures were observed with nuclei suprabasal and a wide-sinuous duct system. In the DEX parotid gland (b), only the acinar structures showed marked decrease in the cytoplasmic volume. HE, ×40 and ×100 objectives. The significant reduction in the parotid gland mass observed in the DEX group was a consequence of decreased acini volume that was paralleled by increased density volume of the ducts and the stroma (c,d) in relation to the CTL group. In the DEX parotid gland, a reduction of acinar cell volume was observed (e) in relation to the CTL group. The total number of acinar cells was maintained (f). Data are means ± SEM *significantly different vs. control group using unpaired Student’s t-test (P < 0.05; n = 5).
Figure 6.
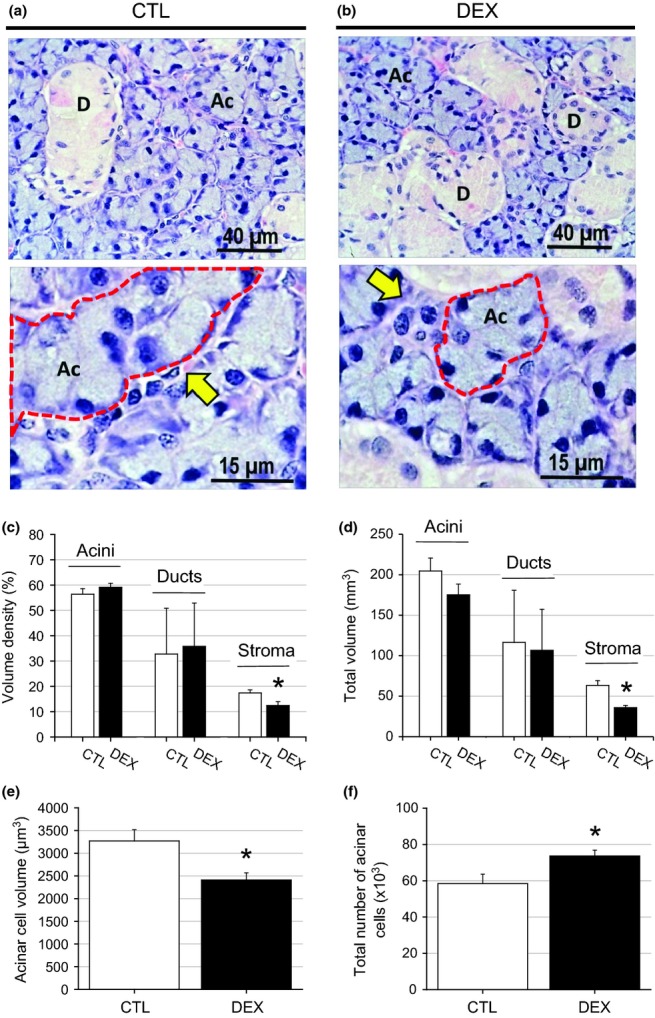
Decrease of submandibular gland mass in the DEX rats. In the submandibular gland of the CTL group (a), observed large acinar structures were observed with nuclei suprabasal and a wide-sinuous duct system. In the DEX submandibular gland (b), only the acinar structures showed marked decrease in the cytoplasmic volume. HE, ×40 and ×100 objectives. The significant reduction in the submandibular gland mass observed in the DEX group was a consequence of the decreased stroma density (c) and the total volume (d) in relation to the CTL group. In the DEX submandibular gland a reduction of the acinar cell volume was observed (e) in relation to the CTL group that was compensated by increased number of the acinar cells (f). Data are means ± SEM *significantly different vs. control group using unpaired Student’s t-test (P < 0.05; n = 5).
Table 1.
Gland mass and salivary flux in the control (CTL) and the dexamethasone-treated rats (DEX)
| CTL | DEX | |
|---|---|---|
| Gland mass (mg) | ||
| Parotid | 927.8 ± 53.2 | 655.7 ± 22.2* |
| Submandubular | 475.1 ± 16.6 | 397.2 ± 3.1* |
| Salivary flux (μl/min) | 15.8 ± 0.24 | 9.8 ± 0.06* |
Data are expressed as mean ± SEM (n = 5). * P < 0.050 vs. CTL.
PKB, Bax and Bcl-2 protein contents are not altered in both salivary glands
To examine possible associations between gland atrophy and several candidate signalling proteins, the levels of the insulin-responsive serine kinase PKB, pro-apoptotic Bax and anti-apoptotic Bcl-2 proteins in the parotid and submandibular glands were measured in both groups. Figure 7a, b shows the phosphorylated and total PKB protein contents in the parotid glands; no significant alterations were observed in either value (n = 5) or in the p-PKB/PKB protein ratio (data not shown). The same protein expression pattern was observed in submandibular lysates from the DEX and CTL groups (n = 5) (Figure 8a, b). The levels of the Bax and Bcl-2 proteins in the parotid glands of the DEX rats were also similar to those of the CTL group, although a tendency towards a reduction in the Bcl-2 protein content was observed in the DEX group compared with the CTL group (n = 5, NS) (Figure 7c, d). No significant difference in the Bax/Bcl-2 ratio was observed between the CTL and DEX groups (data not shown). The level of the Bax and Bcl-2 proteins did not differ significantly in the submandibular glands of the DEX rats (n = 5, Figure 8c, d). Taken together, these data suggest that parotid and submandibular atrophy is most likely not related to alterations in PKB or Bax/Bcl-2 protein levels.
Figure 7.
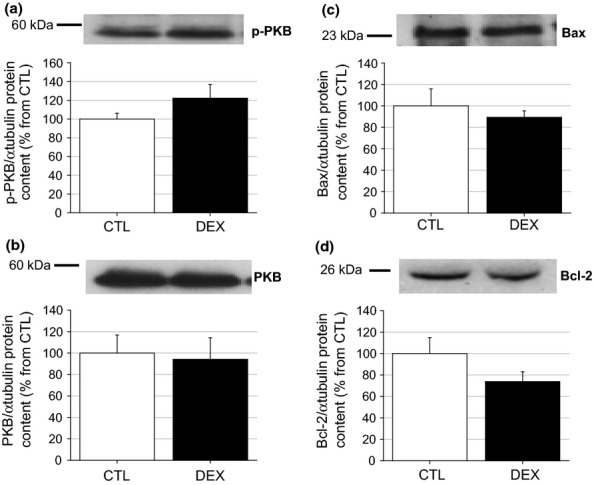
Parotid PKB, Bax and Bcl2 proteins content in the DEX rats. Western blot experiments for the phosphorylated (a) and total (b) serine-threonine kinase PKB, pro-apoptotic Bax (c) and anti-apoptotic Bcl-2 (d) proteins in parotid from the CTL and DEX rats. No differences were observed in the parotid p-PKB or total PKB, as well as with Bax content between the DEX and CTL rats. Although no significant difference was observed, the parotid Bcl-2 content tended to be reduced in the DEX compared with the CTL groups. The figures are representative immunoblots performed at least five times on separate tissue extracts. Data are means ± SEM.
Figure 8.
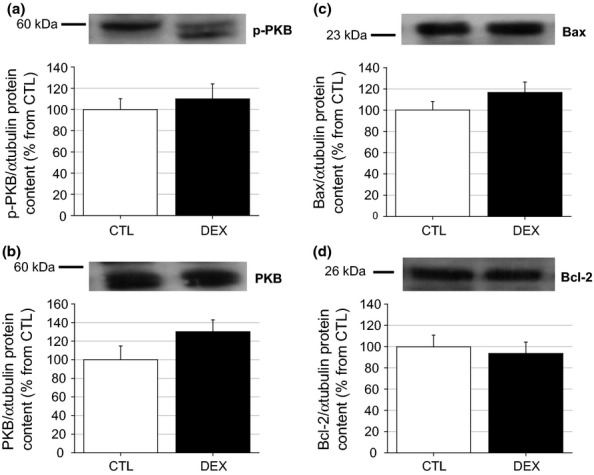
Submandibular PKB, Bax and Bcl2 proteins content in the DEX rats. Western blot experiments for the phosphorylated (a) and total (b) serine-threonine kinase PKB, pro-apoptotic Bax (c) and anti-apoptotic Bcl-2 (d) proteins in submandibular from the CTL and DEX rats. No differences were observed in the parotid p-PKB or total PKB, as well as with Bax content between the DEX and CTL rats. The figures are representative immunoblots performed at least five times on separate tissue extracts. Data are means ± SEM.
Discussion
IR and disruptions in salivary gland metabolism involving salivary composition and protein concentrations alter the oral microbiota, which in turn increases the susceptibility of individuals to pathologies such as periodontal disease and caries, making this a relevant issue in dentistry (Dodds et al. 2005; Benguigui et al. 2010; Demmer et al. 2012). The glands of rats that developed insulin-resistant obesity by consuming a high-fat diet exhibited reduced salivary protein concentrations and an increased amount of antioxidant enzymes (superoxide dismutase and catalase); these changes were particularly evident in the parotid glands (Zalewska et al. 2013). Reductions in the concentrations of salivary proteins, for example amylase, are commonly found in conditions involving decreased salivary gland mass (Johnson 1982). In the present study, a 10-day course of dexamethasone, which is frequently used to treat inflammatory-associated diseases, resulted in a typical state of IR in the absence of fasting hyperglycaemia. Notably, this insulin-resistant state was associated with significant hypotrophy of the parotid and submandibular glands.
Reductions in body weight and food intake during dexamethasone treatment were previously demonstrated by our group and others (Rafacho et al. 2010; Drakulic et al. 2013; Tavoni et al. 2013). The hypophagic response of the DEX rats may be partially explained by the anorexigenic effects of insulin and leptin on the hypothalamus; both hormones are increased in dexamethasone-treated subjects (Willi et al. 2002; Rafacho et al. 2009; Rafacho et al. 2011). The reduction in chewing in the DEX rats may explain not only their decreased body weight but also their salivary gland atrophy. Replacing a solid diet with a liquid diet in rats has been demonstrated to result in an approximately 50% reduction in parotid gland weight (Johnson 1982), which could be in accordance with the data from our hypophagic DEX rats.
The marked increase in circulating insulin levels and the significant reduction in glucose decay in the ipITT experiment demonstrated the presence of IR in the DEX rats, thus validating the model of GC-induced IR in the present study. It is recognized that pancreatic islet function is reciprocally related to the degree of peripheral insulin sensitivity: a reduction in the latter elicits an adaptive increase in insulin secretion by the pancreatic β cells (Kahn et al. 1993). The DEX rats in the present study became insulin resistant after the dexamethasone treatment but remained normoglycaemic under fasting conditions. This condition is expected when compensatory insulin hypersecretion and hyperinsulinaemia develop adaptively in response to an increased metabolic insulin requirement, as in other IR-related diseases (obesity and metabolic syndrome) (Weir & Bonner-Weir 2004; Kahn et al. 2006). However, mild glucose intolerance was also observed in these rats during the ipGTT experiment, which indicated that, for supraphysiological challenges, in vivo insulin secretion and peripheral insulin action do not guarantee a precise regulation of glucose homeostasis culminating in the transient elevation of blood glucose levels (60 and 90 min postglucose challenge). Although these rats secreted more insulin in response to subphysiological (2.8 mM) and stimulatory (16.7 mM) glucose concentrations, an increase in glucose from 2.8 to 16.7 mM did not produce a more pronounced insulin increase in the DEX rat islets compared with the CTL rat islets, indicating a relative impairment in β cell function in the DEX group. Similar findings also been observed in previous studies of dexamethasone-treated rats (Holness et al. 2005), which highlights the diabetogenic effects of excessive GCs.
Interestingly, the dexamethasone treatment caused parotid and submandibular gland hypotrophy, as suggested by the 29% and 16% reductions in the mass of the parotid and submandibular glands, respectively, of the DEX group compared with the CTL group. Extensive histomorphometric analyses of acinar, duct and stromal cells revealed that the marked reduction in the parotid mass was due to a 56% reduction in the absolute volume of the acinar cells. The reduction in the volume of acinar cells from the parotid glands of the DEX rats was the result of decreased cytoplasmic volume, rather than an alteration in the total number of acinar cells. The volume of the acinar cells in the submandibular glands of the DEX group was significantly decreased; however, no alteration was observed in the total acinar volume, which was explained by the compensatory increase in the total number of acinar cells. Thus, the reduction in the submandibular glandular mass was due to the decreased total volume of stroma. Our results are in accordance with a previous study in which the administration of dexamethasone (100 μg/kg b.w.) for 8 consecutive days caused a significant reduction in the parotid gland mass in normal rats (Johnson et al. 1987a,b). These authors also observed a marked 75% reduction in the volume of parotid salivary fluid released in response to parasympathetic pilocarpine and sympathetic isoproterenol agonists. Clinical evidence also argues in favour of the negative impact of GCs on salivary secretion. Older people (aged 65–95 years) receiving medications including GCs exhibited oral and ocular dryness, which are associated with low salivary flow rates (Smidt et al. 2011). Undesirable effects of GCs on salivary flow have also been observed in asthmatic children (aged 7–17 years). After one month of a twice-daily combination of 50 μg of the β2 agonist salmeterol and 100 μg of fluticasone propionate, the patients exhibited reduced salivary flow rates and increased dental plaque index on the buccal surface compared with baseline values (Sag et al. 2007). We suggest that dexamethasone-induced parotid and submandibular hypotrophy, which is accompanied by a reduced salivary flow rate, may collaborate to impair the quality and quantity of saliva produced by the parotid glands, as demonstrated by others (Johnson et al. 1987a,b; Sag et al. 2007).
During IR states, such as those induced by GCs, insulin-sensitive tissues (e.g. skeletal muscle, liver and white adipose tissue) become less responsive to insulin (Saad et al. 1993; Buren et al. 2008). Salivary glands are also responsive to insulin, as previously demonstrated (Rocha et al. 2000). Thus, we explored the phosphorylated and total contents of a pivotal insulin-responsive kinase, the serine-threonine kinase PKB, in the parotid glands of the DEX rats. Neither the phosphorylated nor the total PKB contents in the parotid and submandibular glands of the DEX rats differed from those of the CTL rats. However, we analysed basal PKB phosphorylation; thus, we cannot exclude the possibility that in a stimulatory situation, for example under insulin stimulation, the phosphorylation of salivary PKB might be attenuated in our DEX rats. Additional functional and molecular studies concerning insulin signalling in salivary glands are warranted to explore this question. The protein contents of the pro-apoptotic Bax and the anti-apoptotic Bcl-2 proteins were also unchanged in the parotid and submandibular glands of the DEX group compared with the CTL group, although a tendency towards an increased Bax-to-Bcl-2 protein ratio was observed in the parotid glands. These protein data do not support increased acinar apoptosis; rather, they are in accordance with the unchanged total number of acinar cells in the parotid glands of the DEX rats and reinforce the theory that the reduced acinar volume in the DEX group was due to acinar hypotrophy instead of acinar hypoplasia. Future studies of the precise mechanisms underlying this structural alteration of acinar cells induced by GC treatment warrant additional investigation.
In conclusion, our data provide clear evidence that dexamethasone-induced IR is associated with significant reductions in the mass of the parotid and submandibular glands, which are accompanied by a reduced salivary flux rate in rats. This reduction is caused by acinar and stromal hypotrophy and does not involve acinar hypoplasia. The precise mechanisms by which this structural alteration occurs require additional exploration, including in man; however, our data emphasize that GC-based therapies and IR states have a negative impact on salivary gland homeostasis.
Acknowledgments
We appreciate the support of Bauru School of Dentistry, University of São Paulo – USP, Bauru, as well as the School of Sciences, São Paulo State University – UNESP, Bauru. A. Rafacho is supported by grants from the Brazilian foundations CNPq and the Instituto Nacional de Ciência e Tecnologia: Obesidade e Diabetes.
References
- Ahern WA, Dunnil MS. Morphometry. London: Edward Arnold Publishers Ltd; 1982. [Google Scholar]
- Angelini N, Rafacho A, Boschero AC. Bosqueiro JR. Involvement of the cholinergic pathway in glucocorticoid-induced hyperinsulinemia in rats. Diabetes Res. Clin. Pract. 2010;87:184–191. doi: 10.1016/j.diabres.2009.11.008. [DOI] [PubMed] [Google Scholar]
- Asl Aminabadi N, Najafpour E, Razavi Rohani Z, Sighari Deljavan A, Ghojazadeh M, Jamali Z. Linear reciprocal interaction between dental caries and salivary characteristics. J. Oral Sci. 2013;55:337–342. doi: 10.2334/josnusd.55.337. [DOI] [PubMed] [Google Scholar]
- Baschant U. Tuckermann J. The role of the glucocorticoid receptor in inflammation and immunity. J. Steroid Biochem. Mol. Biol. 2010;120:69–75. doi: 10.1016/j.jsbmb.2010.03.058. [DOI] [PubMed] [Google Scholar]
- Benguigui C, Bongard V, Ruidavets JB, et al. Metabolic syndrome, insulin resistance, and periodontitis: a cross-sectional study in a middle-aged French population. J. Clin. Periodontol. 2010;37:601–608. doi: 10.1111/j.1600-051X.2010.01571.x. [DOI] [PubMed] [Google Scholar]
- Buren J, Lai YC, Lundgren M, Eriksson JW. Jensen J. Insulin action and signalling in fat and muscle from dexamethasone-treated rats. Arch. Biochem. Biophys. 2008;474:91–101. doi: 10.1016/j.abb.2008.02.034. [DOI] [PubMed] [Google Scholar]
- Demmer RT, Squillaro A, Papapanou PN, et al. Periodontal infection, systemic inflammation, and insulin resistance: results from the continuous National Health and Nutrition Examination Survey (NHANES) 1999-2004. Diabetes Care. 2012;35:2235–2242. doi: 10.2337/dc12-0072. [DOI] [PMC free article] [PubMed] [Google Scholar]
- Dodds MW, Johnson DA. Yeh CK. Health benefits of saliva: a review. J. Dent. 2005;33:223–233. doi: 10.1016/j.jdent.2004.10.009. [DOI] [PubMed] [Google Scholar]
- Drakulic D, Velickovic N, Stanojlovic M, et al. Low-dose dexamethasone treatment promotes the pro-survival signalling pathway in the adult rat prefrontal cortex. J. Neuroendocrinol. 2013;25:605–616. doi: 10.1111/jne.12037. [DOI] [PubMed] [Google Scholar]
- Giozzet VA, Rafacho A, Boschero AC, Carneiro EM. Bosqueiro JR. Dexamethasone treatment in vivo counteracts the functional pancreatic islet alterations caused by malnourishment in rats. Metabolism. 2008;57:617–624. doi: 10.1016/j.metabol.2007.12.004. [DOI] [PubMed] [Google Scholar]
- Holness MJ, Smith ND, Greenwood GK. Sugden MC. Interactive influences of peroxisome proliferator-activated receptor alpha activation and glucocorticoids on pancreatic beta cell compensation in insulin resistance induced by dietary saturated fat in the rat. Diabetologia. 2005;48:2062–2068. doi: 10.1007/s00125-005-1894-0. [DOI] [PubMed] [Google Scholar]
- Johnson DA. Effect of a liquid diet on the protein composition of rat parotid saliva. J. Nutr. 1982;112:175–181. doi: 10.1093/jn/112.1.175. [DOI] [PubMed] [Google Scholar]
- Johnson DA, Alvares OF, Etzel KR. Kalu DN. Regulation of salivary proteins. J. Dent. Res. 1987a;66:576–582. doi: 10.1177/00220345870660023201. [DOI] [PubMed] [Google Scholar]
- Johnson DA, Etzel KR, Alvares OF. Cortez JE. Regulation of parotid salivary proteins by glucocorticoids. J. Dent. Res. 1987b;66:1563–1568. doi: 10.1177/00220345870660101001. [DOI] [PubMed] [Google Scholar]
- Kahn SE, Prigeon RL, McCulloch DK, et al. Quantification of the relationship between insulin sensitivity and beta-cell function in human subjects. Evidence for a hyperbolic function. Diabetes. 1993;42:1663–1672. doi: 10.2337/diab.42.11.1663. [DOI] [PubMed] [Google Scholar]
- Kahn SE, Hull RL. Utzschneider KM. Mechanisms linking obesity to insulin resistance and type 2 diabetes. Nature. 2006;444:840–846. doi: 10.1038/nature05482. [DOI] [PubMed] [Google Scholar]
- Katz J, Bhattacharyya I, Farkhondeh-Kish F, Perez FM, Caudle RM. Heft MW. Expression of the receptor of advanced glycation end products in gingival tissues of type 2 diabetes patients with chronic periodontal disease: a study utilizing immunohistochemistry and RT-PCR. J. Clin. Periodontol. 2005;32:40–44. doi: 10.1111/j.1600-051X.2004.00623.x. [DOI] [PubMed] [Google Scholar]
- Lannan EA, Galliher-Beckley AJ, Scoltock AB. Cidlowski JA. Proinflammatory actions of glucocorticoids: glucocorticoids and TNFalpha coregulate gene expression in vitro and in vivo. Endocrinology. 2012;153:3701–3712. doi: 10.1210/en.2012-1020. [DOI] [PMC free article] [PubMed] [Google Scholar]
- Llena-Puy C. The role of saliva in maintaining oral health and as an aid to diagnosis. Med. Oral Patol. Oral Cir. Bucal. 2006;11:E449–E455. [PubMed] [Google Scholar]
- Lo S, Russell JC. Taylor AW. Determination of glycogen in small tissue samples. J. Appl. Physiol. 1970;28:234–236. doi: 10.1152/jappl.1970.28.2.234. [DOI] [PubMed] [Google Scholar]
- Mata AD, Marques D, Rocha S, et al. Effects of diabetes mellitus on salivary secretion and its composition in the human. Mol. Cell. Biochem. 2004;261:137–142. doi: 10.1023/b:mcbi.0000028748.40917.6f. [DOI] [PubMed] [Google Scholar]
- Mozaffari MS, Abdelsayed R, Zakhary I, et al. Submandibular gland and caries susceptibility in the obese Zucker rat. J. Oral Pathol. Med. 2011;40:194–200. doi: 10.1111/j.1600-0714.2010.00965.x. [DOI] [PMC free article] [PubMed] [Google Scholar]
- Picco DC, Costa LF, Delbem AC, Sassaki KT, Sumida DH. Antoniali C. Spontaneously hypertensive rat as experimental model of salivary hypofunction. Arch. Oral Biol. 2012;57:1320–1326. doi: 10.1016/j.archoralbio.2012.07.008. [DOI] [PubMed] [Google Scholar]
- Preethi BP, Reshma D. Anand P. Evaluation of flow rate, pH, buffering capacity, calcium, total proteins and total antioxidant capacity levels of saliva in caries free and caries active children: an in vivo study. Indian J. Clin. Biochem. 2010;25:425–428. doi: 10.1007/s12291-010-0062-6. [DOI] [PMC free article] [PubMed] [Google Scholar]
- Rafacho A, Giozzet VA, Boschero AC. Bosqueiro JR. Functional alterations in endocrine pancreas of rats with different degrees of dexamethasone-induced insulin resistance. Pancreas. 2008a;36:284–293. doi: 10.1097/MPA.0b013e31815ba826. [DOI] [PubMed] [Google Scholar]
- Rafacho A, Ribeiro DL, Boschero AC, Taboga SR. Bosqueiro JR. Increased pancreatic islet mass is accompanied by activation of the insulin receptor substrate-2/serine-threonine kinase pathway and augmented cyclin D2 protein levels in insulin-resistant rats. Int. J. Exp. Pathol. 2008b;89:264–275. doi: 10.1111/j.1365-2613.2008.00588.x. [DOI] [PMC free article] [PubMed] [Google Scholar]
- Rafacho A, Cestari TM, Taboga SR, Boschero AC. Bosqueiro JR. High doses of dexamethasone induce increased beta-cell proliferation in pancreatic rat islets. Am. J. Physiol. Endocrinol. Metab. 2009;296:E681–E689. doi: 10.1152/ajpendo.90931.2008. [DOI] [PubMed] [Google Scholar]
- Rafacho A, Quallio S, Ribeiro DL, et al. The adaptive compensations in endocrine pancreas from glucocorticoid-treated rats are reversible after the interruption of treatment. Acta. Physiol. (Oxf) 2010;200:223–235. doi: 10.1111/j.1748-1716.2010.02146.x. [DOI] [PubMed] [Google Scholar]
- Rafacho A, Abrantes JL, Ribeiro DL, et al. Morphofunctional alterations in endocrine pancreas of short- and long-term dexamethasone-treated rats. Horm. Metab. Res. 2011;43:275–281. doi: 10.1055/s-0030-1269896. [DOI] [PubMed] [Google Scholar]
- Revollo JR. Cidlowski JA. Mechanisms generating diversity in glucocorticoid receptor signaling. Ann. N. Y. Acad. Sci. 2009;1179:167–178. doi: 10.1111/j.1749-6632.2009.04986.x. [DOI] [PubMed] [Google Scholar]
- Rocha EM, de M Lima MH, Carvalho CR, Saad MJ, Velloso LA. Characterization of the insulin-signaling pathway in lacrimal and salivary glands of rats. Curr. Eye Res. 2000;21:833–842. doi: 10.1076/ceyr.21.5.833.5535. [DOI] [PubMed] [Google Scholar]
- Saad MJ, Folli F, Kahn JA. Kahn CR. Modulation of insulin receptor, insulin receptor substrate-1, and phosphatidylinositol 3-kinase in liver and muscle of dexamethasone-treated rats. J. Clin. Invest. 1993;92:2065–2072. doi: 10.1172/JCI116803. [DOI] [PMC free article] [PubMed] [Google Scholar]
- Sag C, Ozden FO, Acikgoz G. Anlar FY. The effects of combination treatment with a long-acting beta2-agonist and a corticosteroid on salivary flow rate, secretory immunoglobulin A, and oral health in children and adolescents with moderate asthma: a 1-month, single-blind clinical study. Clin. Ther. 2007;29:2236–2242. doi: 10.1016/j.clinthera.2007.10.014. [DOI] [PubMed] [Google Scholar]
- Sagulin GB. Roomans GM. Effects of thyroxine and dexamethasone on rat submandibular glands. J. Dent. Res. 1989;68:1247–1251. doi: 10.1177/00220345890680080701. [DOI] [PubMed] [Google Scholar]
- Schmidt AM, Weidman E, Lalla E, et al. Advanced glycation endproducts (AGEs) induce oxidant stress in the gingiva: a potential mechanism underlying accelerated periodontal disease associated with diabetes. J. Periodontal Res. 1996;31:508–515. doi: 10.1111/j.1600-0765.1996.tb01417.x. [DOI] [PubMed] [Google Scholar]
- Sesso A. Taga R. Avaliação do número de células de órgãos pela dosagem bioquímica de DNA em homogeneizados por contagem direta através de métodos morfométricos. Ciência e Cultura. 1978;30:1232–1936. [Google Scholar]
- da Silva MC. Análise da expressão de citocinas e dos receptores RAGE no periodonto de ratos diabéticos. In: de Assis GF, editor. Estomatologia e Biologia Oral. Bauru: Faculdade de Odontologia de Bauru; 2003. p. 223. [Google Scholar]
- Smidt D, Torpet LA, Nauntofte B, Heegaard KM. Pedersen AM. Associations between oral and ocular dryness, labial and whole salivary flow rates, systemic diseases and medications in a sample of older people. Community Dent. Oral Epidemiol. 2011;39:276–288. doi: 10.1111/j.1600-0528.2010.00588.x. [DOI] [PubMed] [Google Scholar]
- Sreebny LM. Schwartz SS. A reference guide to drugs and dry mouth–2nd edition. Gerodontology. 1997;14:33–47. doi: 10.1111/j.1741-2358.1997.00033.x. [DOI] [PubMed] [Google Scholar]
- Tavoni TM, Obici S, de Castro RMA, Minguetti-Camara VC, Curi R. Bazotte RB. Evaluation of liver glycogen catabolism during hypercortisolism induced by the administration of dexamethasone in rats. Pharmacol. Rep. 2013;65:144–151. doi: 10.1016/s1734-1140(13)70972-1. [DOI] [PubMed] [Google Scholar]
- Taylor JJ, Preshaw PM. Lalla E. A review of the evidence for pathogenic mechanisms that may link periodontitis and diabetes. J. Periodontol. 2013;84:S113–S134. doi: 10.1902/jop.2013.134005. [DOI] [PubMed] [Google Scholar]
- Timonen P, Suominen-Taipale L, Jula A, Niskanen M, Knuuttila M. Ylostalo P. Insulin sensitivity and periodontal infection in a non-diabetic, non-smoking adult population. J. Clin. Periodontol. 2011;38:17–24. doi: 10.1111/j.1600-051X.2010.01642.x. [DOI] [PubMed] [Google Scholar]
- Tsai C, Hayes C. Taylor GW. Glycemic control of type 2 diabetes and severe periodontal disease in the US adult population. Community Dent. Oral Epidemiol. 2002;30:182–192. doi: 10.1034/j.1600-0528.2002.300304.x. [DOI] [PubMed] [Google Scholar]
- Weibel ER. Stereological principles for morphometry in electron microscopic cytology. Int. Rev. Cytol. 1969;26:235–302. doi: 10.1016/s0074-7696(08)61637-x. [DOI] [PubMed] [Google Scholar]
- Weir GC. Bonner-Weir S. Five stages of evolving beta-cell dysfunction during progression to diabetes. Diabetes. 2004;53(Suppl 3):S16–S21. doi: 10.2337/diabetes.53.suppl_3.s16. [DOI] [PubMed] [Google Scholar]
- Willi SM, Kennedy A, Wallace P, Ganaway E, Rogers NL. Garvey WT. Troglitazone antagonizes metabolic effects of glucocorticoids in humans: effects on glucose tolerance, insulin sensitivity, suppression of free fatty acids, and leptin. Diabetes. 2002;51:2895–2902. doi: 10.2337/diabetes.51.10.2895. [DOI] [PubMed] [Google Scholar]
- Zalewska A, Knas M, Niczyporuk M, et al. Salivary lysosomal exoglycosidases profiles in patients with insulin-dependent and noninsulin-dependent diabetes mellitus. Adv. Clin. Exp. Med. 2013;22:659–666. [PubMed] [Google Scholar]