

Abstract
Aims/Introduction
We aimed to examine the effect of an angiotensin II receptor blocker (ARB), a peroxisome proliferator‐activated receptor (PPAR)‐gamma agonist, and their combination on myocardial fibrosis and function in type 2 diabetic rats.
Materials and Methods
Five male Long‐Evans Tokushima Otsuka (LETO) rats and 20 male Otsuka Long‐Evans Tokushima Fatty (OLETF) rats were used. OLETF rats were assigned to four groups (n = 5 per group) at 28 weeks‐of‐age: untreated, losartan‐treated, rosiglitazone‐treated and combination‐treated. The ARB, losartan, was administered at a dose of 5 mg/kg/day, and the PPAR‐gamma agonist, rosiglitazone, was administered at a dose of 3 mg/kg/day by oral gavage for 12 weeks. Urine and blood samples were collected, and two‐dimensional echocardiograms and strain rate imaging were obtained at 28 and 40 weeks. Cytokines were evaluated by reverse transcriptase polymerase chain reaction, and histological analysis was carried out at 40 weeks.
Results
At 40 weeks, the global radial strains of the losartan‐treated (55.7 ± 4.5%, P = 0.021) and combination‐treated groups (59.3 ± 6.7%, P = 0.001) were significantly higher compared with the untreated OLETFs (44.3 ± 10.5%). No difference was observed when compared with LETO rats. Although the rosiglitazone‐treated group showed a better metabolic profile than the untreated OLETF group, there was no difference in the global radial strain (49.8 ± 6.0 vs 44.3 ± 10.5, P = 0.402). The expression of pro‐inflammatory cytokines, and collagen type I and III were consistently attenuated in the losartan‐treated and combination‐treated OLETF groups, but not in the rosiglitazone‐treated group.
Conclusions
A combination of rosiglitazone and losartan attenuates myocardial fibrosis and dysfunction in type 2 diabetic rats.
Keywords: Angiotensin II receptor blocker, Diabetic cardiomyopathy, Peroxisome proliferator‐activated receptor‐gamma agonist
Introduction
Patients with diabetes mellitus (DM) are characterized by an increased likelihood of heart failure1. The mechanisms of myocardial dysfunction in diabetic patients are multifactorial, and include metabolic disturbances, myocardial fibrosis, small vessel disease (so‐called microangiopathy), autonomic dysfunction and insulin resistance2. Albuminuria reflects a renal and systemic transvascular albumin leakage; therefore, it has been considered as a marker of microangiopathy3. Cardiac and vascular complications progress two‐ to 10‐fold faster in patients with microalbuminuria or proteinuria compared with subjects with normal albumin secretion4. Diabetic myocardial dysfunction is more frequently observed in patients with microalbuminuria8. Furthermore, the degree of albuminuria is closely related to the severity of myocardial dysfunction in type 2 diabetes13. The microangiopathic complications of DM usually have a prolonged, asymptomatic phase characterized by early subclinical functional and structural abnormalities. These complications often go undiagnosed until they present as overt heart and renal failure. Therefore, early detection and medical intervention are important clinical issues.
The renin–angiotensin aldosterone system plays an essential role in the pathophysiology of diabetes‐related complications14. Angiotensin II receptor blockers (ARBs) can slow microvascular complications of DM, and prevent myocardial dysfunction or fibrosis15. Peroxisome proliferator‐activated receptor (PPAR)‐gamma agonists have a well‐established therapeutic role for treating type 2 diabetes. PPAR‐gamma agonists show favorable metabolic effects, and can attenuate microalbuminuria in these patients18. However, they also cause fluid retention, thereby increasing the risk of heart failure19. Because ARBs and PPAR‐gamma agonists are commonly used in combination, it is important to clarify the combinatorial effects these two drugs have on myocardial and renal microangiopathies.
The Ostuka Long‐Evans Tokushima Fatty (OLETF) rat is a useful animal model that manifests clinical and pathological features of DM resembling those of human type 2 diabetes20. The Long‐Evans Tokushima Otsuka (LETO) rats are lean, non‐diabetic control rats that have been established from the same original colony as the OLETF rat20. It has been shown that overt diabetes in the OLETF rats develops at approximately 20–28 weeks‐of‐age20. Furthermore, the metabolic abnormalities and the alteration in LV function become more prominent at approximately 28 weeks‐of‐age21. Therefore, using the OLETF rats at 28 weeks‐of‐age, we investigate the effects of rosiglitazone (a PPAR‐gamma agonist) and losartan (an ARB) on myocardial function, structural changes in the myocardium and microvasculature, and the association between these drugs and the degree of microalbuminuria.
Materials and Methods
Experimental Animals
All procedures were in accordance with institutional guidelines for animal research. A total of 20 male OLETF rats, which are established as spontaneously long‐term hyperglycemic rats with type 2 diabetes, and five male LETO rats aged 4 weeks were obtained from the Tokushima Research Institute of Otsuka Pharmaceutical Co. (Japan). All animals were maintained in an animal facility with ventilation, controlled temperature (22 ± 2°C), and a 12‐h light/dark cycle (lights on at 08.00 hours). Animals were housed in plastic cages (n = 2 per cage), and were fed ad libitum with standard chow diet and tap water.
OLETF rats were randomly divided into four groups (n = 5 per group) at 28 weeks‐of‐age, and treated with vehicle (untreated OLETF, n = 5); an ARB (OLETF rats treated with losartan, n = 5); a PPAR‐gamma agonist (OLETF rats treated with rosiglitazone, n = 5); or a combination of both drugs (OLETF rats treated with losartan and rosiglitazone, n = 5). LETO rats were treated with vehicle (untreated LETO, n = 5). The ARB, losartan (Merck & Co., Readington Township, NJ, USA) was given at the dose of 5 mg/kg bodyweight per day by oral gavage. The PPAR‐gamma agonist, rosiglitazone (GlaxoSmithKline plc., London, UK) was given at the dose of 3 mg/kg bodyweight per day, also by oral gavage for a subsequent 12 weeks.
Blood Chemistry and Urinalysis
Urine samples and blood samples were collected at 28 and 40 weeks‐of‐age. Samples were collected in metabolic cages. At the end of the experimental period (at 40 weeks‐of‐age), the animals were anesthetized, and the trunk blood was collected to measure serological parameters. Plasma glucose levels were measured using the glucose oxidase method. Plasma insulin concentrations were measured by a radioimmunoassay using a double‐antibody method. Total plasma cholesterol, triglyceride, high‐density lipoprotein and low‐density lipoprotein levels were measured by an enzymatic colorimetric method. For measuring fasting plasma glucose levels and plasma insulin concentrations, blood samples were obtained after overnight fasting.
Reverse Transcription Polymerase Chain Reaction
Isolation of Total Ribonucleic Acid
Total ribonucleic acid (RNA) was extracted by 500 μL/60‐mm plate Tri‐reagent (Sigma, St. Louis, MO, USA). Approximately 100 μL of chloroform was added to the Tri‐reagent. The sample was vortexed for approximately 10 s. The sample was then centrifuged at 12,000 g at 4°C for 15 min. Three layers appeared in the tube. The transparent upper layer was collected into a new tube. Approximately 250 μL 2‐propanol was poured over the sample followed by 30 s of vortexing. This sample was centrifuged at 12,000 g at 4°C for 10 min. The supernatant was discarded. The remaining pellet was washed with 75% ethanol (Duksan, Seoul, Korea) and mixed with diethylpyrocarbonate (DEPC; Sigma) water. This sample was centrifuged at 7,500 g at 4°C for 5 min. The supernatant was discarded, and the pellet was dried at room temperature for approximately 7 min. Finally, 30 μL of nuclease‐free water was added to the pellet. The quality and quantity of the RNA were determined by OD260/OD280 on a DU 640 spectrophotometer (Effendorf, Hamburg, Germany.)
Complementary Deoxyribonucleic Acid Synthesis
Complementary deoxyribonucleic (cDNA) was synthesized with RT‐&GOTM (MPbio, Eschwege, Germany). Then, 1 μg of total RNA was added to 1 μL anchored primer (dT)25V, 2 μL dithiothreitol and 6 μL of nuclease‐free water (9 μL total). To prevent secondary structures, the mixture was incubated for 5 min at 70°C, and 8 μL RT‐&GOTM mastermix was added. The sample was incubated at 42°C for 1 h. At the conclusion, the reverse transcriptase was inactivated at 70°C for 15 min. cDNA quality and quantity were determined by OD260/OD280 with a DU 640 spectrophotometer.
Polymerase Chain Reaction Analysis
One microgram of cDNA, 10 pmol/L primer of each primer (forward and reverse; Table 1), 0.1 mmol/L deoxynucleotide (dNTP) mixture, 1.25 U of Taq polymerase and 10 × reaction buffer were mixed with nuclease‐free water to a total volume of 25 μL. The polymerase chain reaction (PCR) conditions were fixed as follows: a cycle of denaturing at 94°C for 3 min, followed by 35 cycles of: denaturation at 94°C for 30 s, annealing at 48–60°C for 30 s and elongation at 72°C for 30 s. The sample was the kept at 72°C for 10 min. When the PCR assay finished, the PCR product was separated by electrophoresis on a 1.2% agarose gel (Biorad, Hercules, CA, USA), and visualized on a Gel‐Doc (Biorad) system after staining with ethidium bromide (EtBr; Sigma).
Table 1. Primer sequences for reverse transcription polymerase chain reaction analysis.
| Primer | Sequence (5′ → 3′) | Primer | Sequence (5′ → 3′) |
|---|---|---|---|
| IL‐1β | TGACCCATGTGAGCTGAAAG | IL‐6 | GACTGATGTTGTTGACAGCCACTGC |
| AGGGATTTTGTCGTTGCTTG | TAGCCACTCCTTCTGTGACTCTAACT | ||
| TGF‐β | CTTCAGCTCCACAGAGAAGAACTGC | TNF‐α | GTAGCCCACGTCGTAGCAAA |
| CACGATCATGTTGGACAACTGCTCC | CCCTTCTCCAGCTGGGAGAC | ||
| 18s rRNA | GTCCCCCAACTTCTTAGAG | ||
| CACCTACGGAAACCTTGTTAC |
IL, interleukin; rRNA, ribosomal ribonucleic acid; TGF, transforming growth factor; TNF, tumor necrosis factor.
Histological Examination
At the end of the experimental period (at 40 weeks‐of‐age), hearts were rapidly excised and weighed after exsanguination. The heart was perfusion‐fixed with 10% (v/v) neutral buffered formaldehyde for 24 h, transversely sectioned into four 5‐μm thick sections and embedded in paraffin by routine methods. Sections were mounted on gelatin‐coated glass slides to ensure different stains could be used on successive sections. After deparaffinization and rehydration, the sections were stained with Masson's trichrome staining to assess cytological details, such as interstitial fibrosis. Interstitial fibrosis area was measured with MetaMorph software version 4.6 (Universal Imaging Corp., Downingtown, PA, USA).
Immunohistochemistry for Collagens
Histological analysis was carried out according to the instructions of the manufacturer (R.T.U VECTASTAIN Universal Quick Kit; Vector Laboratories, Inc., Burlingame, CA). In brief, the excised heart tissues were fixed in 3.7% buffered formaldehyde and embedded in paraffin. Tissue sections, 5‐μm thick, were deparaffinized, rehydrated and rinsed with phosphate‐buffered solution. Sodium citrate antigen retrieval was carried out in 10 mmol/L sodium citrate (pH 6.0) in a microwave for 10 min. Sections were incubated in 3% H2O2 in order to quench endogenous peroxidase. The sample was blocked in 2.5% normal horse serum, and incubated in primary antibodies (anti‐type I collagen 1:100: Southern Biotechnology Associates Inc., Birmingham, AL, USA; anti‐type III collagen antibody: Biogenex, San Ramon, CA, USA). Heart sections were treated with biotinylated pan‐specific universal secondary antibody and streptavidin/peroxidase complex reagent. Using a DAB substrate kit, the heart sections were stained with antibody. Sections were counterstained with 1% methyl green, and dehydrated with 100% N‐butanol (Duksan), ethanol and xylene (Duksan).
Evaluation of Cardiac Function
Two‐Dimensional Echocardiography
Transthoracic echocardiographic studies were carried out on a GE Vivid 7 ultrasound machine (GE Medical System, Schenectady, NY, USA) with a 10.0‐MHz transducer at 28 weeks‐of‐age (before randomization of groups) and at 40 weeks‐of‐age (at the end of the experimental period) by an experienced cardiologist who was blinded to all groups. The rats were anesthetized with inhaled isoflurane. The chest was shaved, and the rats were placed in the left lateral decubitus position. The transducer was placed on the left hemithorax, and short axis views were recorded. Two‐dimensional images were obtained at the mid‐papillary level. An M‐mode tracing of left ventricular (LV) contraction was also obtained at the same level as the short‐axis view. The LV end diastolic dimension and LV end systolic dimension were measured by M‐mode tracing. These parameters allowed the LV fractional shortening and ejection fraction to be calculated. Two images were obtained in each view, and each parameter was measured in each of three consecutive beats per image. Six values of each parameter were measured, and the average was recorded.
Strain and Strain Rate Imaging
Echocardiographic images were stored digitally and analyzed offline with EchoPAC 6.3.0 software (GE Vigmed, Horten, Norway). More than three images were obtained in the short axis view at the mid‐LV level, and the parameters were measured in each of three consecutive beats per image. The peak radial systolic strain and systolic strain rates at six segments (anteroseptum, anterior, anterolateral, posterolateral, inferior and inferoseptum) were analyzed. For quantitative analysis of global LV systolic function, the average values from six segments of the LV were calculated.
Statistical Analysis
Values are expressed as mean ± standard deviation. One way‐analysis of variance followed by Tukey's test for multiple comparisons was used to compare experimental groups. A P‐value <0.05 was considered significant. Statistical analysis was carried out using spss 13.0 software (SPSS, Chicago, IL, USA).
Results
Body and Heart Weight
The OLETF rats showed a significantly higher bodyweight compared with the LETO rats at both 28 and 40 weeks‐of‐age. The bodyweight of the OLETF rats treated with rosiglitazone was higher than the three other OLETF groups. This difference might be explained by rosiglitazone‐induced weight gain. There were no significant differences in either the heart weight or LV/heart weight ratio among groups (Table 2).
Table 2. Data of bodyweight and heart weight at baseline and after treatment.
| LETO (n = 5) | OLETF (n = 20) | ||||
|---|---|---|---|---|---|
| Control (n = 5) | LOS (n = 5) | ROS (n = 5) | LOS + ROS (n = 5) | ||
| Bodyweight (g) | |||||
| At 28 weeks | 504 ± 14 | 548 ± 14* | 552 ± 37* | 549 ± 25* | 561 ± 38* |
| At 40 weeks | 511 ± 31 | 616 ± 40* | 571 ± 27*,† | 645 ± 42*,† | 612 ± 31* |
| Changes | 7 ± 7 | 67 ± 25* | 20 ± 13*,† | 97 ± 22*,† | 51 ± 30* |
| Heart weight (gram) | 2.0 ± 0.1 | 2.0 ± 0.1 | 2.1 ± 0.1 | 2.4 ± 0.1 | 2.3 ± 0.2 |
| LV/heart weight | 0.7 ± 0.0 | 0.7 ± 0.1 | 0.7 ± 0.0 | 0.7 ± 0.1 | 0.7 ± 0.1 |
LOS, Otsuka Long‐Evans Tokushima Fatty rats treated with losartan; LOS + ROS, Otsuka Long‐Evans Tokushima Fatty rats treated with losartan and rosiglitazone; LV, left ventricular; OLETF, Otsuka Long‐Evans Tokushima Fatty rats; ROS, Otsuka Long‐Evans Tokushima Fatty rats treated with rosiglitazone. *P < 0.05, compared with the untreated Long‐Evans Tokushima Otsuka (LETO) rats. †P < 0.05, compared with controls.
Plasma Glucose, Insulin and Degree of Albuminuria
The OLETF rats showed elevated fasting glucose levels, fasting insulin levels and urine albumin/creatinine ratios compared with the LETO rats. This difference was apparent at both 28 and 40 weeks‐of‐age. There were no significant differences in these serological and urinary parameters among the groups of OLETF rats at 28 weeks. At 40 weeks, favorable metabolic profiles were observed in the rosiglitazone group and in the combination group compared with the untreated or the losartan group. The losartan‐treated and the combination drug‐treated OLETF rats showed a significant attenuation in the progression of albuminuria. The rosiglitazone group also had a lower level of urine albumin compared with the untreated group, but the degree of albuminuria was higher than the losartan‐treated or combination drug‐treated group (Table 3).
Table 3. Data of plasma glucose, insulin, lipids and urine albumin/creatinine ratio at baseline and after treatment.
| LETO (n = 5) | OLETF (n = 20) | ||||
|---|---|---|---|---|---|
| Control (n = 5) | LOS (n = 5) | ROS (n = 5) | LOS + ROS (n = 5) | ||
| At 28 weeks | |||||
| Glucose (mg/dL) | 92 ± 12 | 124 ± 20* | 126 ± 17* | 129 ± 25* | 128 ± 21* |
| Insulin (ng/mL) | 1.9 ± 0.8 | 6.1 ± 1.9* | 5.9 ± 1.0* | 6.9 ± 2.6* | 5.9 ± 1.3* |
| Total Chol (mg/dL) | 93 ± 5 | 102 ± 11 | 99 ± 13 | 104 ± 15 | 102 ± 10 |
| Triglyceride (mg/dL) | 21 ± 10 | 33 ± 15 | 31 ± 14 | 33 ± 17 | 32 ± 9 |
| HDL Chol (mg/dL) | 25 ± 4 | 25 ± 9 | 24 ± 7 | 24 ± 8 | 25 ± 6 |
| LDL Chol (mg/dL) | 14 ± 1 | 17 ± 2 | 16 ± 3 | 17 ± 3 | 15 ± 1 |
| Urine Alb (mg/dL) | 0.3 ± 0.2 | 0.7 ± 0.3* | 0.9 ± 0.5* | 0.8 ± 0.5* | 0.7 ± 0.4* |
| Urine Cr (mg/dL) | 88 ± 45 | 97 ± 81 | 114 ± 54 | 118 ± 61 | 94 ± 75 |
| Urine Alb/Cr | 3.4 ± 0.7 | 7.8 ± 8.8* | 7.9 ± 4.2* | 6.8 ± 3.8* | 7.4 ± 5.0* |
| At 40 weeks | |||||
| Glucose (mg/dL) | 103 ± 12 | 161 ± 31* | 153 ± 23* | 130 ± 30*,† | 129 ± 18*,† |
| Insulin (ng/mL) | 2.4 ± 1.0 | 9.8 ± 3.0* | 7.0 ± 1.6* | 4.6 ± 2.6† | 3.8 ± 1.0† |
| Total Chol (mg/dL) | 93 ± 5 | 98 ± 18 | 103 ± 4 | 104 ± 13 | 101 ± 13 |
| Triglyceride (mg/dL) | 21 ± 10 | 112 ± 25 | 55 ± 17 | 39 ± 17 | 35 ± 4 |
| HDL Chol (mg/dL) | 25 ± 4 | 24 ± 2 | 23 ± 5 | 27 ± 9 | 22 ± 2 |
| LDL Chol (mg/dL) | 14 ± 1 | 23 ± 6 | 18 ± 1 | 18 ± 2 | 16 ± 3 |
| Urine Alb (mg/dL) | 0.5 ± 0.1 | 8.2 ± 0.8* | 4.8 ± 0.2* | 4.5 ± 1.3* | 3.6 ± 0.1* |
| Urine Cr (mg/dL) | 95 ± 81 | 168 ± 47 | 178 ± 172 | 120 ± 120 | 109 ± 98 |
| Urine Alb/Cr | 5.4 ± 2.8 | 77.4 ± 58.1* | 32.0 ± 12.9*,† | 45.9 ± 72.5*,† | 27.7 ± 22.3*,† |
Alb, albumin; Chol, cholesterol; Cr, creatinine; HDL, high‐density lipoprotein; LDL, low‐density lipoprotein; LOS, Otsuka Long‐Evans Tokushima Fatty rats treated with losartan; LOS + ROS, Otsuka Long‐Evans Tokushima Fatty rats treated with losartan and rosiglitazone; OLETF, Otsuka Long‐Evans Tokushima Fatty rats; ROS, Otsuka Long‐Evans Tokushima Fatty rats treated with rosiglitazone. *P < 0.05, compared with the untreated Long‐Evans Tokushima Otsuka (LETO) rats. †P < 0.05, compared with controls.
Expression of Cytokine Genes in Cardiac Tissue
When we compared the expression levels of myocardial cytokine genes using reverse transcription PCR analysis, the growth factors, transforming growth factor‐β and tumor necrosis factor‐α, along with the pro‐inflammatory cytokines, interleukin (IL)‐1β and IL‐6, were significantly higher in the OLETF rats compared with the LETO rats. However, the expression of each gene was significantly attenuated in the losartan‐treated and combination groups (two‐ and fourfold, respectively) when compared with the untreated OLETF rats. After being treated with losartan or with the combination treatment, the expression of cytokine genes in the OLETF cardiac tissue was similar to that of the LETO cardiac tissue. The data are presented in Figure 1.
Figure 1.
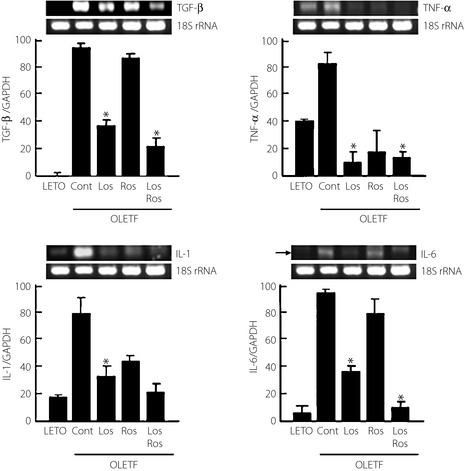
Expression levels of cytokine genes determined by reverse transcription polymerase chain reaction among the groups. Cont, control; GAPDH, glyceraldehyde 3‐phosphate dehydrogenase; IL, interleukin; LETO, Long‐Evans Tokushima Otsuka rats; Los, losartan; OLETF, Otsuka Long‐Evans Tokushima Fatty rats; Ros, rosiglitazone; rRNA, ribosomal ribonucleic acid; TGF, transforming growth factor; TNF, tumor necrosis factor. *p < 0.05, compared with controls.
Myocardial Fibrosis and Collagen Interposition
Figure 2 shows the myocardial histological findings and the degree of interstitial fibrosis in the experimental animals. The untreated OLETF rats showed a higher proportion of interstitial fibrosis in the myocardium compared with the LETO rats. Interstitial fibrosis was attenuated by approximately 3% in the OLETF rats treated with losartan and the combination treatment compared with the untreated OLETF rats. This attenuation was minimal in the OLETF rats treated with rosiglitazone alone.
Figure 2.
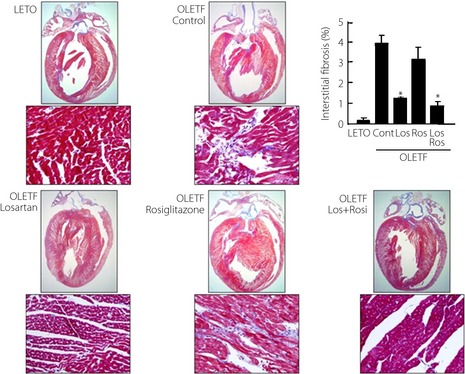
Representative myocardial histological findings, and the degree of interstitial fibrosis in experimental animals. Cont, control; LETO, Long‐Evans Tokushima Otsuka rats; Los, losartan; OLETF, Otsuka Long‐Evans Tokushima Fatty rats; Ros, rosiglitazone.
Type I and III collagen interposition in the LV was more prominent in the untreated OLETF controls (Figure 3). In the groups treated with losartan or the combination treatment, collagen interposition was similar to that observed in the LETO rats.
Figure 3.
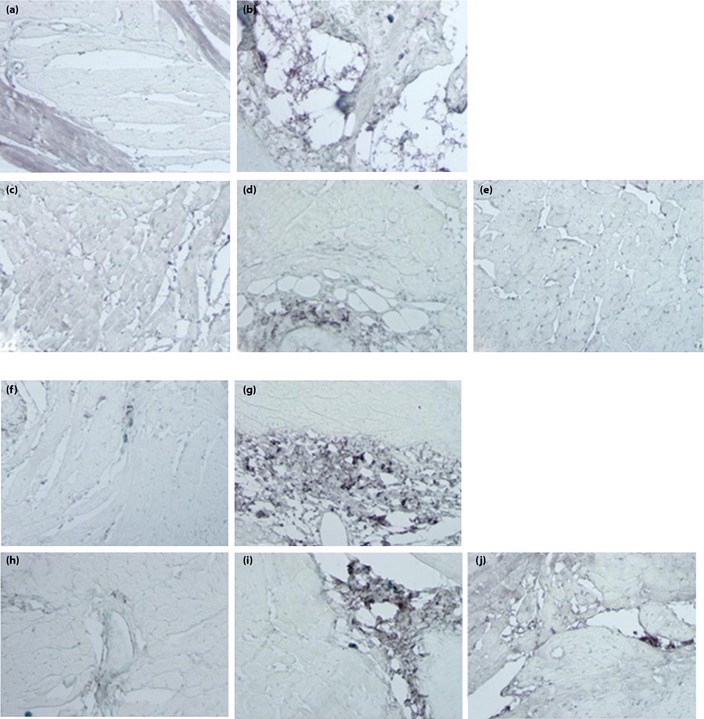
Interposition of collagen fibers in experimental animals. (a–e) Collagen type I. (a) Long‐Evans Tokushima Otsuka rats (LETO). (b) Otsuka Long‐Evans Tokushima Fatty (OLETF) control rats. (c) OLETF rats given losartan. (d) OLETF rats given rosiglitazone. (e) OLETF rats given losartan and rosiglitazone. (f–j) Collagen type III. (f) Long‐Evans Tokushima Otsuka rats (LETO). (g) Otsuka Long‐Evans Tokushima Fatty (OLETF) control rats. (h) OLETF rats given losartan. (i) OLETF rats given rosiglitazone. (j) OLETF rats given losartan and rosiglitazone.
Myocardial Function
Table 4 shows the functional data from two‐dimensional echocardiography and strain rate imaging at baseline and after treatment. At 28 weeks, the end‐systolic dimension was slightly larger in the OLETF rats compared with the LETO rats, but this difference was not statistically significant. Although there were no differences in the LV ejection fraction, the global radial strain and strain rate assessed with strain rate imaging were significantly lower in OLETF rats. Therefore, there was subtle LV systolic dysfunction in diabetic rats at the age of 28 weeks.
Table 4. Myocardial functional assessment with two‐dimensional echocardiography and strain rate imaging at baseline and after treatment.
| LETO (n = 5) | OLETF (n = 20) | ||||
|---|---|---|---|---|---|
| Control (n = 5) | LOS (n = 5) | ROS (n = 5) | LOS + ROS (n = 5) | ||
| At 28 weeks | |||||
| LVEDD (mm) | 7.6 ± 0.2 | 8.0 ± 0.5 | 7.9 ± 0.4 | 8.0 ± 0.5 | 8.1 ± 0.6 |
| LVESD (mm) | 5.6 ± 0.4 | 5.8 ± 0.5 | 5.7 ± 0.4 | 5.8 ± 0.6 | 5.9 ± 0.4 |
| FS (%) | 26.4 ± 2.1 | 24.0 ± 2.8 | 23.2 ± 3.2 | 23.6 ± 2.9 | 23.6 ± 1.9 |
| LVEF (%) | 60.1 ± 4.3 | 58.7 ± 5.0 | 62.8 ± 4.8 | 61.0 ± 5.4 | 58.5 ± 4.2 |
| Global radial strain (%) | 60.1 ± 5.8 | 52.8 ± 8.1* | 50.2 ± 5.5* | 49.8 ± 6.1* | 53.7 ± 8.0* |
| Global radial strain rate (/s) | 9.7 ± 1.2 | 8.5 ± 2.1* | 8.8 ± 3.6* | 8.9 ± 1.9* | 8.3 ± 2.6* |
| At 40 weeks | |||||
| LVEDD (mm) | 7.7 ± 0.3 | 8.2 ± 0.5* | 7.5 ± 0.4† | 7.7 ± 0.3† | 7.5 ± 0.5† |
| LVESD (mm) | 5.7 ± 0.5 | 5.9 ± 0.3 | 5.4 ± 0.4† | 6.3 ± 0.6† | 5.0 ± 0.6† |
| FS (%) | 25.6 ± 2.6 | 23.2 ± 2.7* | 28.2 ± 2.3*,† | 24.9 ± 5.1 | 30.3 ± 4.8*,† |
| LVEF (%) | 58.1 ± 4.0 | 55.3 ± 5.9 | 60.3 ± 3.9† | 54.0 ± 7.4* | 61.6 ± 5.2† |
| Global radial strain (%) | 55.5 ± 7.0 | 44.3 ± 10.5* | 59.3 ± 6.7† | 49.8 ± 6.0* | 55.7 ± 4.5† |
| Global radial strain rate (/s) | 8.5 ± 1.9 | 7.8 ± 2.7* | 8.8 ± 2.6† | 7.9 ± 1.5* | 8.5 ± 2.1† |
FS, fractional shortening; LOS, Long‐Evans Tokushima Fatty rats treated with losartan; LOS + ROS, Otsuka Long‐Evans Tokushima Fatty rats treated with losartan and rosiglitazone; LVEDD, left ventricular end diastolic dimension; LVEF, left ventricular ejection fraction; LVESD, left ventricular end systolic dimension; ROS, Otsuka Long‐Evans Tokushima Fatty rats treated with rosiglitazone. *P < 0.05, compared with the untreated Long‐Evans Tokushima Otsuka (LETO) rats. †P < 0.05, compared with controls.
After 12 weeks of treatment, LV structure and functional abnormalities were attenuated in rats treated with drugs. The LV progressively dilated, and myocardial function was more depressed in the untreated OLETF rats at the same time‐point. In the OLETF rats treated with losartan or the combination of both drugs, the global radial strain, strain rate, LV ejection fraction and chamber size were similar to those observed in the untreated LETO rats. However, increased heart size and reduced systolic function were observed in the OLETF rats treated with rosiglitazone. These findings suggest that treatment with rosiglitazone alone does not confer protection from progressive myocardial dysfunction in diabetic rats. However, it is important to note that the combination of both drugs does protect against progressive myocardial dysfunction.
Discussion
The results of the present study show the following: (i) losartan (an ARB) and rosiglitazone (a PPAR‐γ agonist) have differential effects on myocardial function, as well as structural changes of myocardium; and (ii) myocardial changes are associated with the degree of microalbuminuria in a rat model of type 2 diabetes.
The development of myocardial dysfunction is a major complication of DM. This condition is characterized by defects in contractile and relaxation functions in the absence of significant coronary artery disease or systemic hypertension2. In the past three decades, a number of experimental, pathological, epidemiological and clinical data have confirmed the association of DM with myocardial dysfunction8. The pathogenesis of myocardial dysfunction in DM remains unclear, although several mechanisms, including metabolic disturbances, myocardial fibrosis, microangiopathy, autonomic dysfunction and insulin resistance, have been proposed. Changes in the microvascular structure and function are also considered an important mechanism.
Albuminuria is considered a marker of generalized vascular dysfunction3. It has been shown to predict cardiovascular morbidity and mortality in diabetic patients independent of conventional cardiovascular risk factors including age, arterial hypertension, and hypercholesterolemia4. Although the underlying mechanism linking albuminuria to cardiac dysfunction is not clear, it is possible that the vascular changes that lead to renal dysfunction might also present in the vasculature of the heart, thus contributing to cardiac dysfunction. In diabetic hearts, morphological changes of small vessels characterized by microangiopathy were seen in several animal and autopsy studies9. In a previous clinical study, we showed that Doppler strain and strain rate imaging could detect subclinical LV systolic and diastolic dysfunction in diabetic patients with albuminuria13. In addition, it was proven that albuminuria was associated with myocardial dysfunction in diabetic patients without overt heart disease13. In the present study, the different degrees of microalbuminuria among the groups corresponded not only with the severity of LV systolic dysfunction assessed by strain and strain rate imaging, but also histological findings of myocardial fibrosis and collagen interposition.
Angiotensin II plays a key pathophysiological role in the progression of diabetic renal disease, and blockade of the renin–angiotensin system with angiotensin converting enzyme inhibitors or ARBs has become an important therapeutic strategy to reduce adverse renal and cardiovascular events in DM patients23. PPARs are ligand‐activated nuclear transcription factors that have been shown to play important roles in maintaining glucose and lipid homeostasis. Thiazolidinediones might modify the risk of vascular complications in DM, raise high‐density lipoprotein cholesterol levels and lower triglycerides. It was reported that PPAR‐alpha and ‐gamma agonists attenuate diabetic kidney disease in apolipoprotein E knockout mouse, and rosiglitazone improves both plasma glucose and blood pressure levels18. The beneficial effects of thiazolidinediones on hyperglycemia and cardiovascular risk factors have made them attractive therapeutic agents for patients with type 2 diabetes. However, in clinical practice, edema frequently occurs in patients treated with rosiglitazone, and signs of heart failure can develop as a side‐effect. This is despite many animal experimental studies that have shown the beneficial effects of reducing LV collagen accumulation and improving LV function19. In an effort to resolve this discrepancy, the present study clarified that rosiglitazone failed to prevent the progression of myocardial dysfunction, even though it promoted favorable metabolic profiles. In the present study, we could see the relatively dilated LV end‐systolic dimensions in the rosiglitazone‐treated group. Therefore, we postulated that the negative results of PPAR‐gamma agonists on the improvement of global radial strain, fibrosis and cardiac function might be due to abnormal accumulation of interstitial fluid. Hao et al.31 showed the effects of PPAR‐gamma ligands on angiotensin II‐induced plasminogen activator inhibitor‐1 and extracellular matrix expression assessed in primary‐cultured rat cardiac fibroblasts, and also revealed consistent results in angiotensin II‐infused rats as the in vivo model. Although the discrepancy between the previous study and the present findings is difficult to explain, the present study seems to be more physiological and closer to the real clinical situation. In contrast, the combination of losartan and rosiglitazone showed synergistic effects on the prevention of myocardial dysfunction and histological progression. These results suggest that PPAR‐gamma agonists promote favorable metabolic profiles, and they might be safe and valuable in the treatment of heart failure by combining with ARBs.
The limitations of the present study must be addressed. First, the hemodynamic parameters, such as blood pressure and LV pressure, were not evaluated, so we could not completely exclude the adverse effects of high blood pressure on the diabetic myocardium. Second, we were not able to show the diastolic dysfunction with Doppler‐based velocities in OLETF rats, although diastolic dysfunction has been described as an early sign of diabetic cardiomyopathy preceding the systolic damage in diabetic patients32. It was difficult to assess mitral inflow from rats because of their rapid heart rates and the angle‐dependence of the Doppler velocity. Third, this experimental study was carried out with a small number of LETO and OLETF rats.
In conclusion, losartan confers protective cardiovascular effects by attenuating the progression of microalbuminuria, along with myocardial structural and functional changes in OTLEF rats. In contrast, although rosiglitazone treatment in these rats promoted favorable metabolic benefits, it had only a minimally protective effect against the progression of microalbuminuria, and no benefit on myocardial structural and functional was observed. The combination of losartan and rosiglitazone showed both metabolic benefits and myocardial protective effects.
Acknowledgments
This study was supported by a research grant from MSD. The authors declare that there are no conflicts of interest.
J Diabetes Invest 2014; 5: 362–371
References
- 1.Grundy SM, Benjamin IJ, Burke GL. Diabetes and cardiovascular disease: a statement for healthcare professionals from the American Heart Association. Circulation 1999; 100: 1134–1146 [DOI] [PubMed] [Google Scholar]
- 2.Fang ZY, Prins JB, Marwick TH. Diabetic cardiomyopathy. Endocr Rev 2004; 25: 543–567 [DOI] [PubMed] [Google Scholar]
- 3.Deckert T, Feldt‐Rasmussen B, Borch‐Johnsen K, et al. Albuminuria reflects widespread vascular damage. The Steno hypothesis. Diabetologia 1989; 32: 219–226 [DOI] [PubMed] [Google Scholar]
- 4.Mattock MB, Morrish NJ, Viberti G, et al. Prospective study of microalbuminuria as predictor of mortality in NIDDM. Diabetes 1992; 42: 736–741 [DOI] [PubMed] [Google Scholar]
- 5.Morgensen CE. Microalbuminuria predicts clinical proteinuria and early mortality in maturity‐onset diabetes. N Engl J Med 1984; 310: 356–360 [DOI] [PubMed] [Google Scholar]
- 6.Rossing P, Hougaard P, Borch‐Johnsen K, et al. Predictors of mortality in insulin dependent diabetes: 10 year observational follow up study. BMJ 1996; 28: 779–784 [DOI] [PMC free article] [PubMed] [Google Scholar]
- 7.Chang C‐H, Chuang L‐M. Microalbuminuria and diabetic retinopathy in type 2 diabetic patients: From risk association to risk prediction. J Diabetes Invest 2013; 4: 42–44 [DOI] [PMC free article] [PubMed] [Google Scholar]
- 8.Zarich SW, Arbuckle BE, Cohen LR, et al. Diastolic abnormalities in young asymptomatic diabetic patients assessed by pulsed Doppler echocardiography. J Am Coll Cardiol 1988; 12: 114–120 [DOI] [PubMed] [Google Scholar]
- 9.Joffe II, Travers KE, Perreault‐Micale CL, et al. Abnormal cardiac function in the streptozocin‐induced non‐insulin‐dependent diabetic rat: noninvasive assessment with Doppler echocardiography and contribution of the nitric oxide pathway. J Am Coll Cardiol 1999; 34: 2111–2119 [DOI] [PubMed] [Google Scholar]
- 10.Dent CL, Bowman AW, Scott MJ, et al. Echocardiographic characterization of fundamental mechanisms of abnormal diastolic filling in diabetic rats with a parameterized diastolic filling formalism. J Am Soc Echocardiogr 2001; 14: 1166–1172 [DOI] [PubMed] [Google Scholar]
- 11.Poirier P, Bogaty P, Garneau C, et al. Diastolic dysfunction in normotensive men with well‐controlled type 2 diabetes: importance of maneuvers in echocardiographic screening for preclinical diabetic cardiomyopathy. Diabetes Care 2001; 23: 5–10 [DOI] [PubMed] [Google Scholar]
- 12.Fang ZY, Yuda S, Anderson V, et al. Echocardiographic detection on early diabetic myocardial disease. J Am Coll Cardiol 2003; 41: 611–617 [DOI] [PubMed] [Google Scholar]
- 13.Shim CY, Park S, Choi EY, et al. Is albuminuria an indicator of myocardial dysfunction in diabetic patients without overt heart disease? A study with Doppler strain and strain rate imaging Metabolism 2008; 57: 448–452 [DOI] [PubMed] [Google Scholar]
- 14.Van Hoeven KV, Factor SM. A comparison of the pathological spectrum of hypertensive, diabetic, and hypertensive‐diabetic heart disease. Circulation 1990; 82: 848–855 [DOI] [PubMed] [Google Scholar]
- 15.Deferrari G, Ravera M, Deferrari L, et al. Renal and cardiovascular protection in type 2 diabetes mellitus: angiotensin II receptor blockers. J Am Soc Nephrol 2002; 13: S224–S229 [DOI] [PubMed] [Google Scholar]
- 16.Diez J, Querejeta R, Lopez B, et al. Losartan‐dependent regression of myocardial fibrosis is associated with reduction of left ventricular chamber stiffness in hypertensive patients. Circulation 2002; 105: 2512–2517 [DOI] [PubMed] [Google Scholar]
- 17.Kawasaki D, Kusugi K, Waki H, et al. Role of activated renin‐angiotensin system in myocardial fibrosis and left ventricular diastolic dysfunction in diabetic patients: reversal by chronic angiotensin II type 1A receptor blockage. Circ J 2007; 4: 524–529 [DOI] [PubMed] [Google Scholar]
- 18.Saltiel AR, Olefsky JM. Thiazolidinediones in the treatment of insulin resistance and type II diabetes. Diabetes 1996; 45: 1661–1669 [DOI] [PubMed] [Google Scholar]
- 19.Tang WH, Francis GS, Hoogwerf BJ, et al. Fluid retention after initiation of thiazolidinedione therapy in diabetic patients with established chronic heart failure. J Am Coll Cardiol 2003; 41: 1394–1398 [DOI] [PubMed] [Google Scholar]
- 20.Kawano K, Hirashima T, Mori S, et al. Spontaneous long‐term hyperglycemic rat with diabetic complications. Otsuka Long‐Evans Tokushima Fatty (OLETF) strain. Diabetes 1992; 41: 1422–1428 [DOI] [PubMed] [Google Scholar]
- 21.Mizushige K, Yao L, Noma T, et al. Alteration in left ventricular diastolic filling and accumulation of myocardial collagen at insulin‐resistant prediabetic stage of a type II diabetic rat mode. Circulation 2000; 101: 899–907 [DOI] [PubMed] [Google Scholar]
- 22.Liu JE, Robbins DC, Palmieri V, et al. Association of albuminuria with systolic and diastolic left ventricular dysfunction in type 2 diabetes: the Strong Heart Study. J Am Coll Cardiol 2003; 41: 2022–2028 [DOI] [PubMed] [Google Scholar]
- 23.Kim S, Wanibuchi H, Hamaguchi A, et al. Angiotensin blockade improves cardiac and renal complications of type II diabetic rats. Hypertension 1997; 30: 1054–1061 [DOI] [PubMed] [Google Scholar]
- 24.Zandbergen AA, Baggen MG, Lamberts SW, et al. Effect of losartan on microalbuminuria in normotensive patients with type 2 diabetes mellitus. A randomized clinical trial. Ann Intern Med 2003; 139: 90–96 [DOI] [PubMed] [Google Scholar]
- 25.Lewis EJ, Hunsicker LG, Clarke WR, et al. Renoprotective effect of the angiotensin‐receptor antagonist irbesartan in patients with nephropathy due to type 2 diabetes. N Engl J Med 2001; 345: 851–860 [DOI] [PubMed] [Google Scholar]
- 26.Yki‐Järvinen H. Thiazolidinediones. N Engl J Med 2004; 351: 1106–1118 [DOI] [PubMed] [Google Scholar]
- 27.Lipscombe LL, Gomes T, Lévesque LE, et al. Thiazolidinediones and cardiovascular outcomes in older patients with diabetes. JAMA 2007; 298: 2634–2643 [DOI] [PubMed] [Google Scholar]
- 28.Diep QN, El Mabrouk M, Cohn JS, et al. Structure, endothelial function, cell growth, and inflammation in blood vessels of angiotensin II‐infused rats: role of peroxisome proliferator‐activated receptor‐gamma. Circulation 2002; 105: 2296–2302 [DOI] [PubMed] [Google Scholar]
- 29.Li J, Liu NF, Wei Q. Effect of rosiglitazone on cardiac fibroblast proliferation, nitric oxide production and connective tissue growth factor expression induced by advanced glycation end‐products. J Int Med Res 2008; 36: 329–335 [DOI] [PubMed] [Google Scholar]
- 30.Yue TlTL, Chen J, Bao W, et al. In vivo myocardial protection from ischemia/reperfusion injury by the peroxisome proliferator‐activated receptor‐gamma agonist rosiglitazone. Circulation 2001; 104: 2588–2594 [DOI] [PubMed] [Google Scholar]
- 31.G‐H Hao, X‐L Niu, D‐F Gao, et al. Agonists at PPAR‐γ suppress angiotensin II‐induced production of plasminogen activator inhibitor‐1 and extracellular matrix in rat cardiac fibroblasts. Br J Pharmacol 2008; 153: 1409–1419 [DOI] [PMC free article] [PubMed] [Google Scholar]
- 32.Raev DC. Which left ventricular function is impaired earlier in the evolution of diabetic cardiomyopathy? An echocardiographic study of young type I diabetic patients Diabetes Care 1994; 17: 633–639 [DOI] [PubMed] [Google Scholar]
- 33.Poulsen MK, Henriksen JE, Dahl J, et al. Left ventricular diastolic function in type 2 diabetes mellitus: prevalence and association with myocardial and vascular disease. Circ Cardiovasc Imaging 2010; 3: 24–31 [DOI] [PubMed] [Google Scholar]