Abstract
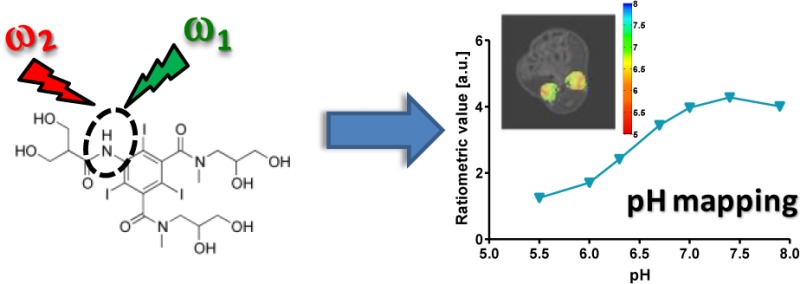
Chemical exchange saturation transfer (CEST) is a novel contrast mechanism for magnetic resonance imaging (MRI). CEST MRI selectively saturates exchangeable protons that are transferred to MRI-detectable bulk water signal. MRI-CEST (pH)-responsive agents are probes able to map pH in the microenvironment in which they distribute. To minimize the confounding effects of contrast agent concentration, researchers have developed ratiometric CEST imaging, which investigates contrast agents containing multiple magnetically non-equivalent proton groups, whose prototropic exchange have different pH responses. However, conventional ratiometric CEST MRI imposes stringent requirements on the selection of CEST contrasts agents. In this study, a novel ratiometric pH MRI method based on the analysis of CEST effects under different radio frequency irradiation power levels was developed. The proposed method has been demonstrated using iobitridol, an X-ray contrast agent analog of iopamidol but containing a single set of amide protons, both in vitro and in vivo.
Magnetic resonance imaging (MRI) is widely used for in vivo applications, due to its safety, spatial resolution, soft tissue contrast, and hence, clinical relevance. Notably, MRI-responsive contrast agents (CAs) add important physiological information, complementing routine anatomical images. In the past decade a new class of CAs has emerged that exploits the chemical exchange saturation transfer (CEST) mechanism, enabling detection of dilute solutes.1−3 Briefly, following selective radio frequency (RF) irradiation, mobile solute protons are saturated and exchange with surrounding water molecules. This saturation transfer results in a decrease of bulk water signal, hence CEST-MRI contrast.4−6
Responsive agents capable of reporting physicochemical properties of diagnostic interest of the microenvironment in which the contrast agent distributes (such as pH, temperature, metabolites, ions, proteins, or enzymes) have gained tremendous attention.7−18 Notably, concentration-independent CEST agents are needed to minimize the confounding effect of unknown and often heterogeneous distribution of contrast agent, facilitating in vivo imaging. This has been achieved by ratiometric CEST MRI of agents with multiple magnetically non-equivalent protons, whose CEST effects, upon ratioing, constitute the response to the physicochemical parameters of interest independent of contrast agent concentration.19 However, because ratiometric CEST MRI requires selective saturation of multiple labile groups, the chemical shift separation needs to be relatively large.6 In addition, because the chemical shift separation between labile proton resonances in Hz scales with magnetic field, ratiometric CEST imaging is particularly challenging at low field due to the small chemical shift difference. Thus, development of novel means of imaging of responsive CEST agents in vivo is urgently needed.20
Iobitridol is a widely used X-ray non-ionic contrast agent, marketed under the trade name Xenetix (Guerbert).21 Iobitridol is a low-osmolar non-ionic molecule, which is not charged. Hence, it should have negligible direct effects on pH measurement. Iobitridol possesses a single amide group, 5.6 ppm downfield from the bulk water resonance (set at 0 ppm by convention, Figure 1a).
Figure 1.

(a) Iobitridol chemical structure with a single amide proton group. (b) CEST spectra of 30 mM iobitridol solution at pH of 5.5 (solid line), 6.0 (dashed line), and 7.0 (dotted line). The reduction in MRI signal from bulk water signal upon selective irradiation at 5.6 ppm is pH sensitive (RF saturation power = 3 μT × 5 s, T = 310 K, Bo = 7 T). (c) Numerically solved pH-dependent chemical exchange rate for labile protons at 5.6 ppm.
The CEST properties of iobitridol were examined at different pH (30 mM iobitridol in PBS solution, 37 °C and B0 = 7T). Z-spectra (Figure 1b) represent the water proton signal plotted as a function of saturation frequency, where S0 is the control water signal without RF saturation and Ssat is the signal after saturation at a given offset. Figure 1b shows that the iobitridol amide CEST effect (5.6 ppm) is indeed pH sensitive. The CEST contrast (saturation transfer, ST) is calculated by asymmetry analysis, ST = (S–Δω – SΔω)/S0 where S–Δω and SΔω are reference and label signals with RF saturation applied at −Δω and Δω, respectively, and Δω is the labile proton frequency shift from the water resonance (i.e., 5.6 ppm for iobitridol). The iobitridol amide proton exchange rate (kex) was determined by simultaneously fitting Z-spectra from 3 to 8 ppm, obtained under B1 power levels of 1.5 and 3 μT, within the pH range 5.5–7.0 (Figure S1a,b).22kex was found to be 265, 550, 1481, 2640, and 4820 Hz for pH of 5.5, 6.0, 6.3, 6.7, and 7.0, respectively. The exchange rate can be reasonably described using a dominantly base-catalyzed exchange regime equation (i.e., kex = k0 + kb × 10pH-pkw), and we found kex = 0.96 × 10pH–3.3 for amide protons at 5.6 ppm (Figure 1c), similar to the 2-hydrooxypropanamido proton of iopamidol.
It has been shown that the saturation efficiency for mobile solutes can be approximately described by α ≈ ω12/(ω12 + kex2), where ω1 is the RF irradiation power in radian (ω1 = γB1).23 The experimentally obtainable CEST effect depends on both RF power and kex, hence, pH.24 We measured iobitridol CEST MRI for a range of pH levels under three saturation power levels (1.5, 3, and 6 μT). The iobitridol CEST effect is strongly pH-dependent, as expected (Figure 2). For example, the CEST effect increased from pH of 5.5 to 6.7 and then decreased at higher pH for a saturation power of 3 μT. We showed that the peak ST increases and shifts to higher pH with RF power. The observation of B1-dependent CEST measurement enables a novel ratiometric calculation by comparing ST effects obtained under different (two or more) RF irradiation powers from a single labile proton group. Consequently, we propose a new ratiometric index (dubbed ratio of RF power mismatch or RPM) according to eq 1:
| 1 |
where STRF1,2 represents ST obtained under different RF power levels (i.e., B1). The proposed RPM was calculated as a function of pH (Figure 2b). For instance, by ratioing the ST effects between RF power levels of 3 and 6 μT, RPM showed a good pH response for pH from 6.0 to 7.4. Moreover, RPM calculated from RF power levels of 1.5 μT over 6 μT provided substantially higher pH sensitivity and range, from 5.5 to 7.4.
Figure 2.

(a) Iobitridol MRI-CEST contrast (ST%) depends on pH at three representative RF saturation powers 1.5 (circles), 3 (squares), and 6 μT (triangles) measured at 7 T, 310 K and an irradiation time of 5 s. (b) RPM curves provide pH-sensitive measurements: 3/6 μT (triangles) and 1.5/6 μT (squares).
The proposed RF power-based ratiometric analysis was validated in vitro. Accurate iobitridol solution pH (Figure 3d) was determined according to the pH–RPM calibration curve (1.5/6 μT). pH determined from iobitridol CEST MRI strongly correlates with pH-meter measurement (R2 = 0.98, P < 0.001, Figure 3e). Similar pH determination was achieved with CEST measurements of 3 and 6 μT (R2 = 0.97, P < 0.001, Figure S2).
Figure 3.
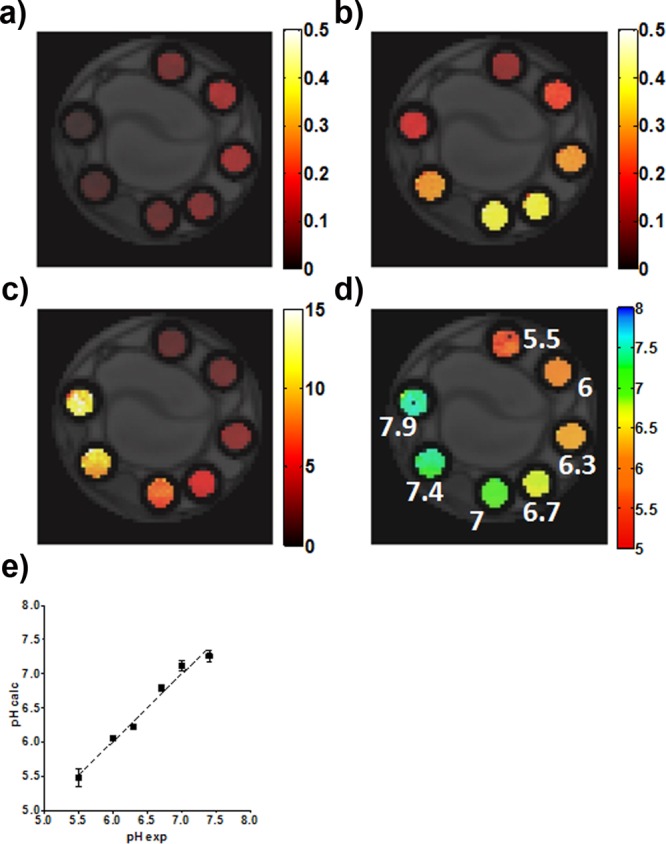
CEST-MR images of 30 mM iobitridol solution titrated at different pH values (5.5, 6.0, 6.3, 6.7, 7.0, 7.4, 7.9). ST images obtained upon irradiation with RF saturation levels of 1.5 μT (a) and of 6 μT (b). (c) Ratiometric RPM map calculated by using eq 1 from the ratio of the corresponding ST images (a and b). (d) The pH map calculated from the ratiometric map and the calibration curve of Figure 2b; and (e) pH calculated vs pH titrated for 30 mM iobitridol phantoms, R2 = 0.98 (Bo = 7 T, 310 K).
It should be noted that, although RPM depends on pH and choice of B1 power levels, it does not depend on CEST agent concentration. This is important in order to exploit a MRI-CEST responsive agent for in vivo applications. We prepared an iobitridol phantom at different concentrations in the range 10–50 mM, with pH titrated to 6.6 and 7.2 (Figure 4). Accurate pH values were obtained within the error limit of 0.1 pH unit for all concentrations and pH values investigated in our study (Figure 4b,c). Concentration-independent pH was determined for RPM analysis of both the RF power ratios of 1.5/6 μT and 3/6 μT (Figure 4d,e).
Figure 4.
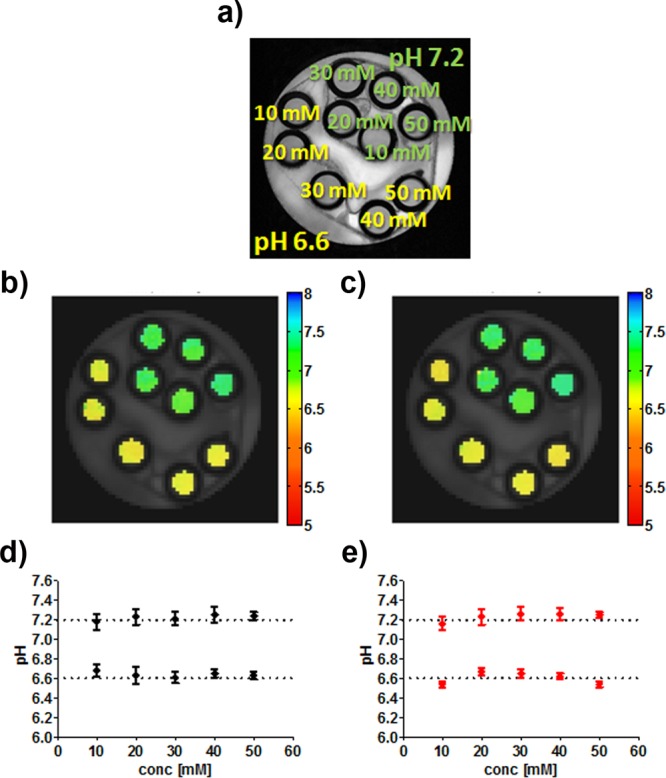
RPM pH mapping is independent of iobitridol concentration. (a) Iobitridol-containing phantoms at different concentrations (10–50 mM) and pH values (6.6 and 7.2). MRI-CEST pH maps calculated by exploiting the RPM approach with RF irradiation powers of 1.5/6 μT (b) and of 3/6 μT (c). Mean pH values calculated for several concentrations upon ratioing 1.5/6 μT (d) and of 3/6 μT (e).
We evaluated the proposed RPM pH imaging in vivo. Kidney ST images (Figure 5b,c) of a wild-type BALB/c mouse were obtained (B1 = 1.5 and 6 μT) before and 15 min after intravenous injection of iobitridol, at a typical clinical dose (1.5 g I/kg b.w.). ST maps were calculated by taking the difference between post- and pre-injection ST maps at 5.6 ppm, which removes confounding endogenous CEST effects (Figure S5).
Figure 5.
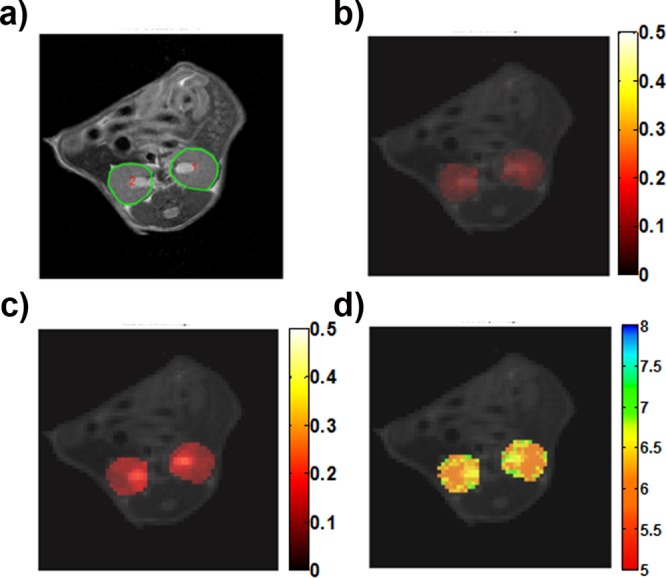
Renal CEST-MRI following iobitridol i.v. injection (1.5 g I/kg b.w.). (a) T2w renal MRI. CEST ST difference map between pre-/post-injection at 1.5 μT (b) and 6 μT (c). (d) The pH map determined from RF power-based ratiometric pH imaging. Only kidney signal displayed in color on grayscale image to highlight effects.
Mean renal pH values between 6.4 and 6.6 were obtained, with reasonable differentiation of the calyx-inner medulla and outer medulla-cortical regions (Figure 5d). In our prior study the average pH, in the same regions, varied between 6.5 and 6.7 in healthy mice.28 Because both ratiometric pH MRI methods (iopamidol and iobitridol) have an accuracy level of about ∼0.1–0.15 units, the two sets of pH measurements appears within the experimental error.
To further confirm this issue, in vivo validation of pH MRI was performed by comparing pH obtained with the proposed method with that obtained with previously published iopamidol pH mapping. A significant correlation was found between the two methods (Pearsons’ r = 0.90, p < 0.01), and no statistical difference in the measured pH values was obtained between the two methods (Figure S4).
We further investigated the proposed pH MRI method in imaging extracellular pH in tumors. A xenograft breast tumor mouse model was prepared by subcutaneous injection of 250,000 adenocarcinoma TSA tumor cells into both the left and right flank of a 8 weeks old BALB/c mouse.25 The mouse underwent MRI 14 days after tumor implantation, when tumor size reached a diameter of ∼4–6 mm. We acquired CEST images at two RF power levels (1.5 and 6.0 μT) before and 15 min after iobitridol injection (4 g I/kg, i.v.). ST difference maps increased by about 2–3% (B1 = 1.5 μT, Figures 6b and S6c) and 6–8% (B1 = 6 μT, Figures 6c and S6d). The ST difference map highlights the extravasation of iobitridol, indicating the highly heterogeneous extracellular–extravascular space of the tumor.26 Inside tumor regions we observed heterogeneous detectability of the molecule, likely due to vascularization/extravasation variation within the tumor. A similar limited extravasation was observed when using ProHance, a Gd-based agent with equivalent small molecular weight (Figure S7). An extracellular tumor pH of 6.4–6.8 was measured (Figure 6d).
Figure 6.
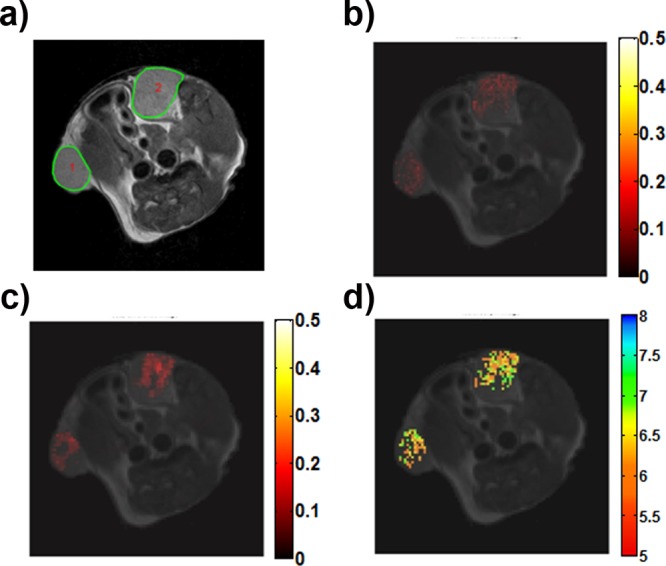
CEST-MR images of xenografted-tumor bearing mouse following iobitridol i.v. injection (dose 4 g I/kg b.w.). (a) T2w anatomical image with ROIs including the two tumors; CEST contrast difference map between pre- and post-injection following RF irradiation at 1.5 μT (b) and at 6 μT (c). (d) Corresponding pH map obtained upon ratioing the difference ST maps of (b and c). Only tumor signal displayed in color on grayscale image to highlight effects.
This study demonstrates a concentration-independent pH imaging method that advances conventional ratiometric pH MRI. Previously, such measurement required CEST agents with multiple magnetically non-equivalent proton pools, such as iopamidol and iopromide, with two labile proton pools resonating at 4.2/4.3 ppm and 5.5/5.6 ppm, respectively, or paramagnetic CEST agents, irradiated with the same RF power.27−29 The method proposed herein exploits a novel approach to RF power level-based ratiometric analysis that extends ratiometric imaging to CEST agents with at least one exchangeable site. The proposed pH MRI was further tested by measuring pH with iobitridol concentration ranging from 10 to 50 mM. Indeed, pH determination was within pH of 0.1 (Figure 4d,e), confirming that the proposed method provides concentration-independent pH measurement.
The proposed iobitridol pH MRI method covers a broad pH range, slightly higher than that achieved with conventional ratiometric pH MRI.9,30,31 We calculated the difference of the ratiometric values between the pH values of 6.0 and 7.4 (ΔRpH) to assess pH sensitivity and found ΔRpH to be 3.1, 2.8, and 1.1 for iopamidol, iopromide, and YbHPDO3A, respectively, while the proposed iobitridol pH MRI method yielded ΔRpH of 2.7 (3/6 μT) and 11.6 (1.5/6 μT, Figure S3).
Further study is needed to optimize this new pH MRI method. Our study investigated typical RF power levels of 1.5, 3, and 6 μT, which could be further investigated for enhanced pH sensitivity.32,33 Whereas only one Z-spectrum is needed to derive pH from conventional ratiometric pH MRI, our approach requires two Z-spectra. Whereas contrast agent concentration change between two Z-spectra may affect pH determination in vivo, we observed that small concentration difference due to washout does not significantly affect pH measurement (Figure S8). Because the chemical shift difference between water and labile protons (e.g., 5.6 ppm for iobitridol) is much larger than chemical shift difference between labile groups (e.g., 1.2 ppm for iopamidol), the proposed approach should be more applicable at lower field strength.
Thus, the proposed RF power-based ratiometric pH MRI method extends conventional ratiometric pH MRI, enhances pH sensitivity, and is promising to facilitate in vivo pH imaging.34 Importantly, iobitridol has been approved for human use, and the possibility of imaging iodinated X-ray contrast media as MRI-CEST agents in patient has been recently reported.35 In conclusion, our study generalizes conventional ratiometric CEST-MRI and is promising for a host of molecular imaging applications.
Acknowledgments
Financial support from local government (Regione Piemonte, PIIMDMT and Nano-IGT projects), FIRB-MIUR project “RINAME” no. RBAP114AMK, NIH/NIBIB 1K01EB009771, and NIH/NINDS 1R01NS083654 is gratefully acknowledged.
Supporting Information Available
Experimental procedures and data. This material is available free of charge via the Internet at http://pubs.acs.org.
Author Present Address
⊥ Department of Preclinical Imaging and Radiopharmacy, University of Tubingen, Tubingen, Germany
Author Contributions
# D.L.L. and P.Z.S. contributed equally.
The authors declare no competing financial interest.
Funding Statement
National Institutes of Health, United States
Supplementary Material
References
- Sherry A. D.; Woods M. Annu. Rev. Biomed. Eng. 2008, 10, 391–411. [DOI] [PMC free article] [PubMed] [Google Scholar]
- van Zijl P. C.; Yadav N. N. Magn. Reson. Med. 2011, 65, 927–48. [DOI] [PMC free article] [PubMed] [Google Scholar]
- Vinogradov E.; Sherry A. D.; Lenkinski R. E. J. Magn. Reson. 2013, 229, 155–72. [DOI] [PMC free article] [PubMed] [Google Scholar]
- Terreno E.; Castelli D. D.; Aime S. Contrast Media Mol. Imaging 2010, 5, 78–98. [DOI] [PubMed] [Google Scholar]
- Liu G.; Song X.; Chan K. W.; McMahon M. T. NMR Biomed. 2013, 26, 810–28. [DOI] [PMC free article] [PubMed] [Google Scholar]
- Castelli D. D.; Terreno E.; Longo D.; Aime S. NMR Biomed. 2013, 26, 839–49. [DOI] [PubMed] [Google Scholar]
- Longo D. L.; Di Gregorio E.; Abategiovanni R.; Ceccon A.; Assfalg M.; Molinari H.; Aime S. Analyst 2014, 139, 2687–90. [DOI] [PubMed] [Google Scholar]
- Longo D. L.; Dastru W.; Digilio G.; Keupp J.; Langereis S.; Lanzardo S.; Prestigio S.; Steinbach O.; Terreno E.; Uggeri F.; Aime S. Magn. Reson. Med. 2011, 65, 202–11. [DOI] [PubMed] [Google Scholar]
- Delli Castelli D.; Terreno E.; Aime S. Angew. Chem., Int. Ed. Engl. 2011, 50, 1798–800. [DOI] [PubMed] [Google Scholar]
- Chan K. W.; McMahon M. T.; Kato Y.; Liu G.; Bulte J. W.; Bhujwalla Z. M.; Artemov D.; van Zijl P. C. Magn. Reson. Med. 2012, 68, 1764–73. [DOI] [PMC free article] [PubMed] [Google Scholar]
- Rivlin M.; Horev J.; Tsarfaty I.; Navon G. Sci. Rep. 2013, 3, 3045. [DOI] [PMC free article] [PubMed] [Google Scholar]
- Bar-Shir A.; Liu G.; Liang Y.; Yadav N. N.; McMahon M. T.; Walczak P.; Nimmagadda S.; Pomper M. G.; Tallman K. A.; Greenberg M. M.; van Zijl P. C.; Bulte J. W.; Gilad A. A. J. Am. Chem. Soc. 2013, 135, 1617–24. [DOI] [PMC free article] [PubMed] [Google Scholar]
- Liu G.; Liang Y.; Bar-Shir A.; Chan K. W.; Galpoththawela C. S.; Bernard S. M.; Tse T.; Yadav N. N.; Walczak P.; McMahon M. T.; Bulte J. W.; van Zijl P. C.; Gilad A. A. J. Am. Chem. Soc. 2011, 133, 16326–9. [DOI] [PMC free article] [PubMed] [Google Scholar]
- Dastru W.; Longo D.; Aime S. Drug Discovery Today: Technol. 2011, 8, e109–e115. [DOI] [PubMed] [Google Scholar]
- Ratnakar S. J.; Viswanathan S.; Kovacs Z.; Jindal A. K.; Green K. N.; Sherry A. D. J. Am. Chem. Soc. 2012, 134, 5798–800. [DOI] [PMC free article] [PubMed] [Google Scholar]
- Olatunde A. O.; Dorazio S. J.; Spernyak J. A.; Morrow J. R. J. Am. Chem. Soc. 2012, 134, 18503–5. [DOI] [PubMed] [Google Scholar]
- Tsitovich P. B.; Spernyak J. A.; Morrow J. R. Angew. Chem., Int. Ed. Engl. 2013, 52, 13997–4000. [DOI] [PMC free article] [PubMed] [Google Scholar]
- Kogan F.; Haris M.; Singh A.; Cai K.; Debrosse C.; Nanga R. P.; Hariharan H.; Reddy R. Magn. Reson. Med. 2014, 71, 164–72. [DOI] [PMC free article] [PubMed] [Google Scholar]
- Ward K. M.; Balaban R. S. Magn. Reson. Med. 2000, 44, 799–802. [DOI] [PubMed] [Google Scholar]
- Sun P. Z.; Wang E.; Cheung J. S. Neuroimage 2012, 60, 1–6. [DOI] [PMC free article] [PubMed] [Google Scholar]
- Taylor W.; Moseley I. Eur. J. Radiol 1995, 20, 57–60. [DOI] [PubMed] [Google Scholar]
- Sun P. Z. J. Magn. Reson. 2010, 205, 235–41. [DOI] [PMC free article] [PubMed] [Google Scholar]
- Zhou J.; Wilson D. A.; Sun P. Z.; Klaus J. A.; Van Zijl P. C. Magn. Reson. Med. 2004, 51, 945–52. [DOI] [PubMed] [Google Scholar]
- McMahon M. T.; Gilad A. A.; Zhou J.; Sun P. Z.; Bulte J. W.; van Zijl P. C. Magn. Reson. Med. 2006, 55, 836–47. [DOI] [PMC free article] [PubMed] [Google Scholar]
- Nanni P.; de Giovanni C.; Lollini P. L.; Nicoletti G.; Prodi G. Clin. Exp. Metastasis 1983, 1, 373–80. [DOI] [PubMed] [Google Scholar]
- Gillies R. J.; Schornack P. A.; Secomb T. W.; Raghunand N. Neoplasia 1999, 1, 197–207. [DOI] [PMC free article] [PubMed] [Google Scholar]
- Chen L. Q.; Howison C. M.; Jeffery J. J.; Robey I. F.; Kuo P. H.; Pagel M. D. Magn. Reson. Med. 2013, 10.1002/mrm.25053. [DOI] [PMC free article] [PubMed] [Google Scholar]
- Longo D. L.; Busato A.; Lanzardo S.; Antico F.; Aime S. Magn. Reson. Med. 2013, 70, 859–864. [DOI] [PubMed] [Google Scholar]
- Wu Y.; Soesbe T. C.; Kiefer G. E.; Zhao P.; Sherry A. D. J. Am. Chem. Soc. 2010, 132, 14002–3. [DOI] [PMC free article] [PubMed] [Google Scholar]
- Delli Castelli D.; Ferrauto G.; Cutrin J. C.; Terreno E.; Aime S. Magn. Reson. Med. 2014, 71, 326–32. [DOI] [PubMed] [Google Scholar]
- Sun P. Z.; Longo D. L.; Hu W.; Xiao G.; Wu R. Phys. Med. Biol. 2014, 59, 4493–4504. [DOI] [PMC free article] [PubMed] [Google Scholar]
- Sun P. Z.; Benner T.; Copen W. A.; Sorensen A. G. Stroke 2010, 41, S147–51. [DOI] [PMC free article] [PubMed] [Google Scholar]
- Sun P. Z.; van Zijl P. C.; Zhou J. J. Magn. Reson. 2005, 175, 193–200. [DOI] [PubMed] [Google Scholar]
- McVicar N.; Li A. X.; Goncalves D. F.; Bellyou M.; Meakin S. O.; Prado M. A.; Bartha R. J. Cereb. Blood Flow Metab. 2014, 34, 690–8. [DOI] [PMC free article] [PubMed] [Google Scholar]
- Müller-Lutz A.; Khalil N.; Schmitt B.; Jellus V.; Pentang G.; Oeltzschner G.; Antoch G.; Lanzman R. S.; Wittsack H. J. MAGMA 2014, 10.1007/s10334-014-0433-8. [DOI] [PubMed] [Google Scholar]
Associated Data
This section collects any data citations, data availability statements, or supplementary materials included in this article.


