Abstract
Water contributes significantly to the binding of small molecules to proteins in biochemical systems. Molecular dynamics (MD) simulation based programs such as WaterMap and WATsite have been used to probe the locations and thermodynamic properties of hydration sites at the surface or in the binding site of proteins generating important information for structure-based drug design. However, questions associated with the influence of the simulation protocol on hydration site analysis remain. In this study, we use WATsite to investigate the influence of factors such as simulation length and variations in initial protein conformations on hydration site prediction. We find that 4 ns MD simulation is appropriate to obtain a reliable prediction of the locations and thermodynamic properties of hydration sites. In addition, hydration site prediction can be largely affected by the initial protein conformations used for MD simulations. Here, we provide a first quantification of this effect and further indicate that similar conformations of binding site residues (RMSD < 0.5 Å) are required to obtain consistent hydration site predictions.
Introduction
Water is a crucial participant in virtually all ligand-binding processes in biology. Water contributes significantly to the strength of intermolecular interactions in the aqueous phase by mediating protein–ligand interactions and desolvating and solvating both ligand and protein upon ligand binding and unbinding.1−6 Nevertheless, water molecules are often underappreciated and even ignored in ligand docking studies. One reason for this neglect is that our understanding of the effect of water thermodynamics on ligand-protein binding free energies is still limited.
In drug design, displacing an ordered water molecule at the binding site has been used as a strategy to increase binding affinity.1,7−12 However, the displacement of energetically favorable water molecules in the binding site can also result in decreased binding affinity.1,13,14 Thus, it is important to accurately predict the thermodynamic properties of water molecules in the binding sites, in order to allow for a rational decision on whether or not to preferentially replace a water molecule with a ligand moiety.
The localized positions of water molecules in the binding site, i.e. hydration sites, can be partially identified in X-ray crystal structures or can be predicted computationally. A number of computational methods have been developed to predict hydration sites. Energy-based methods, such as GRID15 and CARTE16 calculate the interaction energy between a water molecule and the protein to estimate the energetic favorability of water molecules in the binding site of a protein. Knowledge-based approaches, such as AQUARIUS17 and SuperStar,18 predict likely hydration sites around polar or charged groups in proteins using experimentally derived algorithms on preferred geometries of water molecules around different amino acids from crystal structural data. AcquaAlta is another algorithm that specifies rules for favorable water geometries using an extensive search of the Cambridge Structrual Database (CSD) and also uses ab initio calculations for the hydration propensities of functional groups. Those rules are then used to identify the location of water molecules bridging polar groups between the protein and the ligand.19 Furthermore, 3D reference interaction site model (3D-RISM) is an integral theory approach which produces an approximate average solvent distribution around a rigid solute using liquid state integral equations where the high dielectric polarization, the detailed interactions with a solute, and the multibody correlations of the solvent structure are taken into consideration.20 A more recent approach, WaterDock, can be used to predict the locations of hydration sites and the likelihood each hydration site being displaced or conserved via repeated, independent docking of a water molecule into a protein cavity, followed by a filtering and clustering procedure.21
In recent years, molecular dynamics (MD) based methods became popular for analyzing hydration sites. The protein is simulated with explicit water molecules and subsequent physics-based analysis is used to predict the location of water molecules in the binding site and the corresponding thermodynamic profile. Developing and using the inhomogeneous fluid solvation theory (IFST), Li and Lazaridis used MD simulations to calculate the thermodynamic properties of water molecules in the protein binding site including enthalpic and entropic contributions.10,22,23 On the basis of IFST, WaterMap was developed to identify hydration sites in binding pockets and to evaluate the favorability of their displacement using an empirical formula based on the computed enthalpic and entropic contributions.24 Our previously developed hydration site analysis program, WATsite, identifies hydration sites using a MD trajectory. The thermodynamic profile of each hydration site is then estimated by computing the enthalpy and entropy of the water molecule occupying a hydration site throughout the simulation.25,26
These hydration site analysis programs using MD simulations have become popular in the past few years,12,24,25 but many questions concerning the simulation protocol and its effect on hydration site identification and thermodynamic profiling remain unanswered. For example, the binding site may not be ideally hydrated at the beginning of the MD simulation and water molecules need to diffuse into or out of the binding site. This diffusion of water molecules into and out of binding cavities may be slow, especially with buried active sites. In addition, most water molecules typically are not well ordered in the binding site. Furthermore, it is well-known that the convergence of entropy is often notoriously slow in MD simulations.27,28 Considering these issues, the question arises for how long MD simulation should be performed to accurately predict hydration sites and their thermodynamic profile? Also, hydration sites may be predicted based on different X-ray structures or homology models representing different starting protein conformations. Thus, it is important to investigate how similar the predicted hydration sites and associated free energies are for different initial protein conformations.
In this current study we aim to approach these issues by (1) studying the influence of simulation lengths on hydration site analysis and (2) determining the sensitivity of hydration site profiling and desolvation free energy prediction on differences in starting protein conformations.
Materials and Methods
Protein Systems and Preparation
Four conformations from two protein systems have been chosen: goose egg-white lysozyme (GEWL) (PDB code: 153L and 154L)29 and Mycobacterium tuberculosis pyridoxine 5′-phosphate oxidase (PLP) (PDB code: 1XXO and 2AQ6).30 For each system, the ligands from the holo structures were removed and the crystallographic water molecules were kept. The program Reduce31 was used to adjust the side-chain conformations of ASN, GLN, and HIS, and tautomers and protonation states of HIS residues. The protein was then solvated in an octahedron of water molecules using the SPC water model32 with a minimum distance of 10 Å between any protein atom and the faces of the octahedron. Chlorine and sodium ions were then added to neutralize the systems.
MD Simulations
MD simulations were performed using GROMACS33 with the AMBER03 force field. Each system was first energy minimized for 5000 steps using the steepest descent algorithm. With all heavy atoms harmonically restrained (spring constants of 10 kJ mol–1 Å–2), the system was then equilibrated for 1.25 ns with periodic boundary conditions in all three dimensions. Temperature coupling was performed using the Nose-Hoover thermostat34,35 at 300 K, and the Parrinello–Rahman36 method was used for pressure coupling at 1 bar. The electrostatic interactions were calculated using the Particle Mesh Ewald method37,38 with a cutoff of 10 Å for the direct interactions. The Lennard-Jones interactions were truncated at a distance of 14 Å. Finally, for hydration site identification and analysis, 20 ns production simulations were performed with the same settings as the equilibration run to test convergence of hydration site locations and enthalpy and entropy calculations. Coordinates were saved every picosecond, generating 20 000 frames.
Theory of Hydration Site Identification
Using all snapshots generated throughout the production run of each MD simulation, the hydration sites were identified. The detailed method has been described elsewhere.25 Briefly, a 3D grid was placed over the user-defined binding site using a grid spacing of 0.25 Å. In each snapshot, the positions of the oxygen atoms of all water molecules in the binding site were determined and a Gaussian distribution function centered on the oxygen atom was used to distribute the occupancy of the water molecule onto the 3D grid. The occupancy distribution was then averaged over the production run and a quality threshold (QT) clustering algorithm was used to identify the pronounced peaks that define the hydration site locations.
Desolvation Free Energy Prediction
The desolvation free energy of each hydration site was determined by separately analyzing the enthalpy and entropy contributions of the water molecules inside a hydration site
| 1 |
ΔHhs and ΔShs are the enthalpic and entropic change of transferring a water molecule from the bulk solvent into the hydration site of the protein binding site. Details on the calculations of both terms can be found in our previous publication.25 Briefly, the enthalpic change was estimated by the change of the average interaction energies:
| 2 |
where Ehs is the average sum of van der Waals and electrostatic interactions between each water molecule inside a given hydration site with the protein and all the other water molecules, and Ebulk is the interaction energy of a water molecule with all other water molecules in the bulk solvent phase. ΔShs was computed by39
| 3 |
where C° is the concentration of pure water (1 molecule/29.9 Å3), R is the gas constant, and pext(q) is the external mode probability density function (PDF) of the water molecules’ translational and rotational motions during the molecular dynamics simulation.
Hydration Site Analysis
(a) Comparison between Hydration Sites
To compare the relative locations of hydration sites between different simulations of the same protein, the last frame of each MD trajectory was aligned to the corresponding binding site in the X-ray structure using PyMOL. The last frame was arbitrarily chosen for the alignment process. As the protein is restrained during the MD simulation, the alignment process is fairly independent of the selection of a specific snapshot from the same MD trajectory. The predicted locations of the hydration sites were then shifted using the same transformation. The similarity of hydration site locations from two different simulation runs was determined by calculating all pairwise distances between hydration sites of two different simulations. The pair of hydration sites with smallest distance was identified and subsequently removed from further analysis. This process was continued until no additional hydration site pairs with a distance smaller than 1 Å could be identified. The 1 Å threshold for defining similar hydration site locations was chosen as the hydration sites are defined as spheres with radius of 1 Å.24,25 Each identified pair of hydration sites was considered to represent the same hydration site of a protein.
To compare the thermodynamic profiles of hydration sites between different simulations of the same protein, the free energy values of all pairs of the same hydration site were plotted against each other. The correlation coefficients (R2) to the regression line with slope = 1 and zero point = 0, i.e. y = x were then calculated. Also, the root-mean square error (RMSE) of energy values of all paired hydration sites was calculated.
(b) Dependence of Hydration Site Analysis on Simulation Length
To study the influence of simulation length on calculated enthalpy and entropy values for each hydration site, different time points throughout the MD simulations were selected and the enthalpy and entropy values of each hydration site up to this time point were calculated. Analysis was performed for the first 1, 1.5, 2, 2.5, 3, 4, 5, and 10 ns from the 20 ns simulation. For each simulation length, the enthalpy, entropy, and free energy values were compared for each hydration site to the corresponding values of the 20 ns simulation, assuming that the energy values reached convergence after 20 ns simulation. The correlation between the energy values of two different simulations was quantified using Pearson correlation coefficients R2 for the linear regression line with slope = 1 and zero point = 0, e.g. ΔGi20ns = ΔGi for all hydration sites i. The specific regression line was chosen because we are studying the convergence properties of the absolute values of the hydration energies over simulation length.
(c) Generation of Different Starting Conformations
In order to study the sensitivity of hydration site prediction on initial protein structure, 1 ns MD simulations without harmonic restrain were performed to sample different protein conformations.
The root-mean square deviation (RMSD) between binding site residues of each frame to every other frame from the entire trajectory was calculated. Conformation pairs were distributed into four different bins with RMSD values of 0–0.5, 0.5–1, 1–1.5, and 1.5–2 Å, respectively. From each bin, five conformations were selected to define four RMSD groups representing different levels of similarity. A group with higher RMSD values contains conformations with larger structural variations. Then, with heavy atoms harmonically restrained another 4 ns MD simulation was performed for all selected conformations, and those trajectories were used to predict the hydration sites for further analysis.
(d) Estimation of Desolvation Free Energy of the Protein upon Ligand Binding
Using the predicted hydration sites and the PyMOL plugin of WATsite,26 the desolvation free energy of the protein due to replacing water molecules in the protein binding site upon ligand binding was estimated. Different distance cutoffs (1, 1.5, 2, and 2.5 Å) are specified to identify hydration sites within the specified distance to any of the ligands’ heavy atoms. Larger distance cutoffs usually identify more hydration sites that are displaced by the ligand. The desolvation free energy is then estimated by summing up the free energies of those identified hydration sites that are displaced upon ligand binding.
Results and Discussion
Dependence of Hydration Site Analysis on Simulation Length
To study the influence of simulation length on calculated enthalpy and entropy for each hydration site, different time points throughout the MD simulations were selected and the enthalpy and entropy values of each hydration site up to this time point were calculated.
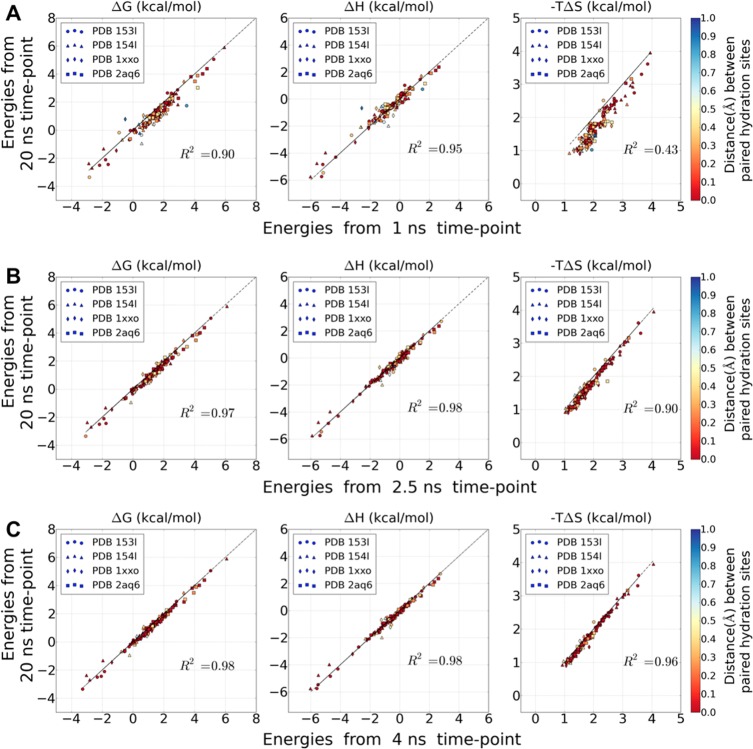
The correlation between the energy values of different time points of simulations (1, 1.5, 2, 2.5, 3, 4, 5, and 10 ns), and the energy values of the entire 20 ns simulation were calculated. As described in the Materials and Methods section, the paired hydration sites between two simulations were first determined, and estimated energy values of the same hydration site were pairwise compared. In order to study the convergence of the energy values, the Pearson correlation coefficients R2 to the regression line with slope = 1 and zero point = 0, i.e. y = x were then calculated as shown in Figure 1. The geometric distances between paired hydration sites were color coded, ranging from red (identical position) to blue (1 Å distance). For protein PLP (PDB: 1XXO and 2AQ6), using 24 processors the required computation time for the three experiments (1, 2.5, and 4 ns) in Figure 1 was about 12, 30, and 52 h, respectively.
Figure 1.
Correlation of energy values of the paired hydration sites between those obtained from the 20 ns MD simulations and those obtained from shorter simulation lengths: (A) 1, (B) 2.5, (C) 4 ns. The correlation coefficients (R2) is calculated to the regression line with the slope =1 and zero point = 0, i.e. y = x. (left) Desolvation free energy ΔG (kcal/mol), (middle) enthalpy ΔH (kcal/mol), and (right) entropy −TΔS (kcal/mol). The distances between paired hydration sites are color coded according to the color bar.
While high correlations for the enthalpy and free energy values of the 20 ns simulations were achieved already with using the 1 ns trajectories, a comparable correlation for the entropy values between these two time-points was rather low (Figure 1A). With only one exception, the entropy values obtained throughout the 1 ns simulations are generally larger than those of the 20 ns simulations. This is most likely due to insufficient sampling at shorter simulation lengths overestimating the entropy loss upon binding into the binding site (cf. eq 3). With increasing simulation length, the correlation for the entropy values quickly improves, reaching an R2 value of 0.9 at 2.5 ns (the R2 values of enthalpy and free energy are 0.9 or larger for all comparisons; Figure 1B). The greater than 0.95 R2 values of the 4 ns versus 20 ns comparison (Figure 1C, 0.96 for entropy, 0.98 for enthalpy, and 0.98 for free energy) indicate that 4 ns seems to be sufficient to generate converged thermodynamic profiles for all hydration sites (see the Supporting Information for the other time points) compared to the 20 ns reference simulation. Therefore, we decided to use a simulation length of 4 ns for the rest of this study.
Sensitivity of Hydration Site Prediction on Initial Protein Structure
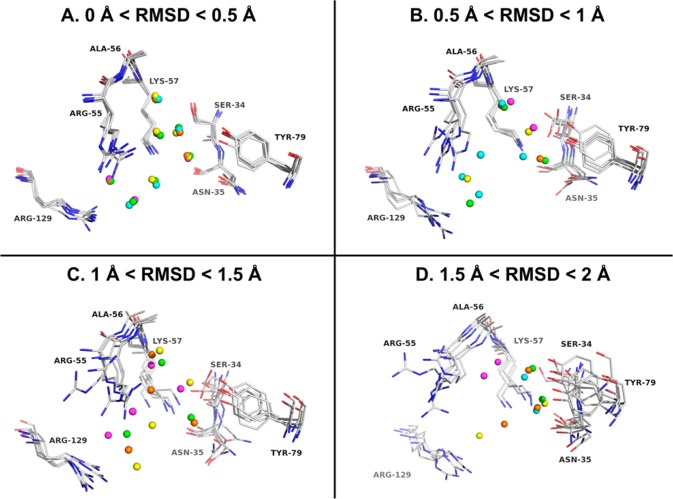
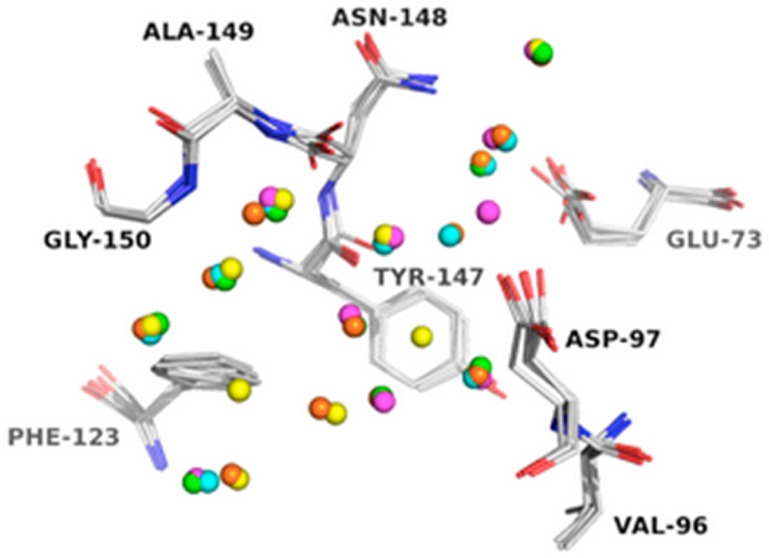
In the second part of our study, we investigated if the starting conformations of a protein system for MD simulations have significant influence on the prediction of hydration sites. We hypothesized that the conformations of the binding site residues influence the prediction of the position and thermodynamic profile of hydration sites. Thus, for each protein system, we constructed four RMSD groups of conformations representing different levels of binding site similarity as described in the Materials and Methods section. Then, within each RMSD group, the five sets of predicted hydration sites were aligned. A superimposition of those hydration sites for PLP (PDB: 2AQ6) is displayed in Figure 2. The hydration sites are colored for different initial protein conformation (see Supporting Information S2–S4 for the corresponding results for the other three protein systems used in our study). The predicted locations of hydration sites using the least variant initial structures (RMSD 0–0.5 Å) are quite similar (Figure 2A), while the positions of hydration sites overlap less with increasing RMSD (Figure 2B–D).
Figure 2.
Four sets of overlaid hydration sites in the binding site of pyridoxine 5′-phosphate oxidase (PDB: 2AQ6): (A) 0 < RMSD < 0.5 Å; (B) 0.5 < RMSD < 1 Å; (C) 1 < RMSD < 1.5 Å; (D) 1.5 < RMSD < 2 Å. For clarity, only hydration sites within 1 Å to any atoms of the ligand are shown. The hydration sites are colored differently for different initial protein conformations.
To quantitatively analyze how similar the hydration sites are predicted in each RMSD group, pairwise hydration site comparisons were carried out within each RMSD group, resulting in 10 pairwise comparisons per RMSD group. For each comparison, we identified paired hydration sites and calculated the percentage of paired hydration sites from all predicted hydration sites. This distribution of paired hydration sites for all four protein systems is displayed in the form of a boxplot graph for each RMSD group in Figure 3. As expected, more paired hydration sites were found in the group with smaller conformational variation than those with larger initial RMSD. On average more than 80% of all hydration sites have similar locations when the starting protein structures are very similar (RMSD 0–0.5 Å), while only about a third of the hydration sites have similar locations if the starting structures deviate by 1–1.5 Å RMSD. This demonstrates the high sensitivity of WATsite and likely other MD-based hydration site programs on the starting protein structure.
Figure 3.
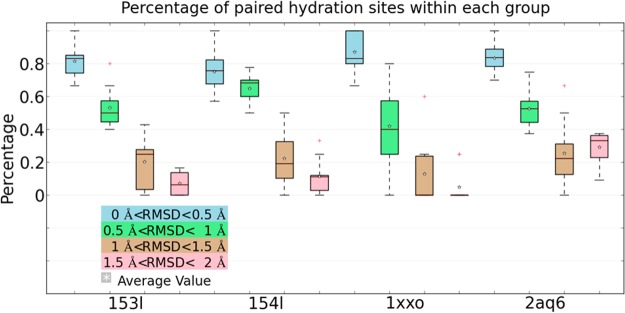
Percentage of paired hydration sites out of all predicted hydration sites found in different RMSD groups of each protein system.
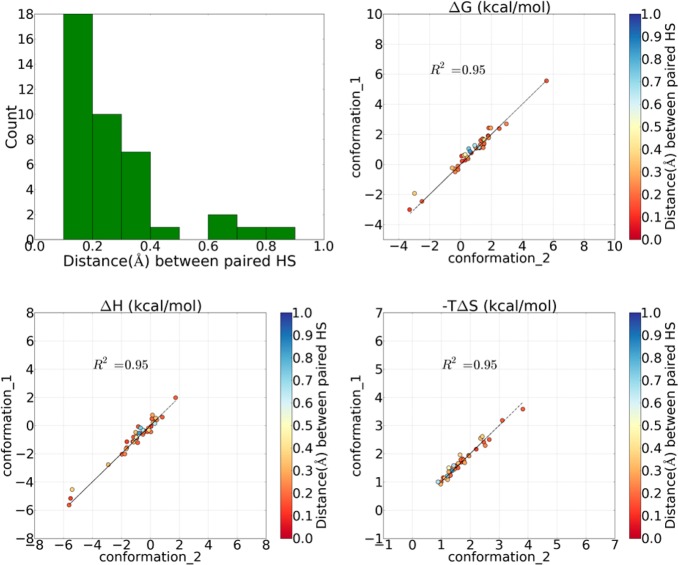
We also analyzed how similar the estimated free energy values were for the paired hydration sites. After the pairs of hydration sites were identified, the distances between paired hydration sites were distributed into bins with a size of 0.1 Å. One example is shown in Figure 4. Most pairs of hydration sites have well conserved locations with a distance smaller than 0.5 Å (Figure 4). Only a few hydration sites demonstrate a larger deviation. Also the correlation of the energy values of two different simulations was plotted in Figure 4 for one randomly selected pair of comparisons for GEWL (PDB: 154L) from the group 0 < RMSD < 0.5 Å. Examples for such comparisons of the other three systems can be found in the Supporting Information (S5–S7). As the high R2 indicates, the desolvation free energy of paired hydration sites estimated from similar initial protein conformations correlate well with each other.
Figure 4.
Pairwise comparison between two trials of simulations within the 0 < RMSD < 0.5 Å group of goose lysozyme (PDB: 154L).
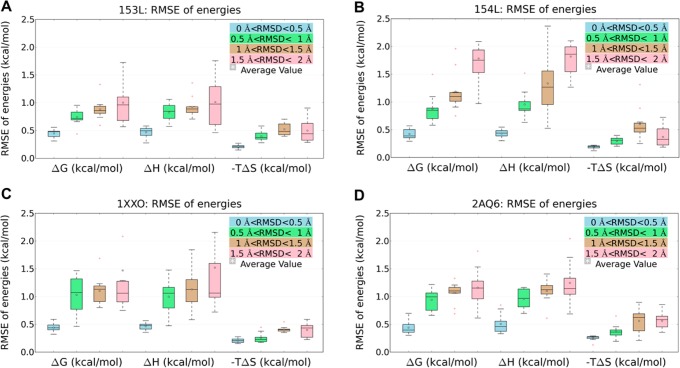
To quantitatively analyze the similarity of all five sets of hydration sites in each RMSD group, the root-mean-square error (RMSE) for each thermodynamic property of interest (ΔG, ΔH, −TΔS) was calculated for any two comparisons. The distribution of RMSE values of all pairwise comparisons for each protein system was obtained and is displayed in form of boxplots in Figure 5. Within the group with most similar starting conformations (0 < RMSD < 0.5 Å), all individual MD simulations generate consistent estimates of enthalpy, entropy, and free energy independent of the starting structure. The RMSE for entropy is relatively small compared to the other two properties due to the small range of entropy values. In general, as the RMSD increases, the values of RMSE significantly increase due to the conformational variations of binding site residues, but the strength of dependency is system dependent.
Figure 5.
RMSE distribution of thermodynamic properties (ΔG, ΔH, −TΔS) for four RMSD groups representing different similarity levels: (A) GEWL system (apo, PDB: 153L); (B) GEWL system (holo, PDB: 154L); (C) PLP system (apo, PDB: 1XXO); (D) PLP system (holo, PDB: 2AQ6).
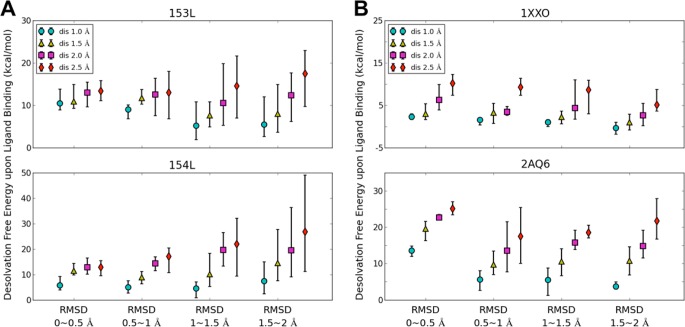
Finally, we studied the effect of different initial protein structures on the estimation of desolvation free energy of the protein upon ligand binding. This quantity is computed as described in the Materials and Methods section. Different distance cutoffs between hydration site and the crystal ligands’ heavy atoms were chosen to identify those hydration sites that are replaced upon ligand binding. Distance cutoffs of 1.0, 1.5, 2.0, and 2.5 Å were chosen. The sum of the free energies of these hydration sites provides an estimate for the desolvation free energy of the protein for each ligand. Thus, for each RMSD group we computed the desolvation free energy for all five sets of predicted hydration sites. The maximum, minimum, and average values of the five desolvation energies for each RMSD group are plotted in Figure 6. MD simulations of the group with the smallest conformational variation (RMSD < 0.5 Å) estimate the desolvation energies consistently. Furthermore, with increasing distance cutoff, more hydration sites are considered to be replaced upon ligand binding and therefore result in larger desolvation energies. Finally and not surprisingly, larger variation in the predicted desolvation free energies can be observed for the groups with more diverse initial protein structures compared to more similar initial protein conformations. Whereas the standard error for the group with RMSD < 0.5 Å is on average 0.84 kcal/mol, it is on average 2.10 kcal/mol for the group with RMSD between 1.5 and 2.0 Å.
Figure 6.
Variation of desolvation free energy involved in replacing water molecules upon ligand binding for four RMSD groups using different distance cutoff values: (A) goose egg-white lysozyme system (GEWL) (PDB: 153L, 154L). (B) pyridoxine 5′-phosphate oxidase system (PLP) (PDB: 1XXO, 2AQ6).
Conclusion
Our study suggests that the locations and thermodynamic properties of hydration sites can be reliably predicted using an MD simulation with a length of only 4 ns, which provides similar hydration site data compared to those of longer 20 ns simulations.
Our study also demonstrates that the conformations of binding site residues significantly influence the prediction of hydration site locations and thermodynamic profiles and thus the desolvation free energies associated with replacing water molecules upon ligand binding. The predicted locations of hydration sites, and the computed free energies for all paired hydration sites are only consistent if the binding site residues have similar conformations (RMSD < 0.5 Å). More than 80% of the hydration sites have similar locations if the structures of the binding site are similar (RMSD 0–0.5 Å), but this percentage declined significantly with increasing deviations in the starting protein conformations. Thus, our study provides guidance on how similar protein structures need to be in order to obtain consistent hydration site predictions.
This sensitivity has important implications in drug discovery although it is typically not sufficiently considered by practitioners in the field. Often a limited set of X-ray structures with different types of ligands for a target protein is available. Furthermore, sometimes protein structures are significantly different dependent on the bound ligand. Thus, the question arises if a holo crystal structure for one lead compound can be used to predict hydration sites and use those for analysis of another lead series. Or can an apo structure be useful for hydration site prediction for a ligand-bound form of the same protein? The results of our study provide a first guidance to users of MD-based hydration-site programs with respect to those questions.
An alternative grid-based approach, the grid inhomogeneous solvation theory (GIST) has been recently designed40 potentially overcoming some of the observed sensitivity of the hydration site approaches. GIST computes desolvation energies on individual grid points covering the binding site of the protein. For different protein conformations, different water density contours and different desolvation energies are likely to be observed in GIST, too. However, GIST does not require a definition of hydration site. For localized high water density spots, hydration sites can be reliably predicted using clustering techniques. In those cases, conformational changes in the protein are equally resembled in positional changes in the high density spots and the representing hydration sites. For areas in the binding site with less pronounced water density peaks, e.g. more mobile water molecules, the definition of the hydration sites is sensitive to the clustering algorithm. As a consequence, small conformational changes of the protein can result in quite different hydration site positions. This may be a case where grid-based approaches could have advantages as the sensitivity of the clustering algorithm on small changes in nonlocalized water density is removed from the analysis. It would be interesting to perform studies similar to ours using those grid-based approaches to validate or falsify the hypothesis that grid-based approaches may be less susceptible to conformational differences in protein structure.
Whereas the influence of protein conformation on hydration site location and profiling is not surprising, our study provides a first quantification of this effect. To incorporate protein flexibility into hydration site prediction, two simple approaches could be thought of. First, unrestrained MD simulations with explicit water molecules could be performed, and the trajectory can be clustered. The clustering procedure will generate clusters of similar protein structures (e.g., with RMSD < 0.5 Å between structures of each cluster). Since the protein structures within a cluster are similar any frame could be used as reference for alignment, and subsequently hydration sites would be predicted for each cluster or “sub-trajectory” separately. Second, alternative protein conformation could be generated first using MD simulations and clustering, and subsequent simulations with position restraint on protein atoms could be performed for each protein conformation to obtain hydration site information. The latter has been adopted in this study. In both scenarios, clustering of MD snapshots has to be performed to separate alternative conformations for separate hydration site analysis. Our study provides a first guideline on the cluster size that should be chosen to obtain consistent hydration site predictions. Our data suggests that very narrow clusters seem to be required to obtain consistent estimates for hydration site locations, thermodynamic profiles and therefore protein desolvation energies. Even protein conformations that deviate about 1 Å in RMSD can result in an average of 6.1 kcal/mol variations in desolvation estimates.
Acknowledgments
We thank Gregory Wilson and Christopher Thiebaut for critical reading of the manuscript. The authors gratefully acknowledge a grant from the NIH (GM092855) for partially supporting this research.
Supporting Information Available
Correlation of energy values of the paired hydration sites between those obtained from the 20 ns MD simulations and those obtained from shorter simulation lengths (1.5, 2, 3, 5, 10 ns); superimposition of hydration sites in the binding site of pyridoxine 5′-phosphate oxidase (PDB: 1XXO); superimposition of hydration sites in the binding site of goose egg-white lysozyme (PDB: 153L); superimposition of hydration sites in the binding site of goose lysozyme (PDB: 154L); pairwise comparison between two different simulations of goose lysozyme apo structure (PDB: 153L); pairwise comparison between two different simulations of pyridoxine 5′-phosphate oxidase (PDB: 1XXO); pairwise comparison between two different simulations of pyridoxine 5′-phosphate oxidase (PDB: 2AQ6). This material is available free of charge via the Internet at http://pubs.acs.org
The authors declare no competing financial interest.
Funding Statement
National Institutes of Health, United States
Supplementary Material
References
- Ladbury J. E. Just Add Water! The Effect of Water on the Specificity of Protein-Ligand Binding Sites and its Potential Application to Drug Design. Chem. Biol. 1996, 3, 973–980. [DOI] [PubMed] [Google Scholar]
- Baron R.; Setny P.; McCammon J. A. Water in Cavity-ligand Recognition. J. Am. Chem. Soc. 2010, 132, 12091–12097. [DOI] [PMC free article] [PubMed] [Google Scholar]
- Hummer G. Molecular Binding: Under Water’s Influence. Nat. Chem. 2010, 2, 906–907. [DOI] [PMC free article] [PubMed] [Google Scholar]
- Snyder P. W.; Mecinovic J.; Moustakas D. T.; Thomas S. W. 3rd; Harder M.; Mack E. T.; Lockett M. R.; Heroux A.; Sherman W.; Whitesides G. M. Mechanism of the Hydrophobic Effect in the Biomolecular Recognition of Arylsulfonamides by Carbonic Anhydrase. Proc. Natl. Acad. Sci. U.S.A. 2011, 108, 17889–17894. [DOI] [PMC free article] [PubMed] [Google Scholar]
- Baron R.; Setny P.; Paesani F. Water Structure, Dynamics, and Spectral Signatures: Changes upon Model Cavity-ligand Recognition. J. Phys. Chem. B 2012, 116, 13774–13780. [DOI] [PubMed] [Google Scholar]
- Breiten B.; Lockett M. R.; Sherman W.; Fujita S.; Al-Sayah M.; Lange H.; Bowers C. M.; Heroux A.; Krilov G.; Whitesides G. M. Water Networks Contribute to Enthalpy/Entropy Compensation in Protein-Ligand Binding. J. Am. Chem. Soc. 2013, 135, 15579–15584. [DOI] [PubMed] [Google Scholar]
- Lam P. Y. S.; Jadhav P. K.; Eyermann C. J.; Hodge C. N.; Ru Y.; Bacheler L. T.; Meek J. L.; Otto M. J.; Rayner M. M.; Wong Y. N.; Chang C. H.; Weber P. C.; Jackson D. A.; Sharpe T. R.; Ericksonviitanen S. Rational Design of Potent, Bioavailable, Nonpeptide Cyclic Ureas as Hiv Protease Inhibitors. Science 1994, 263, 380–384. [DOI] [PubMed] [Google Scholar]
- Chen J. M.; Xu S. L.; Wawrzak Z.; Basarab G. S.; Jordan D. B. Structure-based Design of Potent Inhibitors of Scytalone Dehydratase: Displacement of a Water Molecule from the Active Site. Biochemistry 1998, 37, 17735–17744. [DOI] [PubMed] [Google Scholar]
- Wissner A.; Berger D. M.; Boschelli D. H.; Floyd M. B. Jr.; Greenberger L. M.; Gruber B. C.; Johnson B. D.; Mamuya N.; Nilakantan R.; Reich M. F.; Shen R.; Tsou H. R.; Upeslacis E.; Wang Y. F.; Wu B.; Ye F.; Zhang N. 4-Anilino-6,7-Dialkoxyquinoline-3-Carbonitrile Inhibitors of Epidermal Growth Factor Receptor Kinase and their Bioisosteric Relationship to the 4-Anilino-6,7-Dialkoxyquinazoline Inhibitors. J. Med. Chem. 2000, 43, 3244–3256. [DOI] [PubMed] [Google Scholar]
- Li Z.; Lazaridis T. Thermodynamics of Buried Water Clusters at a Protein-ligand Binding Interface. J. Phys. Chem. B 2006, 110, 1464–1475. [DOI] [PubMed] [Google Scholar]
- Mancera R. L. Molecular Modeling of Hydration in Drug Design. Curr. Opin Drug Discov. Dev. 2007, 10, 275–280. [PubMed] [Google Scholar]
- Haider K.; Huggins D. J. Combining Solvent Thermodynamic Profiles with Functionality Maps of the Hsp90 Binding Site to Predict the Displacement of Water Molecules. J. Chem. Inf. Model. 2013, 53, 2571–2586. [DOI] [PMC free article] [PubMed] [Google Scholar]
- Clarke C.; Woods R. J.; Gluska J.; Cooper A.; Nutley M. A.; Boons G. J. Involvement of Water in Carbohydrate-protein Binding. J. Am. Chem. Soc. 2001, 123, 12238–12247. [DOI] [PubMed] [Google Scholar]
- Michel J.; Tirado-Rives J.; Jorgensen W. L. Energetics of Displacing Water Molecules from Protein Binding Sites: Consequences for Ligand Optimization. J. Am. Chem. Soc. 2009, 131, 15403–15411. [DOI] [PMC free article] [PubMed] [Google Scholar]
- Goodford P. J. A Computational-Procedure for Determining Energetically Favorable Binding-Sites on Biologically Important Macromolecules. J. Med. Chem. 1985, 28, 849–857. [DOI] [PubMed] [Google Scholar]
- Goodfellow J. M.; Vovelle F. Biomolecular Energy Calculations Using Transputer Technology. European Biophysics Journal with Biophysics Letters 1989, 17, 167–172. [DOI] [PubMed] [Google Scholar]
- Pitt W. R.; Goodfellow J. M. Modeling of Solvent Positions around Polar Groups in Proteins. Protein Eng. 1991, 4, 531–537. [DOI] [PubMed] [Google Scholar]
- Verdonk M. L.; Cole J. C.; Taylor R. SuperStar: A knowledge-based Approach for Identifying Interaction Sites in Proteins. J. Mol. Biol. 1999, 289, 1093–1108. [DOI] [PubMed] [Google Scholar]
- Rossato G.; Ernst B.; Vedani A.; Smiesko M. AcquaAlta: A Directional Approach to the Solvation of Ligand-Protein Complexes. J. Chem. Inf. Model. 2011, 51, 1867–1881. [DOI] [PubMed] [Google Scholar]
- Imai T.; Hiraoka R.; Kovalenko A.; Hirata F. Locating Missing Water Molecules in Protein Cavities by the Three-dimensional Reference Interaction Site Model Theory of Molecular Solvation. Proteins–Structure Function and Bioinformatics 2007, 66, 804–813. [DOI] [PubMed] [Google Scholar]
- Ross G. A.; Morris G. M.; Biggin P. C. Rapid and Accurate Prediction and Scoring of Water Molecules in Protein Binding Sites. PLoS One 2012, 7, e32036. [DOI] [PMC free article] [PubMed] [Google Scholar]
- Lazaridis T. Inhomogeneous Fluid Approach to Solvation Thermodynamics. 2. Applications to Simple Fluids. J. Phys. Chem. B 1998, 102, 3542–3550. [Google Scholar]
- Lazaridis T. Inhomogeneous Fluid Approach to Solvation Thermodynamics. 1. Theory. J. Phys. Chem. B 1998, 102, 3531–3541. [Google Scholar]
- Abel R.; Young T.; Farid R.; Berne B. J.; Friesner R. A. Role of the Active-site Solvent in the Thermodynamics of Factor Xa Ligand Binding. J. Am. Chem. Soc. 2008, 130, 2817–2831. [DOI] [PMC free article] [PubMed] [Google Scholar]
- Hu B.; Lill M. A. Protein Pharmacophore Selection using Hydration-site Analysis. J. Chem. Inf. Model. 2012, 52, 1046–1060. [DOI] [PMC free article] [PubMed] [Google Scholar]
- Hu B.; Lill M. A. Watsite: Hydration Site Prediction Program with Pymol Interface. J. Comput. Chem. 2014, 35, 1255–1260. [DOI] [PMC free article] [PubMed] [Google Scholar]
- Zhou Z.; Joos B. Convergence Issues in Molecular Dynamics Simulations of Highly Entropic Materials. Modell. Simul. Mater. Sci. Eng. 1999, 7, 383–395. [Google Scholar]
- Genheden S.; Akke M.; Ryde U. Conformational Entropies and Order Parameters: Convergence, Reproducibility, and Transferability. J. Chem. Theory Comput. 2014, 10, 432–438. [DOI] [PubMed] [Google Scholar]
- Weaver L. H.; Grutter M. G.; Matthews B. W. The Refined Structures of Goose Lysozyme and Its Complex with a Bound Trisaccharide Show That the Goose-Type Lysozymes Lack a Catalytic Aspartate Residue. J. Mol. Biol. 1995, 245, 54–68. [DOI] [PubMed] [Google Scholar]
- Pedelacq J. D.; Rho B. S.; Kim C. Y.; Waldo G. S.; Lekin T. P.; Segelke B. W.; Rupp B.; Hung L. W.; Kim S. I.; Terwilliger T. C. Crystal Structure of a Putative Pyridoxine 5 ′-phosphate Oxidase (Rv2607) from Mycobacterium Tuberculosis. Proteins 2006, 62, 563–569. [DOI] [PubMed] [Google Scholar]
- Word J. M.; Lovell S. C.; Richardson J. S.; Richardson D. C. Asparagine and Glutamine: Using Hydrogen Atom Contacts in the Choice of Side-chain Amide Orientation. J. Mol. Biol. 1999, 285, 1735–1747. [DOI] [PubMed] [Google Scholar]
- Berendsen H.; Postma J.; Van Gunsteren W.; Hermans J. Interaction Models for Water in Relation to Protein Hydration. Intermol. Forces 1981, 331, 331–341. [Google Scholar]
- Lindahl E.; Hess B.; Van Der Spoel D. GROMACS 3.0: A Package for Molecular Simulation and Trajectory Analysis. J. Mol. Model. 2001, 7, 306–317. [Google Scholar]
- Nose S. A Molecular-Dynamics Method for Simulations in the Canonical Ensemble. Mol. Phys. 1984, 52, 255–268. [Google Scholar]
- Hoover W. G. Canonical Dynamics - Equilibrium Phase-Space Distributions. Phys. Rev. A 1985, 31, 1695–1697. [DOI] [PubMed] [Google Scholar]
- Parrinello M.; Rahman A. Polymorphic Transitions in Single-Crystals - a New Molecular-Dynamics Method. J. Appl. Phys. 1981, 52, 7182–7190. [Google Scholar]
- Darden T.; York D.; Pedersen L. Particle Mesh Ewald - an NLog(N) Method for Ewald Sums in Large Systems. J. Chem. Phys. 1993, 98, 10089–10092. [Google Scholar]
- Essmann U.; Perera L.; Berkowitz M. L.; Darden T.; Lee H.; Pedersen L. G. A Smooth Particle Mesh Ewald Method. J. Chem. Phys. 1995, 103, 8577–8593. [Google Scholar]
- Minh D. D. L.; Bui J. M.; Chang C. E.; Jain T.; Swanson J. M. J.; McCammon J. A. The Entropic Cost of Protein-Protein Association: A Case Study on Acetylcholinesterase Binding to Fasciculin-2. Biophys. J. 2005, 89, L25–L27. [DOI] [PMC free article] [PubMed] [Google Scholar]
- Nguyen C. N.; Young T. K.; Gilson M. K. Grid Inhomogeneous Solvation Theory: Hydration Structure and Thermodynamics of the Miniature Receptor Cucurbit[7]Uril. J. Chem. Phys. 2012, 137, 149901. [DOI] [PMC free article] [PubMed] [Google Scholar]
Associated Data
This section collects any data citations, data availability statements, or supplementary materials included in this article.


