Abstract
Myocardial fibrosis detected via delayed-enhanced magnetic resonance imaging (MRI) has been shown to be a strong indicator for ventricular tachycardia (VT) inducibility. However, little is known regarding how inducibility is affected by the details of the fibrosis extent, morphology, and border zone configuration. The objective of this article is to systematically study the arrhythmogenic effects of fibrosis geometry and extent, specifically on VT inducibility and maintenance. We present a set of methods for constructing patient-specific computational models of human ventricles using in vivo MRI data for patients suffering from hypertension, hypercholesterolemia, and chronic myocardial infarction. Additional synthesized models with morphologically varied extents of fibrosis and gray zone (GZ) distribution were derived to study the alterations in the arrhythmia induction and reentry patterns. Detailed electrophysiological simulations demonstrated that (1) VT morphology was highly dependent on the extent of fibrosis, which acts as a structural substrate, (2) reentry tended to be anchored to the fibrosis edges and showed transmural conduction of activations through narrow channels formed within fibrosis, and (3) increasing the extent of GZ within fibrosis tended to destabilize the structural reentry sites and aggravate the VT as compared to fibrotic regions of the same size and shape but with lower or no GZ. The approach and findings represent a significant step toward patient-specific cardiac modeling as a reliable tool for VT prediction and management of the patient. Sensitivities to approximation nuances in the modeling of structural pathology by image-based reconstruction techniques are also implicated.
Keywords: image-based 3D ventricular modeling, cardiac MRI, ventricular tachycardia, arrhythmia
Introduction
Sudden cardiac death (SCD) continues to be the leading cause of natural death in Western countries, most often caused by ventricular tachyarrhythmias in the setting of structural heart disease.1 Ventricular tachycardia (VT), a potential life-threatening arrhythmia characterized by a regular accelerated heart rhythm over 100 beats per minute, is commonly encountered in individuals who have previously suffered a myocardial infarction (MI). Most common treatments of ventricular arrhythmias include implantable cardioverter-defibrillator (ICD), antiarrhythmic medications, and/or catheter ablation procedure. However, the exact role of structural remodeling of the ventricular tissue as an arrhythmogenic substrate is poorly understood. Thus, research through noninvasive, virtual computerized modeling and simulation has substantial implications toward better understanding and prediction of underlying arrhythmogenic mechanisms.
Over the last two decades, magnetic resonance imaging (MRI) has emerged as an excellent tool to characterize cardiac morphology and function.2 It offers a noninvasive means to visualize internal anatomical structures and functionality, greatly enhancing the capability of correct diagnosis, treatment, surgical planning, and monitoring disease progression over time. To heighten saliency of infarct or fibrotic myocardial tissue, a contrast agent such as gadolinium is introduced into the bloodstream. Functional, or cine, sequences are acquired before contrast agent administration. Delayed enhancement (DE) series is acquired near end-diastole in the same position and orientation a few minutes later. In this image series, the infarct myocardial tissue displays bright/high intensity patterns (Fig. 1, panels A and B) because of the delayed wash out of the contrast from the interstitial fibrotic tissue compared to normal (dark) myocardium. These images are instrumental in providing viability assessment, surgical planning, and therapy strategies, especially in the context of VT.3–6
Figure 1.
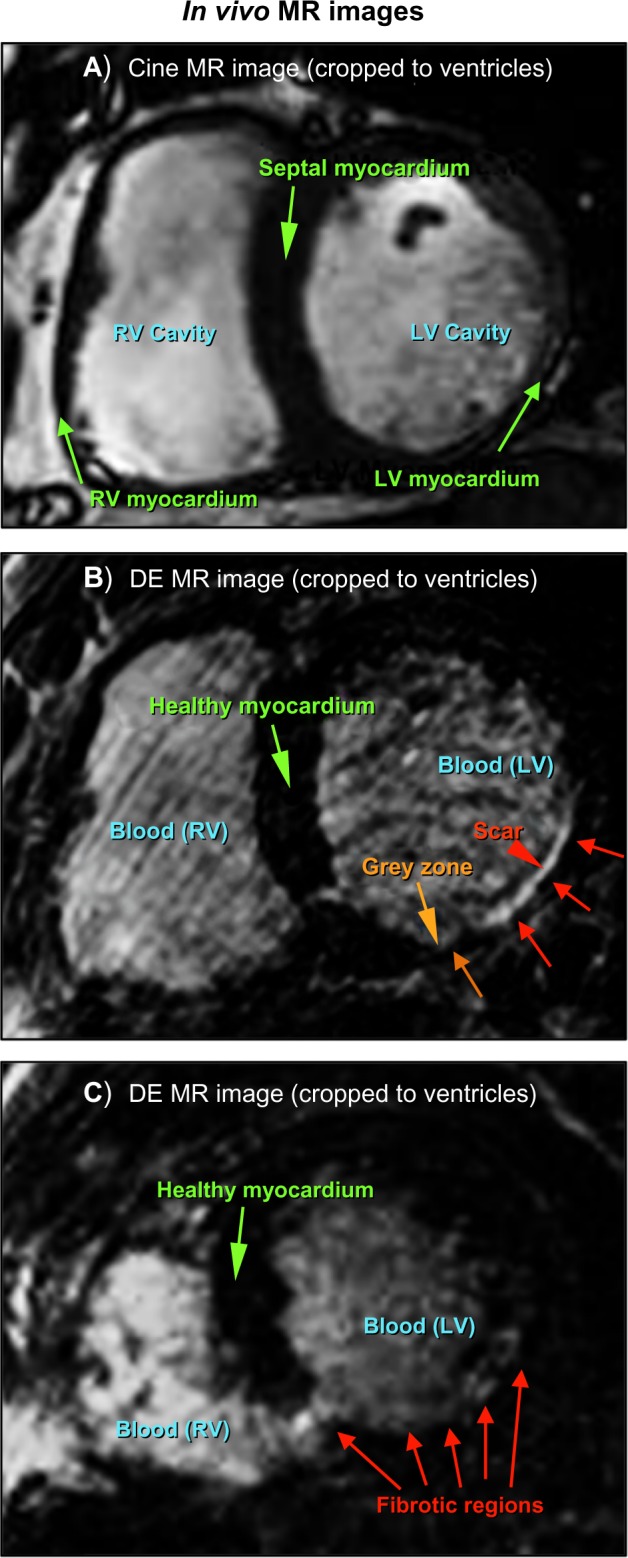
Short axis in vivo MRI slices (cropped to ROI around heart): (A) functional (cine) cardiac at end-diastole, (B) analogous delayed-enhanced image with enhanced fibrotic tissue in LV myocardium, indicated by arrows, and (C) Short axis in vivo DE-MRI slice illustrating a case of difficult scar delineation.
There has been increased investigation into the role of peri-infarct “border zones” surrounding necrotic scar with regard to VT.7–13 These regions are often referred to as gray zones (GZs) because of their relative gray level intensity versus the whiter appearance of infarct regions in DE-MRI. However, segmenting areas of scar and GZ from DE-MRI is a challenging problem, both manually and with computer assistance.2,14–16 Poor contrast between the nonviable tissue, cavities, and pericardium promotes fallibility. Furthermore, the acquisition of a high-resolution DE sequence takes at least 10–20 minutes. As the contrast agent begins washing out during this time, the fidelity of the intensity values within the scar may decline. Figure 1, panel C, illustrates that it is often very difficult to differentiate between scar regions and adjacent components of similar intensity (here, the left ventricle (LV) cavity, as well as heterogeneity within the fibrosis itself).
Nonetheless, characterization of these heterogeneous regions has been shown to be a strong predictor of post-MI mortality,7 VT incidence,8 and VT susceptibility.9 Based on this evidence, recent approaches have aimed at investigating the potential of MRI as a noninvasive tool to be integrated into VT ablation procedures. Using swine hearts, Estner et al. demonstrated that GZ existence and extent in MRI is a powerful predictor for successful arrhythmogenic ablation sites.10 Arevalo et al. reached a similar conclusion utilizing synthesized heterogeneous characteristics in a canine cardiac geometry.11 In human patients, Andreu et al. were able to identify 81% of the voltage channels found by electroanatomical voltage mapping (EAM) using MRI, based on testing proper intensity cutoffs between core scar and GZ.12 Similarly, Perez-David et al. demonstrated a significant correlation between slow VT conduction channels and GZ, a finding that may also facilitate ablation procedures.13
In addition to moving toward improved determination of VT risk in patients, these findings implicate the potential of MRI as a noninvasive alternative means to EAM to accurately predict reentrant VT channels and to ultimately guide VT ablation in the future.17 To accomplish this ambitious aim, there remains work to understand the underlying mechanisms that contribute to the correlation between VTs and structural pathologies such as fibrosis. This includes how VTs relate to the size and distribution of the scar region, including extent of GZ within the scar.
The objective of this article is twofold. First, we present a set of methods that we have developed for constructing realistic computational models of the heart using in vivo human patient data. Second, we demonstrate the use of the models to systematically study arrhythmogenic mechanisms, specifically VT inducibility and maintenance, at varying composition, morphologies, and extents of fibrosis and GZ. Sensitivity analyses to changes in these compositions are also evaluated. The approach represents a significant step toward using patient-specific cardiac modeling as a reliable predictive tool to understand VT-related mechanisms. The rest of this paper is organized as follows: Section 2 outlines the materials and methods used in this work, while Section 3 presents and analyzes the results. Section 4 offers a discussion with future outlooks, and Section 5 concludes the paper.
Materials and Methods
Data acquisition
The data used in this study were acquired at Centro Nacional de Investigaciones Cardiovasculares (CNIC), Spain, on two patients suffering from chronic MI. A comprehensive MRI study was performed on each patient, with dedicated sequences evaluating cardiac function and myocardial necrosis/fibrosis. All the scans were performed on a 3.0 Tesla magnet (Achieva Tx®, Best, The Netherlands), with vector cardiographic gating and a dedicated cardiac 32-channel phased-array surface coil. All the two-dimensional sequences were acquired during expiration breath-hold mode. Three-dimensional sequences were acquired in free breathing mode. The protocol and consent procedure were approved by the institutional ethics review committee in accordance with European guidelines for good clinical practice.
Functional images
After acquiring standard localizer images, contiguous short-axis slices to cover the whole LV were prescribed. First, a balanced turbo field echo with sensitivity encoding fast parallel imaging technique (B-TFE, SENSE) sequence was performed for functional cine imaging. Typical parameters were: repetition time (TR) 2.7, echo time (TE) 1.34, flip angle 40°, SENSE 1.8, averages 1, cardiac phases 30, slices 13, slice thickness 8 mm, gap 0 mm, field of view (FOV) 380 × 380 mm, voxel size 1.6 × 2 mm (reconstructed to an image resolution of 1.19 × 1.19 mm in the final image).
2D DE images
DE imaging to assess fibrotic tissue was performed using a T1-weighted 2D segmented inversion recovery gradient-echo sequence (2D IR-TFE). These images were acquired 20 minutes after the intravenous administration of 0.2 mmol/kg of gadolinium contrast: Magnevist® (gadopentetate dimeglumine). Short-axis slices matched precisely with functional imaging slices. Parameters used for acquisition were: TR/TE 5.2/2.5, TI 270 (optimized by look-locker acquisition to ensure nulled signal of normal myocardium), flip angle 25°, TFE factor 35, averages 3, slices 13, slice thickness 8 mm, gap 0, FOV: 380 × 380 mm, voxel size 1.5 × 1.5 mm (reconstructed to an image resolution of 0.62 × 0.62 × 8 mm, resulting in 640 × 640 pixels in the final image). Inversion pulses were applied every RR interval.
3D DE images
Three-dimensional DE images were acquired using a T1-weighted 3D phase sensitive inversion recovery (PSIR) gradient-echo sequence (3D PSIR-TFE). Images were acquired 7 minutes after contrast administration. This free-breathing sequence used a prospective cardiac synchronization and a “gating and tracking” respiratory navigator. The main parameters were: TR/TE 4.2/1.96, TI 270 (optimized by look-locker acquisition to ensure nulled signal of normal myocardium), flip angle 15°, TFE factor 47, averages 1. SENSE parallel acquisition factor 1.7. SPIR fat suppression. FOV: 340 × 340 × 100 (adjusted to patient’s heart size). Voxel size 1.5 × 1.5 × 1.5 mm (reconstructed to an image resolution of 0.71 × 0.71 × 0.75 mm, resulting in 480 × 480 pixels in plane in the final image).
Image segmentation
To generate image-based models of the ventricles, it is necessary to classify (or segment) the voxels in the MR images into different groups, such as normal tissue, fibrotic/infarct tissue, and background. Segmentation of cardiac images is a very challenging task because of the complex geometry and topology of the myocardium, movement artifacts from the acquisition process, blurred object boundaries in the images, and inhomogeneous image intensities between different voxel groups.2,18,19 While expert interpretation is considered the gold standard, manual delineation of image boundaries within MRI scans is a time-consuming and tedious process, especially since each MRI dataset can contain between 10 to a few hundred images depending on acquisition protocol. It is also fallible, and subject to inter- and intra-observer variation.
To accurately automate the process, our group has engineered two automated algorithms to segment the LV18 and the right ventricle (RV)19 from cardiac MRI. These algorithms were utilized here to segment the ventricular myocardium at end-diastolic (ED) phase from the functional cine images for each patient. Although the reader is referred to the studies of Ringenberg et al.18,19 for specific details, the automated process is summarized as follows.
The LV algorithm is executed first and processes slice-by-slice, beginning at the base of the ventricles. Since the beating heart displays the most movement artifacts in functional cardiac MRI, the end-systolic (ES) images are utilized to filter the ED images using phase subtraction. This allows precise localization of the heart in the images, and enables the automatic cropping of a region-of-interest (ROI) subvolume around the ventricles. Next, the image is convolved with a normalized difference of Gaussians (DoG) filter to effectively saturate the blood pools. This is followed by discretization and convex hull computation20 of the cavities in order to derive a fluid endocardial delineation. A binary edge map of the LV epicardium is then computed using gradient and statistical thresholding operations. Gradient vector flow (GVF) snakes21 are used to deform an initial contour based on the endocardial boundary to the map, effectively delineating the epicardial boundary. LV myocardial extraction is finalized by discretely classifying the pixels between the endocardium and epicardium.
The RV is also computed from base to apex. The basal-most slice is segmented first utilizing a similar DoG filtering strategy to that used in the LV to segment the cavity. Each proceeding slice utilizes a priori results from the previously segmented RV slice to create windowed boundary constraints to guide the segmentation. Within these constraints a threshold accumulator algorithm is applied to estimate the cavity boundaries. This result is correlated and refined with an algorithm utilizing optimal thresholding22 and DoG filtering. Additional morphological operations are performed in order to further refine the segmentation at each step in each slice. The epicardial boundary is derived by morphological dilation, based on statistical analysis of the mean RV wall thickness from a database of segmented MRI data. RV myocardial extraction is finalized by discretely classifying the pixels between the endocardium and epicardium. The composite ventricular segmentation is derived by taking the union of the LV and RV results.
3D reconstruction
Short-axis slices in in vivo cardiac MRI are generally ∼8 mm apart; therefore, reconstructing a 3D geometry is no trivial task as the missing information must be accurately approximated. We recently performed a comprehensive study to derive accurate reconstruction of ventricular anatomy from coarsely sliced data using open-source software CardioViz3D.23 The accuracy of the method was validated using synthesized course-resolution data against baseline high resolution diffusion tensor (DT) MRI data.24 Briefly, the reconstruction process consists of the following steps.
Variational implicit surfaces25 are used to seamlessly approximate a continuous 3D surface based on segmented landmarks from a volumized series of 2D images. In this work, the 2D images consisted of the segmented MRI slices for each patient. From these sets, the outline of each labeled region (ie, endocardium and epicardium of each LV and RV) is calculated, and landmark files are automatically generated. Using those landmarks, filled 3D surfaces are reconstructed for four surface regions, followed by conversion to 3D volumes. These four 3D volumes are then used as masking filters to derive a new volume, which includes the finalized ventricular geometry. The surface reconstruction and masking represents an original method derived to enable the most precise and effective utilization of the underlying variational implicit surfaces algorithm in approximating sharp boundaries such as the RV insertion points.
Mesh generation
The final 3D anatomical meshes for each patient were created using Avizo scientific software.26 Utilizing the volumetric model created using the above steps, the meshing is summarized in three steps: (1) A triangle surface rendering is first compiled using a marching cubes algorithm.27,28 (2) The rendered surface is then simplified, through an edge-collapsing algorithm, to reduce the number of triangle faces.29 (3) Lastly, a tetrahedral grid is used to construct a 3D finite element mesh (FEM), using an advancing front algorithm.30
Fiber mapping
Myocardial fiber orientations were incorporated into the model following the procedure presented by Vadakkumpadan et al.31 In summary, an atlas geometry derived from an ex vivo DTMR image of a normal human heart is registered to each of the models using a procedure requiring affine transformation followed by further deformation using large deformation diffeomorphic metric mapping (LDDMM).32,33 The deformation field is then applied to the atlas fiber orientations extracted from the DTMR image to obtain an estimate of the patient fiber orientations.
Baseline fibrosis extraction and model incorporation
In our LV segmentation work presented in Ringenberg et al.,18 we also present an automated technique for utilizing the segmented functional images as a mask registered to the corresponding 2D DE images to delineate the myocardium and extract fibrosis within the walls. In this work, the aim is to construct a much higher resolution model, which utilizes the 3D DE images from the two patients from whom image data were acquired. To do so, the model is first manually registered to the 3D DE image volume to properly align the ventricular voxels. Next, a threshold is manually dedicated within the walls based on expert observation to highlight the fibrosis within the images. Manual correction is employed where necessary based on expert guidance. Finally, the fibrotic voxels are homogeneously discretized and appropriately mapped to the point coordinates within the FEM model. Figure 2 illustrates the entire reconstruction process.
Figure 2.

Schematic showing major steps in the MRI-based cardiac reconstruction procedure.
Electrophysiological properties and simulation protocol
Cardiac electrical activity was described by the monodomain mathematical representation of cardiac tissue.34 Ion dynamics for the myocardium were described by the ten Tusscher model35 of human ventricular action potential. Ionic kinetics of the GZ were based on previous studies on infarcted canine hearts, which report the following reductions in individual current components: peak inward sodium current INa = 38%36; peak L-type calcium current ICaL = 31%37; and peak rectifier potassium currents38 IKr = 30% and IKs = 20%. Fibrosis was modeled as a passive resistor-capacitor (RC) tissue with a resting potential of −60 mV. Intercellular and extracellular conductivities were obtained from the experimental data of Clerc39: giy = 0.174, gix = 0.019, gey = 0.625, and gex = 0.236 S/m. Thus, the anisotropy ratio (ie, ratio of longitudinal to transverse conductivities) in the intracellular domain is 9.15, while in the extracellular domain it is 2.6. GZ conductivities were reduced to 25% of normal values, while infarct core was reduced to 5%. All the models were paced from apex at a cycle length of 500 ms (S1). VT was then induced by a quarter-LV stimulus (S2) on the inferior-lateral base at varying intervals. VT inducibility and reentry patterns were systematically studied at varying S1–S2 intervals.
All 3D simulations were executed using the CARP (CardioSolv, LLC, Grandville, MI) simulator40–42 on a distributed computing platform facility of the Ohio Supercomputing Center (OSC).
Creation of additional models to explore the effects of fibrosis morphology on VT inducibility
A variety of synthesized models were derived from the two baseline models with differing morphologies of the infarct core and GZ. The rationale was twofold. First, it will present important clinical insights into understanding the effect of fibrosis extent and GZ distribution on VT inducibility and reentry characteristics. Second, it will uncover variability tolerances in assigning fibrotic and GZ regions in MRI-derived models. This is an important implication, especially in the case of in vivo images, which pose challenges in accurate identification of fibrosis and classification of zones because of low resolution and motion artifacts.
To derive these synthesized models, the original fibrotic region (from the baseline model) was iteratively morphologically dilated in steps of 450 μm (the finite spatial resolution of each model), deriving 10 additional fibrosis layers. Similarly, eroded fibrosis models were generated by incrementally diminishing the original fibrotic region in steps of 450 μm until no more erosions can be made (ie, the eroded region diminishes to a size of zero). Figure 3 demonstrates a model with eroded fibrosis and a model with dilated fibrosis, in addition to a baseline model, for each patient.
Figure 3.
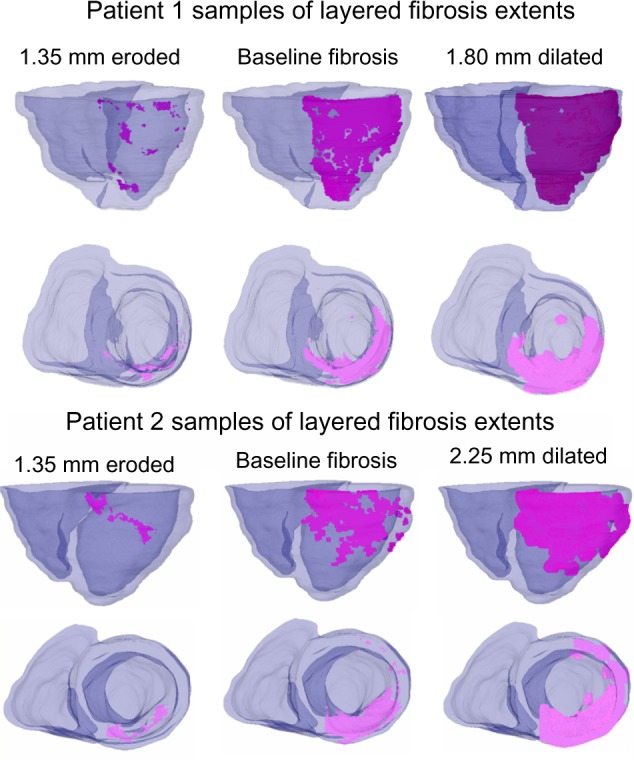
Examples of fibrosis extents on patient 1 and patient 2 baseline and morphologically derived models using the layered approach. Pictured models contain fibrosis core (no GZ). Fibrosis is highlighted in magenta.
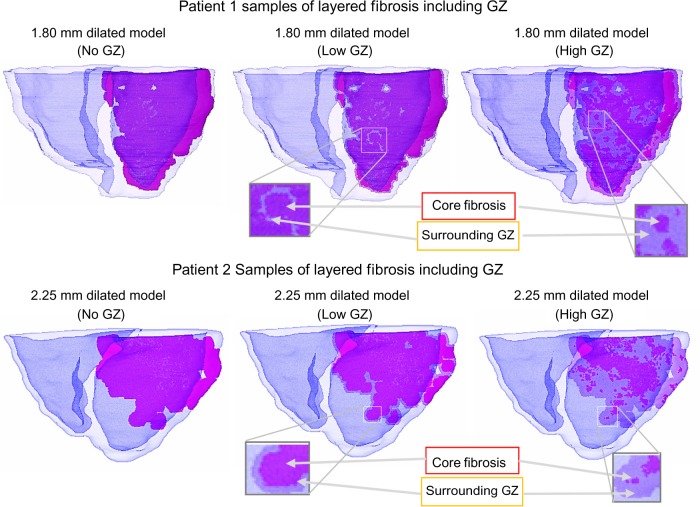
This process, in effect, created individual discretized fibrotic layers within the model, used for deriving additional synthesized models with different infarct core and GZ sizes and morphologies as follows. Volumes of each tagged layer and its enclosing region were computed. At each individual layer, unique synthesized models were created by (1) assigning the entire encompassed region as fibrosis core (no GZ model), (2) assigning the outer layers as GZ such that their summed volume did not exceed 25% of the entire pathological region (low GZ model), and (3) extending the GZ outer layers so that their summed volume composed at least – but as close to – 75% of the entire pathological region (high GZ model). Figure 4 illustrates a dilated model for each patient with differing levels of GZ.
Figure 4.
Examples of fibrosis extents on patient 1 and patient 2 baseline and morphologically derived models using the layered approach, with differing levels of GZ on sample dilated models. Fibrosis is highlighted in magenta, with surrounding GZ lightened.
Overall, from the two baseline models, 84 additional models with different morphologies of fibrosis and GZ regions were derived and analyzed based on the aforementioned simulation procedure.
Results
Baseline VT characteristics
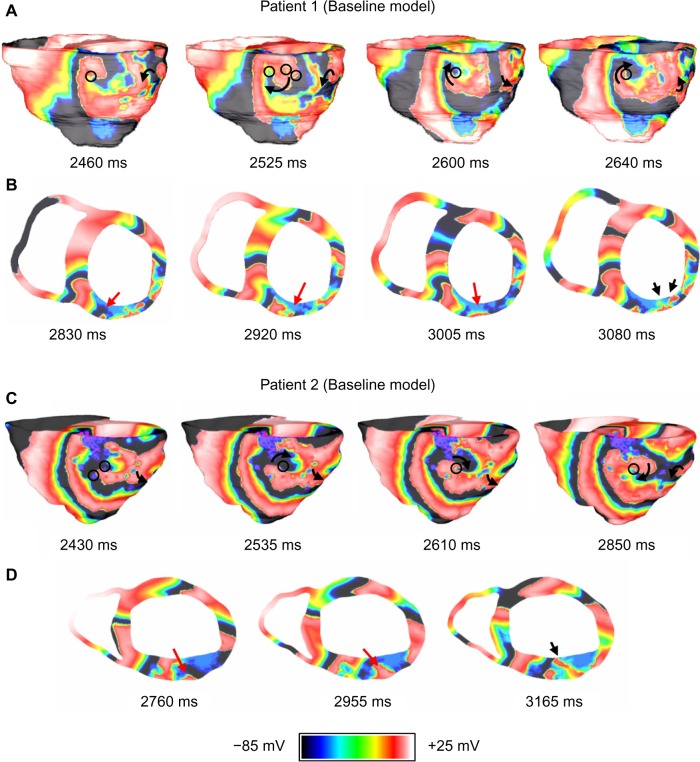
Figure 5 shows the VT pattern in the baseline models of the two patients. VT in each baseline model was characterized by transmural reentry with stable structural reentry on the epicardial surface (lasted throughout five-second simulations). The reentry tended to remain anchored to viable myocardium at the edge of the fibrotic core as shown by the black circles in Figure 5. Patient 1 and Patient 2 both exhibited figure-of-eight reentry patterns on epicardium in the inferior and lateral wall regions. The epicardial activations were conducted transmurally through narrow channels formed within the fibrosis in the wall and produced focal activations on the endocardial surface (shown by the black arrows in Figs. 5B and D).
Figure 5.
VT reentry patterns on Patient 1 and Patient 2 baseline models. (A) Anatomical reentry anchored to fibrosis in Patient 1. The black circles indicate fibrotic tissue; (B) Epicardial activations are conducted transmurally around blockages and through narrow channels formed within fibrosis (red arrows) to produce focal activations on endocardium (black arrows); (C) Anatomical reentry anchored to fibrosis in Patient 2. The black circles indicate fibrotic tissue; and (D) Epicardial activations are conducted transmurally through narrow channels formed within fibrosis (red arrows) to produce focal activations on endocardium (black arrow).
Effect of fibrosis extent on VT
From each of the two baseline models, the extent of the fibrosis from baseline was incrementally increased or decreased based on the synthesized morphologically layered fibrotic models. Each model was simulated using the same protocol as baseline to observe the effect on VT inducibility and characteristic differences in reentry patterns from the baseline models.
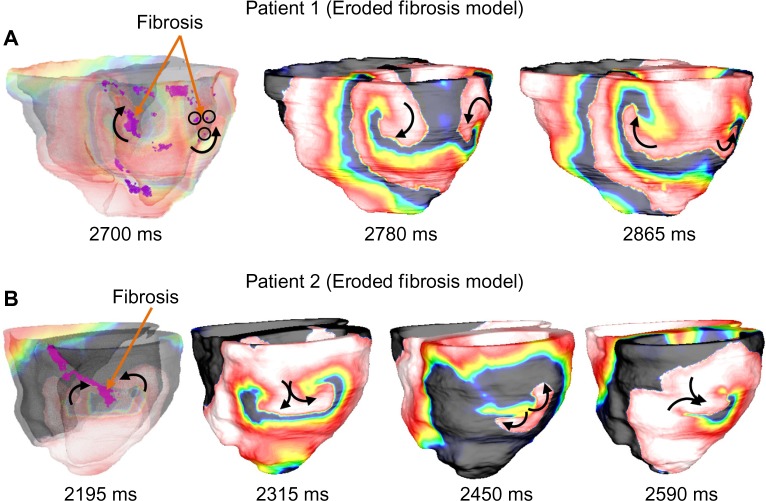
Figure 6 shows the reentry patterns for a 1.35-mm eroded fibrosis model for each patient as an example. It was observed that in Patient 1, all models with decreased fibrosis (eroded) from baseline had similar reentry patterns to the baseline model, which included figure-of-eight reentry on the inferior and lateral epicardial regions and focal activations in the endocardium. In Patient 2, it was observed that eroding up to 450 μm from baseline did not produce significant changes in the reentry patterns. However, further erosion resulted in increasing differences in reentry patterns, primarily characterized by figure-of-eight reentry located on the lateral wall (Fig. 6, panel B). In all models, however, it was observed that reentry filaments tended to anchor to viable myocardium on the edges of the fibrotic regions.
Figure 6.
Sample of VT reentry patterns on Patient 1 and Patient 2 on models with eroded fibrosis. (A) In Patient 1 with 1.35 mm of fibrosis eroded, reentry behavior is similar to that of the baseline model. Anatomical figure-eight-reentry is anchored to fibrosis contained within inferior and lateral walls. The black circles indicate fibrotic tissue; and (B) In Patient 2 with 1.35 mm of fibrosis eroded, anatomical figure-of-eight reentry is focused on lateral wall due to erosion of inferior fibrosis. The first image in each panel is shown translucently to expose fibrosis within walls.
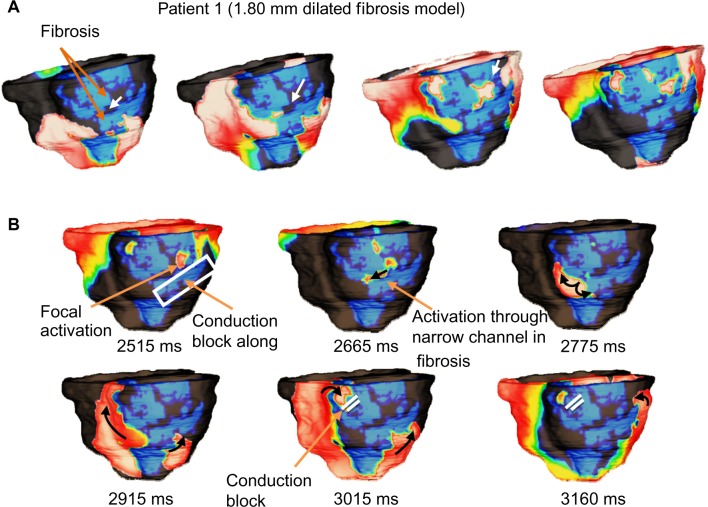
Figures 7 and 8 show reentry patterns for a 1.80-mm dilated fibrosis model for Patient 1 and a 2.25-mm dilated fibrosis model for Patient 2 as an example. It was observed that in Patient 1, up to 450 μm dilation from baseline had similar reentry patterns, which included figure-of-eight reentry on the inferior and lateral epicardial regions and focal activations in the endocardium. Additional dilating of up to 1.80 mm resulted in increasing differences in reentry patterns, characterized by figure-of-eight reentry, with a sustained counterclockwise spiral and intermittent conduction blocks within the fibrosis imposed on the clockwise spiral (Fig. 7, panel B). Dilation of more than 1.80 mm prevented VT inducibility because of overwhelming blockages in the original reentry channels within the fibrotic region. In Patient 2, it was observed that dilating up to 900 μm from baseline did not produce significant changes in the reentry patterns. However, further dilation resulted in increasing differences in reentry patterns, primarily characterized by a singular spiral on the lateral wall and fibrotic conduction blockages, which prevented the inferior reentry as seen in the baseline simulations (Fig. 8, panel B). Dilation of 3.60 mm and beyond caused significant blockages in the fibrotic region, which prohibited reentry initiation. Similar to the baseline and eroded fibrosis models, it was observed that reentry filaments tended to anchor to viable myocardium on the edges of the fibrotic regions.
Figure 7.
Sample of VT reentry patterns in Patient 1 model with increased (1.80 mm dilated) fibrosis. (A) Activations are conducted through narrow channels (white arrows) formed within the fibrosis during apex pacing; and (B) The narrow fibrosis channels effectively create a pathway for activations which were conducted along the fibrotic edges. Although figure-of-eight reentry can be observed, the clockwise inferior spiral becomes stifled by conduction block caused by fibrosis. The counter-clockwise inferior/lateral spiral sustains the reentry along fibrosis edge.
Figure 8.
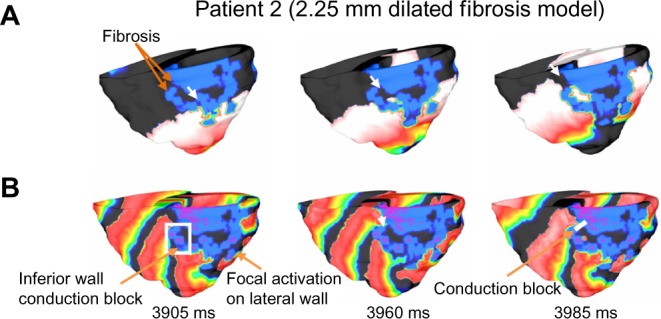
Sample of VT reentry patterns in patient 2 model with dilated (2.25 mm dilated) fibrosis. (A) Activations are conducted through narrow channels (white arrows) formed within the fibrosis during apex pacing; and (B) The narrow fibrosis channels became inaccessible for the epicardial activations on the inferior wall. Thus the figure-of-eight anatomical reentry as observed in the Patient 2 baseline model could not be established. A singular spiral on the lateral wall sustains the reentry.
Effect of GZ distribution on VT
From each of the two baseline models, and from each of the homogeneous fibrotic layers described in the previous section, additional models were created with low (<25%) and high (>75%) distributions of GZ in the outer layers of the fibrotic region. Each additional model was simulated using the same protocol as that of baseline to observe the effect on VT inducibility and characteristic differences in reentry patterns from the original fibrosis morphology.
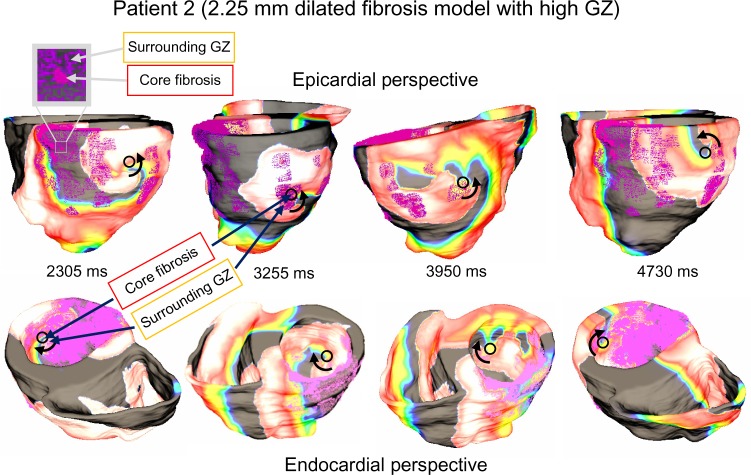
In both models, it is apparent that the distribution of GZ within the fibrosis played a large role in the VT filaments and reentry characteristics. The most notable observation was that reentry core tended to be confined within the GZ regions: between the outer edge of the fibrotic core and the outer edge of the GZ region itself. As such, the singularity points were slightly less stable in the low GZ models and much less stable in the high GZ models. In the high GZ models, chaotic spiral reentry patterns were frequently observed, with reentry commonly becoming unanchored and drifting into nearby GZ regions. This is illustrated in Figure 9, for example, in a Patient 1 high GZ model with a 2.25-mm dilated pathological region (88.6% GZ and 11.4% infarct core). While the initial reentry begins as a singular inferior spiral, as the simulation progresses the spiral wave drifts laterally, settling into a new pathological region on each shift.
Figure 9.
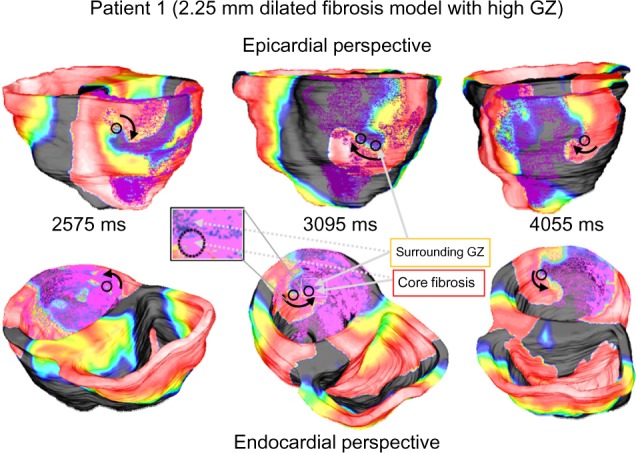
VT reentry patterns in Patient 1 model with dilated (2.25 mm) pathology with high gray zone. Loose anchoring around regions of high GZ causes the focal activation to shift throughout simulation. Beginning on inferior wall, main spiral shifts farther along lateral wall as simulation progresses.
Figure 10 shows a similar example in a Patient 2 high GZ model with a 2.25-mm dilated pathological region (90.8% GZ and 9.2% infarct core). While the initial reentry begins as a singular inferior spiral on the lateral wall, as the simulation progresses the spiral wave shifts posteriorly, settling into a new pathological region on each shift before returning laterally.
Figure 10.
VT reentry patterns in Patient 2 model with dilated (2.25 mm) pathology with high gray zone. The focal activation shifts throughout simulation due to loose anchoring around regions of high GZ. Beginning on lateral wall, main spiral shifts to posterior wall for several cycles before returning laterally.
The overall results are summarized in Figure 11. One point worth noting is that low GZ (<25% GZ) models could not be derived from the layers of some of the smaller pathological tissue regions because of the fact that the outermost layer in these instance encompassed more than 25% of the overall volume.
Figure 11.
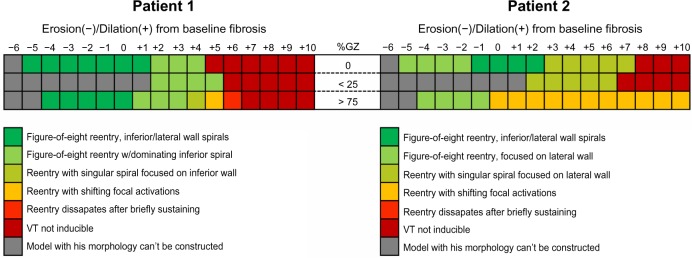
Summary of the reentry outcome obtained in all models derived from Patient 1 (left) and Patient 2 (right).
Discussion
Overview
This paper presents a systematic study of the effects of fibrosis geometry and the extent of fibrosis as well as GZ on VT inducibility and reentry morphology. We outlined a procedure for constructing image-based patient-specific models from in vivo functional MRI, and incorporating fibrosis geometry from in vivo DE-MRI. Detailed simulations of arrhythmia initiation and maintenance were performed in the baseline models as well as in synthesized models derived from the baseline models (86 models altogether) by iteratively dilating and eroding the fibrosis regions, and by varying the extent of scar/GZ distribution. Main findings of this study are: (1) VT morphology greatly depends on the extent of fibrosis, which acts as a structural substrate, (2) reentry tends to be anchored to the fibrosis edges and shows transmural conduction of activations through narrow channels formed within fibrosis, (3) increasing the extent of GZ within fibrosis tends to destabilize the structural reentry and aggravate the VT as compared to fibrotic regions of the same size and shape but with lower or no GZ.
Fibrosis is a crucial factor for VT occurrence after a MI,43 and it has also been shown to be related to VT cycle length.44 This study demonstrates how different distribution of fibrosis and border zone areas may affect VT inducibility and patterns of activation. This is especially important since in vivo resolution of DE-MRI studies has some limitations that may affect any further interpretation of clinical results: First, scar areas and border zone areas are codified based on color-coded intensity, which makes interpretation of scar areas dependent on the selected threshold. New T1 sequences, which provide signal quantification of fibrosis, may provide additional support for quantifying different degrees of fibrosis. Second, spatial resolution of DE-MRI studies and motion artifact in suboptimal image acquisitions are also important limitations. Current spatial resolution seems to be enough to detect VT isthmuses (reported as 2.5 to 8 mm wide by Fernández-Armenta et al.45). However, interpreting the VT isthmuses as border zones may change depending on the threshold selected. Here, we show how such changes may affect VT inducibility.
Studies such as that of Fluechter et al have demonstrated the direct correlation between fibrosis extent and VT inducibility.46 In this study we also demonstrate that the VT morphology itself is highly dependent upon fibrosis extent. Our simulations also reflect clinical findings12,13,47 that reentry tended to remain anchored to the fibrosis edges in all models. In the no-GZ models, spiral waves were stably anchored to viable myocardium at the edge of the fibrosis. In models containing GZ, anchoring was found to vary between the fibrotic core and viable myocardium within the GZ region. This resulted in instability of the structural reentry sites, especially in the high-GZ models. As a result, the locations of the structural reentry sites were observed to drift throughout the simulation. These findings especially bear relevance with clinical studies that have reported stark differences in VT patterns between patients who have previously undergone reperfusion therapy following acute MI compared to those who have not after MI.48 Anatomically patchy scars present in the reperfused group correlated with significantly less stable and more spontaneous VTs than in the nonperfused group, despite a smaller scar pattern and the percentage of dense scar to overall scar being significantly higher in the non-reperfused group. Our findings may have important implications for the understanding and management of VTs with different fibrotic morphologies.
A consideration worth mentioning is that the infarct-related scar stabilization is a dynamic process that may vary over time, and most patients develop VT several years after the acute infarction. Therefore, performing the MRI study close to the electrophysiology (EP) study in patients undergoing VT ablation increases the clinical significance of the virtual 3D modeling. Even though DE-MRI is the most accurate method to measure myocardial replacement fibrosis,49 its sensitivity is limited for the assessment of diffuse interstitial fibrosis. In DE-MRI, image contrast relies on the difference in signal intensity between fibrotic and normal myocardium, and such differences may not exist if the process is diffuse. Such a limitation can be overcome by using T1 mapping. However, infarct-related ventricular scar tissue is not a diffuse fibrotic process. In fact, it is a clear example of focalized fibrosis within specific myocardial regions, which indeed generates slow conduction pathways prompt to develop monomorphic VT. Therefore, our approach using DE-MRI seems to be appropriate for this substrate.
Patient-specific modeling and forward-looking clinical approaches
Utilizing MRI acquisitions, the past decade has seen a momentum gain in research focused on deriving enhanced patient-specific anatomical modeling procedures and tools, as well as personalized mechanical and electrophysiological simulations utilizing these models. Integrating computational models of the heart with clinical data (ie, 3D numerical models with patient-specific parameters) introduces enormous potential for improving diagnosis, treatment planning, and interventions for cardiovascular diseases.50 Moreover, these models have the potential for predictive use and may aid in guiding patient management and therapy planning in the future, both medicinally and surgically. For instance, these computational models provide a viable means to visualize infarct myocardium in three dimensions and have the potential to provide predictive support for successful ablation procedures.18,51,52 Advances leading to improved disease management and therapy planning, as well as outcomes assessment, would have substantial impact on the quality of life in patients with structural heart disease.
Based on our previous studies, this paper outlines a procedure for constructing image-based patient-specific models from in vivo functional MRI, which incorporates fibrosis geometry from in vivo DE-MRI. Because of the quality limitations of in vivo MRI, it is often difficult to differentiate the contrast given to fibrosis versus surrounding high intensity objects such as the blood pools and pericardium. Expert judgment is considered the gold standard, but is subject to intra- and inter-observer variability. Furthermore, distribution of GZ within the fibrosis is often difficult to precisely measure, especially restricted by resolution limitations and contrast washout during acquisition. Thus, this study aimed to answer the question of how precise must the delineation of fibrosis be, including appropriate assignment of GZ, in order to produce reproducible effects in terms of VT inducibility and characteristics. This is an especially important consideration in clinical VT, as current strategies focused on scar dechanneling based on DE-MRI and electrophysiological parameters may ablate many irrelevant areas for VT induction.45 Furthermore, this study aimed to better understand and predict the role that these differences in structure play in patients suffering from VT as a result of MI.
Results demonstrate that the extent of GZ plays a significant role in VT fidelity, specifically in terms of inducibility, maintenance, and reentry characteristics. This is especially noted between high levels of GZ versus low levels of GZ or no GZ distributed in the outer fibrotic layers. Furthermore, VT characteristics are shown to have sensitivities to changes to the extent of fibrosis based on structural morphology. This is especially significant, as the synthesized layers within the fibrosis were set at 0.45 mm, which is less than 60% of the voxel resolution (0.71 × 0.71 × 0.75 mm) capable of the reconstructed 3D DE-MRI acquisition. This means that small variations in pathological tissue segmentation may have a substantial impact on the fidelity of resulting simulations. As thresholding is a commonly used method to extract the fibrosis and differentiate the GZ,10,12 this especially warrants great care in appropriately assigning voxels. This also implicates that small changes to the actual pathological structure within the patient’s cardiac anatomy may play a substantial role in the inducibility and characterization of VTs. Furthermore, this study supports evidence that morphology of fibrosis and GZ distribution are powerful predictors of VT severity and inducibility.7–13
The results on VT characteristics within differing levels of fibrosis and GZ distribution also have significant implications in terms of forward approaches to in vivo image-based modeling of VT. The ability to noninvasively recreate patient-specific pathology has potential to noninvasively understand the mechanisms causing the VT to persist, which will provide paramount insights into less invasive VT ablation procedures. Studies have suggested viability of such approaches in both animal and human subjects.4,5,12,47,53
Limitations and further considerations
As discussed, in vivo MRI data have inherent limitations in terms of spatial resolution, spacing between slices, etc., which currently inhibit the precision and detail of resulting image-based geometries. As a result, the spatial resolution of 450 μm used in the models here is likely too coarse to differentiate ultra-fine structures of intermingled myocardial and fibrotic fibers that are presented in the infarcted zone. Even in our acquisitions, which are very high resolution for in vivo images, we are limited by voxels of size 0.71 × 0.71 × 0.75 mm in the 3D DE images. Thus, inherent simplifications are necessarily accounted for in this study. We did not have the capability to incorporate patient-specific remodeling at the cellular level. However, we did consider electrophysiological properties of human ventricular action potential and ionic kinetics of the border zone based on previous studies on infarcted canine hearts. Incorporating such kinetics from patients with post-MI related VT is not presently feasible. However, it might be possible to incorporate propagation properties from patients who undergo an electrophysiological study for VT ablation. The latter will certainly add significant value to our predictions in future work with patients undergoing VT ablation. Furthermore, as in vivo approaches do not currently allow for acquisition of tensor data, muscle fibers must be approximated via deformation from a human-based atlas derived from ex vivo DTMRI data. As the simulations were exploratory and simplified to understand dynamics of arrhythmia based on pathological structure, these limitations do not pose problems for the reported results. 86 models were studied in this work, with 84 synthesized models based on 2 baseline patient models. Sample sizes of patient data in future studies will increase as they become available and will serve to expound upon the conclusions drawn in this study.
Another limitation in this study is the lack of cardiac conduction system in our models. Resolution of in vivo MRI data is not sufficient to trace the markers of Purkinje network. Although Purkinje system may play a role in ventricular arrhythmias,54,55 it is unlikely to influence our simulation results, which are focused on altered VT morphology as a result of fibrosis extent. Furthermore, most VTs originate after a premature ventricular complex that penetrates into the slow conduction pathway of the VT isthmus and leads to VT initiation. Such premature ventricular complex might originate either from ventricular myocytes or from Purkinje cells. In any case, propagation of the premature ventricular complex through the myocardium is responsible for VT initiation. Normal propagation through the conduction system does not seem to be relevant in such scenario. Moreover, programmed electrical stimulation from the right ventricular apex, using a S1–S2 protocol, is the regular approach to induce VT in the EP lab, which makes scar-related VT circuits prompt to initiate monomorphic VT. Therefore, the VT induction strategy used in the computational models resembles the clinical approach performed in the EP lab and is mainly based on myocardial propagation rather than propagation through the conduction system.
Finally, the presented study is based on different scenarios that may occur in patients with infarct-related substrates. How hypertension or other comorbidities may affect the fibrotic areas and sensitivity to develop VT is difficult to predict from our study. Larger series would be necessary to differentiate how comorbidities may contribute to different VT susceptibility. Such an aim is clearly out of the scope of the study, although we think it might be relevant for future large series.
Conclusions
This paper outlines a coherent approach to segmenting patient-specific in vivo MRI and consequently reconstructing image-based cardiac models from the discretized images, building upon our previous research. The applications of these models to study unknown pathological parameters are presented, specifically with regard to VT. The results also suggest sensitivity implications to alterations in the geometrical morphology of fibrosis within the models. The aim of future studies will continue to utilize simulations with models derived from patient-specific MRI to provide new insights into structural heart diseases, with the ultimate goal of potential application to the emerging area of individualized medicine looking forward.
Acknowledgments
The authors would like to thank and acknowledge Fijoy Vadakkumpadan, Johns Hopkins University, for his assistance and training in incorporating fiber orientations into the cardiac models. This work was supported in part by an allocation of computing time from the Ohio Supercomputer Center. The authors would also like to acknowledge support from Dean Dr Nagi Naganathan of the College of Engineering at the University of Toledo in the form of graduate assistantship for PhD candidate Jordan Ringenberg.
Footnotes
Author Contributions
Conceived and designed the experiments: JR, MD, DF, GP, BI, RP, JM, OB, VD. Analyzed the data: JR, MD, DF, GP. Wrote the first draft of the manuscript: JR, MD. Contributed to the writing of the manuscript: JR, MD, DF, GP, BI, RP, JM, OB, VD. Agree with manuscript results and conclusions: JR, MD, DF, GP, BI, RP, JM, OB, VD. Jointly developed the structure and arguments for the paper: JR, MD, DF, GP, BI, RP, JM, OB, VD. Made critical revisions and approved final version: JR, MD, DF, GP, BI, RP, JM, OB, VD. All authors reviewed and approved of the final manuscript.
ACADEMIC EDITOR: Thomas Vanhecke, Editor in Chief
FUNDING: Makarand Deo is supported by American Heart Association Scientist Development Grant no. 12SDG11480010. The work is also supported by Pro CNIC Foundation, Eugenio Rodríguez Pascual Foundation, Fondo Europeo de Desarrollo Regional (FEDER), European Union, and Instituto de Salud Carlos III, Spain [RD12/0042/0036 (RIC)] (David Filgueiras-Rama, Gonzalo Pizarro, and Borja Ibañez).
COMPETING INTERESTS: OB reports donation of devices from Medtronic and St Jude Medical, and a research grant from Medtronic, and is a scientific officer and shareholder in Rhythm Solutions Inc. All other authors disclose no competing interests.
This paper was subject to independent, expert peer review by a minimum of two blind peer reviewers. All editorial decisions were made by the independent academic editor. All authors have provided signed confirmation of their compliance with ethical and legal obligations including (but not limited to) use of any copyrighted material, compliance with ICMJE authorship and competing interests disclosure guidelines and, where applicable, compliance with legal and ethical guidelines on human and animal research participants. Provenance: the authors were invited to submit this paper.
REFERENCES
- 1.Camm AJ, Lüscher TF, Serruys PW, editors. The ESC Textbook of Cardiovascular Medicine. Oxford: Oxford University Press; 2009. [Google Scholar]
- 2.Petitjean C, Dacher JN. A review of segmentation methods in short axis cardiac MR images. Med Image Anal. 2011;15(2):169–84. doi: 10.1016/j.media.2010.12.004. [DOI] [PubMed] [Google Scholar]
- 3.Van Assche LMR, Kim HW, Kim RJ. Cardiac MR for the assessment of myocardial viability. Methodist Debakey Cardiovasc J. 2013;9(3):163–8. doi: 10.14797/mdcj-9-3-163. [DOI] [PMC free article] [PubMed] [Google Scholar]
- 4.Godeschalk-Slagboom CJ, van der Geest RJ, Zeppenfeld K, Botha CP. Cardiac MRI visualization for ventricular tachycardia ablation. Int J Comput Assist Radiol Surg. 2012;7(5):753–67. doi: 10.1007/s11548-012-0776-4. [DOI] [PubMed] [Google Scholar]
- 5.Dickfeld T, Tian J, Ahmad G, et al. MRI-guided ventricular tachycardia ablation: integration of late gadolinium-enhanced 3D scar in patients with implantable cardioverter-defibrillators. Circ Arrhythmia Electrophysiol. 2011;4(2):172–84. doi: 10.1161/CIRCEP.110.958744. [DOI] [PubMed] [Google Scholar]
- 6.Blomström Lundqvist C, Auricchio A, Brugada J, et al. The use of imaging for electrophysiological and devices procedures: a report from the first European Heart Rhythm Association Policy Conference, jointly organized with the European Association of Cardiovascular Imaging (EACVI), the Council of Cardio vascular Imaging and the European Society of Cardiac Radiology. Europace. 2013;15(7):927–36. doi: 10.1093/europace/eut084. [DOI] [PubMed] [Google Scholar]
- 7.Yan AT, Shayne AJ, Brown KA, et al. Characterization of the peri-infarct zone by contrast-enhanced cardiac magnetic resonance imaging is a powerful predictor of post-myocardial infarction mortality. Circulation. 2006;114(1):32–9. doi: 10.1161/CIRCULATIONAHA.106.613414. [DOI] [PubMed] [Google Scholar]
- 8.Roes SD, Borleffs CJ, van derGeest RJ, et al. Infarct tissue heterogeneity assessed with contrast-enhanced MRI predicts spontaneous ventricular arrhythmia in patients with ischemic cardiomyopathy and implantable cardioverter-defibrillator. Circ Cardiovasc Imaging. 2009;2(3):183–90. doi: 10.1161/CIRCIMAGING.108.826529. [DOI] [PubMed] [Google Scholar]
- 9.Schmidt A, Azevedo CF, Cheng A, et al. Infarct tissue heterogeneity by magnetic resonance imaging identifies enhanced cardiac arrhythmia susceptibility in patients with left ventricular dysfunction. Circulation. 2007;115(15):2006–14. doi: 10.1161/CIRCULATIONAHA.106.653568. [DOI] [PMC free article] [PubMed] [Google Scholar]
- 10.Estner HL, Zviman MM, Herzka D, et al. The critical isthmus sites of ischemic ventricular tachycardia are in zones of tissue heterogeneity, visualized by magnetic resonance imaging. Heart Rhythm. 2011;8(12):1942–9. doi: 10.1016/j.hrthm.2011.07.027. [DOI] [PubMed] [Google Scholar]
- 11.Arevalo H, Plank G, Helm P, Halperin H, Trayanova N. Tachycardia in post-infarction hearts: insights from 3D image-based ventricular models. PLoS One. 2013;8(7):e68872. doi: 10.1371/journal.pone.0068872. [DOI] [PMC free article] [PubMed] [Google Scholar]
- 12.Andreu D, Berruezo A, Ortiz-Pérez JT, et al. Integration of 3D electroanatomic maps and magnetic resonance scar characterization into the navigation system to guide ventricular tachycardia ablation. Circ Arrhythm Electrophysiol. 2011;4(5):674–83. doi: 10.1161/CIRCEP.111.961946. [DOI] [PubMed] [Google Scholar]
- 13.Perez-David E, Arenal A, Rubio-Guivernau JL, et al. Noninvasive identification of ventricular tachycardia-related conducting channels using contrast-enhanced magnetic resonance imaging in patients with chronic myocardial infarction: comparison of signal intensity scar mapping and endocardial voltage mappin. J Am Coll Cardiol. 2011;57(2):184–94. doi: 10.1016/j.jacc.2010.07.043. [DOI] [PubMed] [Google Scholar]
- 14.Dikici E, O’Donnell T, Setser R, White RD. Quantification of delayed enhancement MR images. Med Image Comput Comput Assist Interv. 2004;3216:250–7. doi: 10.1007/11566489_85. [DOI] [PubMed] [Google Scholar]
- 15.El-berbari R, Kachenoura N, Redheuil A, Bloch I, Mousseaux E, Paris C. Using cine MR images to evaluate myocardial infarct transmurality on delayed enhancement images; 3rd IEEE International Symposium on Biomedical Imaging from Nano to Macro; Arlington, VA - IEEE. 2006. pp. 145–8. [Google Scholar]
- 16.Wei D, Sun Y, Chai P, Low A, Ong SH. Myocardial segmentation of late gadolinium enhanced MR images by propagation of contours from cine MR images. Med Image Comput Comput Assist Interv. 2011;14:428–35. doi: 10.1007/978-3-642-23626-6_53. [DOI] [PubMed] [Google Scholar]
- 17.Dickfeld T. (EP Lab Digest).MRI and VT Ablations: Where Do We Stand? 2011;1 http://eplabdigest.com/blog/MRI-and-VT-Ablations-Where-Do-We-Stand [Google Scholar]
- 18.Ringenberg J, Deo M, Devabhaktuni V, et al. Automated segmentation and reconstruction of patient-specific cardiac anatomy and pathology from in vivo MRI. Meas Sci Technol. 2012;23(12):125405. [Google Scholar]
- 19.Ringenberg J, Deo M, Devabhaktuni V, Berenfeld O, Boyers P, Gold J. Fast, accurate, and fully automatic segmentation of the right ventricle in short-axis cardiac MRI. Comput Med Imaging Graph. 2014;38(2):190–201. doi: 10.1016/j.compmedimag.2013.12.011. [DOI] [PubMed] [Google Scholar]
- 20.Jarvis R. On the identification of the convex hull of a finite set of points in the plane. Inf Process Lett. 1973;2(1):18–21. [Google Scholar]
- 21.Xu C, Prince JL. Snakes, shapes, and gradient vector flow. IEEE Trans Image Process. 1998;7(3):359–69. doi: 10.1109/83.661186. [DOI] [PubMed] [Google Scholar]
- 22.Otsu N. A threshold selection method from gray-level histogram. Automatica. 1975;11:285–96. [Google Scholar]
- 23.Toussaint N, Mansi T, Delingette H, Ayache N, Sermesant M. An integrated platform for dynamic cardiac simulation and image processing: application to personalised tetralogy of Fallot simulation; Proc Eurographics Workshop on Visual Computing for Biomedicine (VCBM); Delft, The Netherlands. 2008. pp. 21–8. [Google Scholar]
- 24.Ringenberg J, Deo M, Devabhaktuni V, et al. Accurate reconstruction of 3D cardiac geometry from coarsely-sliced MRI. Comput Biol Med. 2014;113(2):483–93. doi: 10.1016/j.cmpb.2013.11.013. [DOI] [PubMed] [Google Scholar]
- 25.Turk G, O’Brien JF. Variational implicit surfaces. Georgia Institute of Technology; 1999. (Technical Report). [Google Scholar]
- 26.Group VS. Avizo version 7.0. Visualization Sciences Group. 2011 [Google Scholar]
- 27.Lorensen WE, Cline HE. Marching cubes: a high resolution 3D surface construction algorithm. ACM SIGGRAPH Comput Graph. 1987;21(4):163–9. [Google Scholar]
- 28.Rajon DA, Bolch WE. Marching cube algorithm: review and trilinear interpolation adaptation for image based dosimetric models. Comput Med Imaging Graph. 2003;27(1):411–35. doi: 10.1016/s0895-6111(03)00032-6. [DOI] [PubMed] [Google Scholar]
- 29.Cignoni P, Montani C, Scopigno R. A comparison of mesh simplification algorithms. Comput Graph. 1998;22(1):37–54. [Google Scholar]
- 30.Frey PJ, Borouchaki H, Georges PL. 3D Delauney mesh generation coupled with an advancing-front approach. Comput Methods Appl Mech Eng. 1998;157(1–2):115–31. [Google Scholar]
- 31.Vadakkumpadan F, Arevalo H, Ceritoglu C, Miller M, Trayanova N. Image-based estimation of ventricular fiber orientations for personalized modeling of cardiac electrophysiology. IEEE Trans Med Imaging. 2012;31(5):1051–60. doi: 10.1109/TMI.2012.2184799. [DOI] [PMC free article] [PubMed] [Google Scholar]
- 32.Beg MF, Helm PA, McVeigh E, Miller MI, Winslow RL. Computational cardiac anatomy using MRI. Magn Reson Med. 2004;52(5):1167–74. doi: 10.1002/mrm.20255. [DOI] [PMC free article] [PubMed] [Google Scholar]
- 33.Ceritoglu C, Oishi K, Li X, et al. Multi-contrast large deformation diffeomorphic metric mapping for diffusion tensor imaging. Neuroimage. 2009;47(2):618–27. doi: 10.1016/j.neuroimage.2009.04.057. [DOI] [PMC free article] [PubMed] [Google Scholar]
- 34.Plank G, Zhou L, Greenstein JL, et al. From mitochondrial ion channels to arrhythmias in the heart: computational techniques to bridge the spatio-temporal scales. Philos Trans A Math Phys Eng Sci. 2008;1879;366:3381–409. doi: 10.1098/rsta.2008.0112. [DOI] [PMC free article] [PubMed] [Google Scholar]
- 35.Ten Tusscher KHWJ, Panfilov AV. Alternans and spiral breakup in a human ventricular tissue model. Am J Physiol Heart Circ Physiol. 2006;291(3):H1088–100. doi: 10.1152/ajpheart.00109.2006. [DOI] [PubMed] [Google Scholar]
- 36.Pu J, Boyden PA. Alterations of Na+ currents in myocytes from epicardial border zone of the infarcted heart: a possible ionic mechanism for reduced excitability and postrepolarization refractoriness. Circ Res. 1997;81(1):110–9. doi: 10.1161/01.res.81.1.110. [DOI] [PubMed] [Google Scholar]
- 37.Dun W, Baba S, Yagi T, Boyden PA. Dynamic remodeling of K+ and Ca2+ currents in cells that survived in the epicardial border zone of canine healed infarcted heart. Am J Physiol Heart Circ Physiol. 2004;287(3):H1046–54. doi: 10.1152/ajpheart.00082.2004. [DOI] [PMC free article] [PubMed] [Google Scholar]
- 38.Jiang M, Cabo C, Yao J, Boyden PA, Tseng G. Delayed rectifier K currents have reduced amplitudes and altered kinetics in myocytes from infarcted canine ventricle. Cardiovasc Res. 2000;48(1):34–43. doi: 10.1016/s0008-6363(00)00159-0. [DOI] [PubMed] [Google Scholar]
- 39.Clerc L. Directional differences of impulse spread in trabecular muscle from mammalian heart. J Physiol. 1976;255(2):335–46. doi: 10.1113/jphysiol.1976.sp011283. [DOI] [PMC free article] [PubMed] [Google Scholar]
- 40.Vigmond EJ, Plank G. CARP Solver. 2007. Available at http://carp.meduni-graz.at/
- 41.Vigmond EJ, Hughes M, Plank G, Leon LJ. Computational tools for modeling electrical activity in cardiac tissue. J Electrocardiol. 2003;36(suppl):69–74. doi: 10.1016/j.jelectrocard.2003.09.017. [DOI] [PubMed] [Google Scholar]
- 42.Vigmond EJ, Weber dos Santos R, Prassl AJ, Deo M, Plank G. Solvers for the cardiac bidomain equations. Prog Biophys Mol Biol. 2008;96(1–3):3–18. doi: 10.1016/j.pbiomolbio.2007.07.012. [DOI] [PMC free article] [PubMed] [Google Scholar]
- 43.Boyé P, Abdel-Aty H, Zacharzowsky U, et al. Prediction of life-threatening arrhythmic events in patients with chronic myocardial infarction by contrast-enhanced CMR. JACC Cardiovasc Imaging. 2011;4(8):871–9. doi: 10.1016/j.jcmg.2011.04.014. [DOI] [PubMed] [Google Scholar]
- 44.Alexandre J, Saloux E, Lebon A, et al. Scar extent as a predictive factor of ventricular tachycardia cycle length after myocardial infarction: implications for implantable cardioverter-defibrillator programming optimization. Europace. 2014;16(2):220–6. doi: 10.1093/europace/eut289. [DOI] [PubMed] [Google Scholar]
- 45.Fernández-Armenta J, Berruezo A, Andreu D, et al. Three-dimensional architecture of scar and conducting channels based on high resolution ce-CMR: insights for ventricular tachycardia ablation. Circ Arrhythm Electrophysiol. 2013;6(3):528–37. doi: 10.1161/CIRCEP.113.000264. [DOI] [PubMed] [Google Scholar]
- 46.Fluechter S, Kuschyk J, Wolpert C, et al. Extent of late gadolinium enhancement detected by cardiovascular magnetic resonance correlates with the inducibility of ventricular tachyarrhythmia in hypertrophic cardiomyopathy. J Cardiovasc Magn Reson. 2010;12:30. doi: 10.1186/1532-429X-12-30. [DOI] [PMC free article] [PubMed] [Google Scholar]
- 47.Ashikaga H, Sasano T, Dong J, et al. Magnetic resonance-based anatomical analysis of scar-related ventricular tachycardia: implications for catheter ablation. Circ Res. 2007;101(9):939–47. doi: 10.1161/CIRCRESAHA.107.158980. [DOI] [PMC free article] [PubMed] [Google Scholar]
- 48.Wijnmaalen AP, Schalij MJ, von der Thüsen JH, Klautz RJM, Zeppenfeld K. Early reperfusion during acute myocardial infarction affects ventricular tachycardia characteristics and the chronic electroanatomic and histological substrate. Circulation. 2010;121(17):1887–95. doi: 10.1161/CIRCULATIONAHA.109.891242. [DOI] [PubMed] [Google Scholar]
- 49.Mewton N, Liu CY, Croisille P, Bluemke D, Lima JAC. Assessment of myocardial fibrosis with cardiovascular magnetic resonance. J Am Coll Cardiol. 2011;57(8):891–903. doi: 10.1016/j.jacc.2010.11.013. [DOI] [PMC free article] [PubMed] [Google Scholar]
- 50.Sermesant M, Peyrat J-M, Chinchapatnam P, et al. Toward patient-specific myocardial models of the heart. Heart Fail Clin. 2008;4(3):289–301. doi: 10.1016/j.hfc.2008.02.014. [DOI] [PubMed] [Google Scholar]
- 51.Wang L, Dawoud F, Wong KCL, et al. Statistical Atlases and Computational Models of the Heart Imaging and Modelling Challenges. Springer; Berlin Heidelberg: 2012. Transmural electrophysiologic and scar imaging on porcine heart with chronic infarction; pp. 23–32. [Google Scholar]
- 52.Bartz D, Botha CP, Hornegger J, Machiraju R, Wiebel A, Preim B. Interactive real time simulation of cardiac radio-frequency ablation; Eurographics Workshop on Visual Computing for Biology and Medicine; Eurographics Association Aire-la-Ville, Switzerland, Switzerland. 2010. pp. 91–8. [Google Scholar]
- 53.Restrepo AJ, Dickfeld TM. Cardiac imaging to assist complex ablation procedures. Cardiac Arrhythmias. 2014;2014:369–86. [Google Scholar]
- 54.Deo M, Boyle P, Plank G, Vigmond E. Arrhythmogenic mechanisms of the Purkinje system during electric shocks: a modeling study. Heart Rhythm. 2009;6(12):1782–9. doi: 10.1016/j.hrthm.2009.08.023. [DOI] [PMC free article] [PubMed] [Google Scholar]
- 55.Deo M, Boyle P, Kim A, Vigmond E. Arrhythmogenesis by single ectopic beats originating in the Purkinje System. Am J Physiol Hear Circ Physiol. 2010;299(4):H10002–11. doi: 10.1152/ajpheart.01237.2009. [DOI] [PMC free article] [PubMed] [Google Scholar]


