

Summary
Traumatic brain injury (TBI) elicits innate inflammatory responses that can lead to secondary brain injury. To better understand the mechanisms involved in TBI-induced inflammation, we examined the nature of macrophages responding to TBI in mice. In this model, brain macrophages were increased >20-fold the day after injury and >77-fold four days after injury in the ipsilateral hemisphere compared with sham controls. TBI macrophage subsets were identified by using a reporter mouse strain (YARG) that expresses eYFP from an IRES inserted at the 3′ end of the gene for arginase-1 (Arg1), a hallmark of alternatively activated (M2) macrophages. One day after TBI, 21±1.5% of ipsilateral brain macrophages expressed relatively high levels of Arg1 as detected by YFP, and this subpopulation declined thereafter. Arg1+ cells localized with macrophages near the TBI lesion. Gene expression analysis of sorted Arg1+ and Arg1- brain macrophages revealed that both populations had profiles that included features of conventional M2 macrophages and classically activated (M1) macrophages. The Arg1+ cells differed from Arg1- cells in multiple aspects, most notably in their chemokine repertoires. Thus, the macrophage response to TBI initially involves heterogeneous polarization towards at least two major subsets.
Keywords: alternative activation, inflammation, macrophage, traumatic brain injury
Introduction
Traumatic brain injury (TBI) is the leading cause of morbidity and mortality from childhood to age 44 [1]. Following the initial trauma, inflammatory responses can expand brain damage [1]. TBI rapidly leads to activation of microglia, macrophages, and neutrophils, and to local release of inflammatory cytokines [1-5]. Understanding the inflammatory events that occur during this critical window is an important step toward developing interventions targeting the immune response [6].
Following brain injury, the host response has the potential for both benefit and harm. While inflammatory mechanisms may be required for wound sterilization, the response can extend neuronal cell death and impair recovery. Macrophages have previously been studied in models of CNS injury including experimental autoimmune encephalitis, ischemic stroke, and spinal cord injury as well as traumatic brain injury, and there is conflicting evidence as to whether macrophages are overall harmful or beneficial to the brain. A detrimental role for macrophages has been found in most neuroimmunologic studies [7-13]. However, the inflammatory response is also important for clearing necrotic debris and for wound repair [14]. In support of this, macrophages have also been shown to suppress inflammation and were critical for recovery in one model of spinal cord injury [15]. Moreover, in EAE, macrophages that suppress inflammation through the production of IL-10 and TGF-β are beneficial [16]. These differing roles for macrophages may reflect different functional states of macrophage activation.
In vitro and in vivo studies have demonstrated that macrophages can be activated into two major subsets: classically activated (M1) and alternatively activated (M2) macrophages [17-19]. M1 macrophages directly incite inflammation by releasing IL–12, TNF-α, IL-6, IL-1β, and nitric oxide (NO) in response to microbial pathogens or LPS. In contrast, M2 cells are activated in response to helminths, to allergens, by adipose tissue, and in vitro by IL-4 [20, 21]. M2 macrophages suppress inflammation and promote wound healing [14]. They express increased levels of arginase-1 (Arg1), CD206 (mannose receptor), Clec7a (dectin-1), CD301, resistin-like alpha (RELMα), and PDL2. Additional macrophage subsets have been identified [17, 18]. In vivo studies demonstrate that macrophages may differentiate along a spectrum of phenotypes that do not adhere to well-defined in vitro phenotypes [14, 17, 22, 23]. Furthermore, macrophages may shift from one phenotype to another [17].
In considering the role of macrophages in brain injury, it may be important to distinguish between macrophage subsets. Thus, in vitro studies have demonstrated that M1 macrophages are neurotoxic, while M2 macrophages promote regenerative neuronal growth [24]. CCL2, which is expressed post-TBI in the brain and cerebrospinal fluid, has been thought to elicit primarily M1 macrophages, and the presence of macrophages/microglia early after TBI by histology is often associated with the expression of TNF, IL-6, and IL1 [1, 13, 25-27]. These findings previously suggested that there is a prominent M1 phenotype in early macrophage recruitment following TBI. Characterization of macrophages in TBI by histology has been complicated by difficulty in distinguishing them from microglia; there is no known marker that is expressed by macrophages but not microglia or vice versa. By flow cytometry, however, the two cell populations can be distinguished by the level of CD45 expression. Using this approach, we have examined the nature of macrophages responding to TBI in mice. To facilitate macrophage subset identification, we examined TBI in YARG mice, in which YFP is expressed under the promoter for the M2 marker, Arg1 [28, 29], and Yet40 mice, in which YFP is expressed under the promoter for the M1 marker, IL-12p40. We here demonstrate that a subset of brain wound macrophages upregulate Arg1 and home to the site of injury. At day 1 after injury 21±1.5% of the ipsilateral hemisphere macrophages express high levels of Arg1, but the number of Arg1+ cells falls thereafter and cannot be detected after 1 week. Whole genome expression analysis of Arg1+ and Arg1- macrophages following TBI revealed that these macrophage subsets differ in their expression of over 1,300 genes, with notable differences in genes encoding chemokines. The pattern of gene expression in neither population is characteristic of in vitro-derived M2 or M1 cells. Our results indicate that the macrophage response to TBI is heterogeneous, and the early response includes at least two distinct subsets. As assessed by expression of Arg1, the ratio of these subsets changes with time.
Results
Macrophages are recruited to the lesion site in large numbers early post-TBI
To assess the immune response following TBI, we used an adult murine controlled cortical impact (CCI) model. Histological analysis of brain sections following TBI confirmed cortical injury, which extended into the hippocampus (Figure 1A). H&E staining revealed increased cellular recruitment to cortical tissues adjacent to the lesion (Figure 1A). Immunohistochemical staining for F4/80 showed that macrophages/microglia are widely present at the pericontusional site (e.g. in areas of the cortex adjacent to the lesion) (Figure 1B).
Figure 1. TBI induces a significant macrophage response near the lesion site.
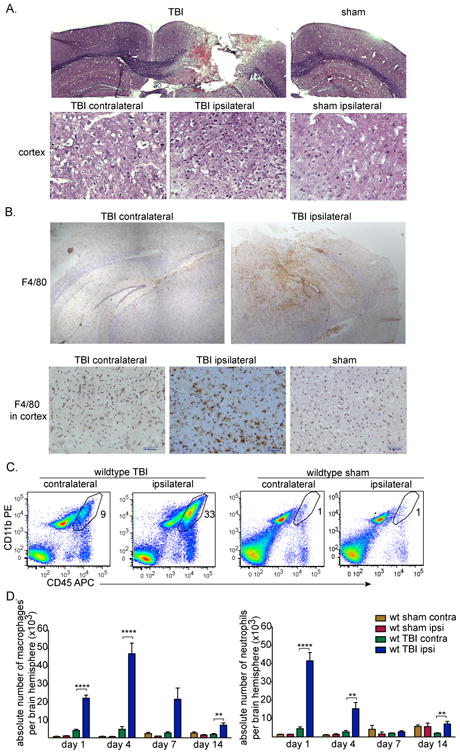
(A) CCI model of murine TBI four days post-surgery. Coronal brain sections were stained with H&E (top). Scale bars represent 500 μm. Images of H&E staining of cortical brain tissues four days after surgery (bottom). Scale bars represent 50 μm. (B) Representative immunohistochemical staining of coronal brain sections for F4/80+ macrophages/microglia (brown) and counterstained with hematoxylin (light purple) four days post-TBI. Images of staining in cortex are also shown (bottom). Scale bars represent 200 μm (top) and 50 μm (bottom). (A-B) Data shown are representative of three experiments performed.
(C) Representative flow cytometry data of brain leukocytes isolated four days post-TBI (n=8) or sham surgery (n=4) that were stained for CD45-allophycocyanin and CD11b-PE. Density plots shown are of live cells that are negative for the Ly6G granulocyte marker. The polygram gate highlights the proportion of macrophages defined as CD45hi CD11b+ Ly6G-Sytox blue- in the total cell preparation. (D) The absolute numbers of macrophages from the contralateral and ipsilateral brain hemispheres quantified by flow cytometry following TBI on days 1, 4, 7, or 14 or sham surgery are shown as mean +SEM of 16 (day 1), 8 (day 4), 4 (day 7), 8 (day 14) or 2-4 (sham) mice. Data shown are pooled from 14 experiments performed. ****p<0.0001, **p<0.005, unpaired t-tests with Welch's corrections.
To assess leukocyte subset frequencies present in the brain following TBI, single cell suspensions from TBI and sham-injured brain contralateral and ipsilateral hemisphere tissues were analyzed by flow cytometry. Flow cytometry permitted discrimination of macrophages from microglia based on levels of CD45 expression; both microglia and macrophages express CD11b, but macrophages express a higher level of CD45 [30, 31]. In our analyses of macrophages and microglia, neutrophils (which also express CD45 and CD11b) were consistently excluded by using an antibody against Ly6G (Clone 1A8). Blood leukocytes were excluded by perfusing the brain prior to cell recovery.
Flow cytometry plots of cell preparations from brain tissues four days following TBI of wild type mice showed that macrophages are a major part of the inflammatory response to TBI primarily on the side of injury (Figure 1C); macrophages comprised 40±2% of all CD45+ leukocytes in the ipsilateral TBI hemisphere compared with 5.7±1.5% of CD45+ cells in sham control tissues (p<0.001).
Quantification of the kinetics of macrophage numbers that accumulate in brain hemispheres after TBI revealed that macrophage infiltration in ipsilateral hemispheres of TBI mice increased by 21-fold on day 1 (mean ± SEM, 22,115 ± 1,732), and by 77-fold on day 4 (46,968 ± 5918) compared with sham controls (1,081±151, 613± 205 respectively) (Figure 1D). On day 7, wild type ipsilateral TBI macrophage numbers declined but were still 25-fold higher than levels in sham controls, and on day 14 macrophage numbers were 4-fold higher (Figure 1D).
On the first day following TBI, there was also a substantial increase in neutrophils (CD45hiCD11b+Ly6G+) in the brain (41,520 ± 4,533 compared with 1,419 ± 94 in sham controls), with a decline thereafter (Figure 1D). These findings are similar to the recent findings of Jin et al. [32], although our results add quantification of absolute cell numbers as well as proportions, and we find that macrophage levels are higher on day 4 than on day 1.
Early macrophage response to TBI includes Arg1+ and Arg1- subsets
To examine macrophage polarization post-TBI, we first sought to trace the genetic expression of Arg1, which is highly expressed during M2 polarization, or of Il12b, the gene for IL-12p40, a signature of M1 polarization. To do this, we took advantage of two reporter mouse strains, YARG (YFP-Arginase-1) and Yet40 (YFP-enhanced transcript for IL-12p40) [28, 33]. TBI was performed in YARG and Yet40 mice, and YFP expression in brain and peripheral blood leukocytes was compared by flow cytometry to wild type animals, which lack YFP expression.
One day after TBI, 21±1.5% (mean ± SEM, n=6) of ipsilateral hemisphere brain macrophages in YARG mice expressed YFP (Figure 2A), but brain macrophages in the contralateral hemisphere and from either hemisphere of sham animals uniformly lacked YFP (data not shown). YFP expression in YARG brain macrophages peaked on day 1 after TBI, fell to 4-7% of the macrophage population by day 4, and was undetectable on days 7 and 14 (data not shown). YFP expression could not be detected in microglia following TBI at any time point. F4/80+ blood monocytes isolated from the same injured YARG animals also lacked expression of YFP (Figure 2A), suggesting that TBI induces macrophage differentiation after localization in the tissue. Brain macrophages and blood monocytes from TBI animals differed markedly not only in YFP expression but also in their gene expression profiles as assessed by microarray (Figure 4 and Supporting Information Figure 1), confirming that macrophages isolated from brains were not significantly contaminated by blood monocytes. Yet40 mice subjected to TBI had little or no upregulation of YFP in macrophages or microglia on days 1, 4, 7, and 14 (day 1 is shown), and this was subsequently confirmed for macrophages by microarray analysis for IL–12p40 on day 1 where all comparison ratios were close to 1, indicating no change in expression in comparison to blood monocytes or between brain macrophage subsets. Thus, TBI rapidly induces a macrophage response that is characterized at early time points by at least two major subsets of cells that differ in Arg1 expression, and these are hereafter called Arg1+ and Arg1- cells.
Figure 2. YFP is upregulated in a subset of brain macrophages from YARG mice one day post-TBI.

(A) Leukocytes isolated from the ipsilateral hemisphere of wild type, YARG, and Yet40 mice one day after TBI were analyzed for YFP expression in live cells gated on brain macrophages (CD45high CD11b+ Ly6G-, top), microglia (CD45lo CD11b+ Ly6G-, middle), or peripheral blood monocytes (CD11b+ F4/80+ Ly6G-, bottom). YFP expression is set by box gates based on wild type controls (left). Data shown are from one experiment that is representative of three experiments with Yet40 mice with controls, and six experiments with YARG mice with controls. (B) Assessment of CD86 expression in Arg1+ and Arg1- ipsilateral hemisphere macrophage subsets and in microglia from YARG mice by flow cytometry. Data shown are representative of expression detected at four days post-surgery and are from one experiment representative of three performed. (C) Assessment of MHC class II expression in Arg1+ and Arg1- ipsilateral hemisphere macrophage subsets and in microglia from YARG mice. Data shown are representative of expression detected at four days post-surgery and are from one experiment representative of three performed.
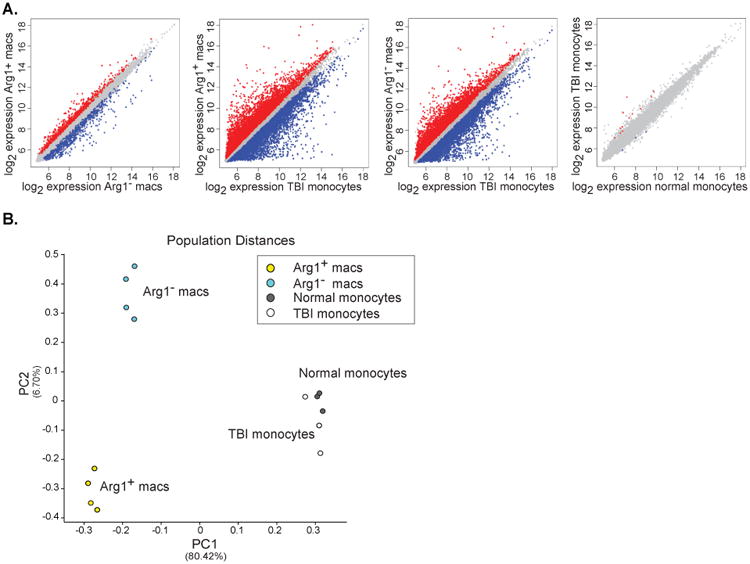
Figure 4. Differences between Arg1+ and Arg1- macrophage subsets and peripheral blood monocytes revealed by gene expression profiling.

(A) Microarray data comparing gene expression by Arg1+ TBI macrophages, Arg1- TBI macrophages, TBI monocytes, and normal monocytes (n=4 per population) were examined in a pairwise analysis. Red and blue color dots represent genes with significant differences. (B) Principal component analysis using the top 15% most variable genes between all populations analyzed by microarray. The distance between the indicated cell populations is proportionate to their differences in gene expression.
Analysis of markers for cell activation and for antigen presentation on macrophages from YARG mice revealed that both Arg1+ and Arg1- populations upregulated the activation marker CD86 compared with sham control macrophages (Figure 2B). Few Arg1+ macrophages, however, expressed MHC class II antigens (MHCII; Figure 2C), a marker that has been described on both M1 and M2 cells [17, 34]. In contrast, 25-30% of Arg1- macrophages expressed MHCII (Figure 2C). This is similar to the proportion of macrophages that express MHCII in sham brains (Figure 2C), and it suggests that the Arg1- cells include at least two subpopulations, one lacking and the other expressing MHCII.
Although microglia from TBI brains did not express detectable MHCII (Figure 2C), virtually all microglia upregulated CD86 following TBI (Figure 2B). This finding is consistent with previous observations that TBI induces widespread activation of microglia [35, 36].
To examine the spatial localization of YFP+ cells in YARG mice post-TBI, we performed immunofluorescent colabeling for YFP and F4/80 in brain sections four days post-TBI, when macrophage infiltration of the brain peaks. F4/80+ macrophages/microglia localized in and around the area of injury (Figure 3, second row). F4/80 expression was below level of detection by immunofluorescence in sham injured tissues (data not shown). The Arg1+ cells were scattered amongst the F4/80+ cells in TBI mice (Figure 3, 3rd row) and were not detectable in the contralateral hemisphere or in sham-treated mice. The majority of the Arg1+ cells costained with F4/80. As suggested from our flow cytometry data in which only a subset of macrophages expresses YFP, the majority of F4/80+ cells were Arg1- (Figure 3).
Figure 3. Immunofluorescent microscopy of YFP and F4/80 costaining in the cortex of YARG mice post-TBI.
Representative images from colabeling experiments of YFP, F4/80, and DAPI on the contralateral (1st column) and ipsilateral cortex (2nd column) of brain tissue four days post-TBI. Scale bar represents 50 μm. The top areas of columns 1 and 2, devoid of DAPI staining, are outside the boundary of brain tissue. The third column shows higher magnification of macrophages in the ipsilateral cortex; scale bar 25 μm. Arrows indicate cells colabeled with anti-YFP and anti-F4/80 antibodies. Data shown are from one experiment performed and are representative of four experiments performed analyzing three animals, 10 sections per animal.
Arg1+ and Arg1- brain wound macrophages represent at least two distinct subsets
To further characterize the nature of brain macrophages following TBI, we sorted the Arg1+ and Arg1- cell populations from the ipsilateral hemisphere of YARG mice 1 day after TBI (when the proportion of Arg1+ cells peaked) and performed gene expression analysis of both cell populations. We also examined gene expression by peripheral blood monocytes from injured animals to assess the expression state of monocytes prior to their infiltration into the brain and differentiation into macrophages. As a control, peripheral blood monocytes from uninjured animals were also analyzed. It was not technically feasible to perform arrays on brain macrophages from sham animals, because there were insufficient cells to generate adequate amounts of RNA. Pairwise analyses of differentially expressed genes showed that Arg1+ and Arg1- brain macrophages differed in the expression of 1,360 genes, and both populations showed even greater differences from TBI monocytes (11,799 genes differed between Arg1+ macrophages and TBI monocytes; 9,932 genes differed between Arg1- macrophages) (Figure 4A). TBI monocytes displayed few differences compared with normal monocytes (15 genes) (Figure 4A). Principal component analysis (PCA), an analytical technique that uses dimensionality reduction to identify dominant patterns within highly multivariate data, was performed. PCA confirmed that distinctions separating macrophages from monocytes were the largest source of variance in the dataset (principal component 1), and that the monocyte populations had fewer differences that were not represented in either of the top two principal components (Figure 4B). PCA also confirmed that Arg1+ and Arg1- brain macrophages represented two distinct populations, representing the second most significant principal component (PC2) (Figure 4B).
TBI-induced macrophages exhibit transcriptional responses distinct from known macrophage subsets
Although robust Arg1 expression is often used as a marker for alternative activation of macrophages, we observed that Arg1+ and Arg1- brain macrophages after TBI did not represent clear M2 and M1 macrophages respectively, but instead each subset expressed markers of both M1 and M2 cells. Comparison of gene expression between Arg1+ and Arg1- macrophages confirmed that the former expressed much higher levels of Arg1 (8-fold) as well as higher levels of Mrc1 (2.4 fold), which encodes the mannose receptor/CD206 [17] (Figure 5). Increased expression of these two genes is a feature of M2 cells. The expression of other genes, however, indicated that Arg1+ macrophages were not identical to M2 cells. For example, Arg1+ macrophages preferentially expressed Nos2 (2.1 fold), an M1-assocated gene [17] (Figure 5). Similarly, although Arg1- macrophages had increased expression of Il1b (interleukin-1β) (2.4 fold), they also preferentially expressed signature M2 markers, notably Retnla (resistin-like α) (2.1 fold), and Clec10a (C-type lectin domain family 10, member A)/CD301 (2.9 fold) [17, 37] (Figure 5). The relative increases in expression levels of Arg1, Mrc1, Nos2, and Il1b were confirmed by real-time PCR, demonstrating that relative to GAPDH, these genes were indeed transcriptionally active (Figure 6). In accordance with flow cytometry data (Figure 2C), gene expression analysis of MHCII, a molecule thought to be on both M1 and M2 cells, revealed that the Arg1- macrophage population as a whole expressed much higher levels of MHCII transcripts (not shown) and higher levels of Ciita (class II, MHC, transactivator) than the Arg1+ macrophages (Figure 5). The MHCII+ Arg1- macrophages may thus have increased capacity to present antigen to CD4+ T cells.
Figure 5. Differences in transcriptional responses between Arg1+ and Arg1- brain wound macrophages selecting for genes associated with M1 and M2 polarization and/or with other selected macrophage functions genes.

(A) Gene expression analysis comparing Arg1+ TBI macrophages and Arg1- TBI macrophages one day after injury. Thirty-five selected genes of interest with significant relative differences of close to two-fold or higher are shown. Each column represents a separate experiment. Gene expression was log2 transformed and median-centered across genes. Yellow represents a relative increase in expression and blue signifies a relative decrease. Expressed genes are grouped by function. (B) Average gene expression differences from the data in Figure 4A were quantified and ratios of gene expression levels comparing Arg1+ brain wound macrophages to Arg1- brain wound macrophages are shown.
Figure 6. Semi-quantitative real-time PCR data of selected M2, M1 and chemotaxis associated genes identified by microarray analysis to have significant differences between the macrophage populations.

Data were normalized to GAPDH levels and are shown as mean ± SEM of triplicate values. Data shown are from one experiment representative of two experiments performed on separate animals.
Taken together, we conclude that Arg1+ and Arg1- macrophages each have mixed expression of M2 and M1 properties, and under the conditions of TBI Arg1 cannot be used as a marker for conventional M2 cells. To further compare Arg1+ and Arg1- TBI brain macrophages with M1 and M2 macrophages, we performed a meta-analysis of genes differentially expressed between Arg1+ and Arg1- TBI brain macrophages compared with genes differentially expressed between IFNγ-stimulated or IL4-stimulated bone marrow-derived macrophages (BMDMs) stimulated in vitro with IFNγ or with IL–4, representing M1 and M2 cells respectively [38]. Arg1+ and Arg1- macrophages each upregulated a variety of genes that were also expressed by BMDMs in response to either IFN-γor IL-4 (Figure 7). Thus, Arg1+ and Arg1− TBI brain macrophage subsets have features of both M1 and M2 phenotypes (Figure 7). There are at least two explanations for these findings, not mutually exclusive: (i) individual brain macrophages may have features of both M1 and M2 cells (including cells that are incompletely polarized or are in transition from between different states of polarization and (ii) there may be subsets of cells within the Arg1+ and Arg1− cells that have different expression of M1 and M2 markers. Regardless, the gene expression profiles demonstrate that Arg1+ and Arg1- macrophages differ by many genes other than just Arg1.
Figure 7. TBI macrophage subsets express genes induced in vitro by IFN-γ or by IL-4 stimulation.

Genes that were differentially expressed between IFN-γ-stimulated and IL-4 stimulated bone marrow-derived macrophages were compared in a meta-analysis for their expression between Arg1+ macrophages and Arg1- macrophages. Each column represents a separate experiment. The data were median-centered across genes. To the right, genes representing each cluster are shown.
The most striking and novel differences between Arg1+ and Arg1- macrophages were in their unique chemokine profiles. Arg1+ macrophages preferentially expressed a chemokine repertoire that included Ccl24 (which is also secreted by M2 cells; 6.2 fold), Cxcl7 (5.4 fold), Cxcl4 (2.4 fold), Cxcl3 (4.5 fold), Cxcl1 (3.6 fold), Cxcl14 (2.4 fold), and Ccl8 (2.3 fold) (Figure 5). Arg1- macrophages, in contrast, preferentially upregulated Ccl17 (6.8 fold), Ccl5 (4.4 fold), Ccl22 (3.7 fold), and Ccr7 (10 fold) (Figure 5).
Although the gene profile of the Arg1+ macrophages suggests that they are not typical or homogeneously polarized M2 cells, they may have a role in promoting wound healing and in suppressing inflammation. Thus, Arg1+ macrophages preferentially expressed Spry2 (sprouty2; 2.4 fold), Cd9 (2.2. fold), Cd38, and Mt2 (metallothionein-2; 4.2 fold, Figure 5). Sprouty2 and CD9 have protective roles in wound healing in skin injury models [39, 40]. Mt2 and Cd38 have been implicated in neuroprotection during brain injury [41, 42]. Arg1+ brain macrophages also preferentially expressed several other genes that are associated with protection against tissue injury, including Cd36 (3.8 fold), Hmox1 (heme oxygenase 1; 3.4 fold), Folr2 (folate receptor-2; 2.6 fold), Prdx6 (periredoxin-6; 2.5 fold), and Spsb4 (SPRY domain- and SOCS box-containing protein 4; 2.5 fold) (Figure 5) [43-49]. If Arg1+ cells do have the potential for neuroprotection following TBI, this may be overwhelmed by Arg1- cells, which are greater in number and are less transient.
Discussion
Our findings demonstrate a heterogeneous macrophage response to TBI that changes over time. Expression profiling of Arg1+ and Arg1- macrophage subpopulations demonstrate that they do not exemplify previously described in vitro-derived macrophage subsets [17]. They also differ from macrophages that accumulate in skin wound macrophages [50]. Skin wound macrophages, like TBI-induced Arg1+ cells, both express Arg1 and Mrc1. However, skin macrophages additionally upregulated Clec7a, and do not express Nos2, features that distinguish them from TBI-induced Arg1+ cells.
It may not be surprising that the macrophage response to TBI differs from macrophage polarization induced in vitro or in other organs and other in vivo conditions. It is likely that macrophages can assemble their functions and products in a variety of combinations with great diversity. Our findings do demonstrate the heterogeneity of the macrophage response to TBI and they suggest that Arg1 should not in isolation be used as a marker for M2 cells. In this regard, Arg1 expression can be induced by pathways independent of IL–4/STAT6 [51].
Although we were able to identify macrophage subsets by using Arg1 as a marker in YARG mice, we could not detect robust expression of IL–12p40 by flow cytometry on days 1, 4, 7 or 14 in any macrophages or microglia by using Yet40 mice or by gene expression profiling comparing Arg1+ macrophages Arg1- macrophages, as assessed by gene profiling. This suggests that IL-12p40 may not be a major effector cytokine promoted by brain macrophages or microglia in TBI, and that early in TBI, IL-12p40 is not inversely proportional to Arg1 expression. Other M1 genes are detected, however, both in Arg1+ and Arg1- cells. Thus, the use of a single marker to define M1 and M2 cells in TBI appears not to be sufficient, and the functional consequences of the Arg1+ and Arg1- cell populations on the course of TBI remain unknown.
Our findings do not exclude the possibility that there are more than two subsets of responding macrophages, and this is clearly supported by the bimodal expression of MHCII in Arg1− macrophages. Also, despite the extensive differences in gene expression between these cell subsets particularly in the expression of chemokines, it is also possible that Arg1+ and Arg1- macrophages may have a shared lineage and/or be partially polarized and that one subtype could become or becoming the other.
Before conducting the microarrays, we initially considered that the Arg1+ cells might be M2 macrophages, whose formation relies on the transcription factors, PPARγ and PPARδ (peroxisome proliferator-activated receptor γ and δ) [17]. We therefore treated YARG mice both before and after TBI with PPAR agonists, rosiglitazone and GW0742, but we observed no increase in generation of YFP+ cells. This may reflect our subsequent demonstration that the Arg1+ cells are not, in fact, typical homogeneous M2 cells. Other studies of TBI have shown a beneficial effect of rosiglitazone during TBI, which was associated with reduced presence of myeloid cells, although mechanisms directly involving macrophages were not established [52].
Our findings expand our knowledge on chemokines expressed during TBI. Prior gene expression arrays analyzing cortical brain tissue found that IL-8, CCL2, CCL3, CCL4, CCL6, CCL9, CCL12, CXCL10, and CXCL16 were upregulated [5]. Our results identify macrophage subsets as a source of several additional chemokines (Figure 5) that differ from those that have been previously described, in addition to showing that production of chemokines varies between macrophage subsets.
Macrophages and microglia have distinct roles during homeostasis and pathogenic diseases [11, 53]. Our studies took advantage of flow cytometry to distinguish macrophages from microglia [30]. It is difficult to make this separation by immunohistology, because microglia and macrophages share many markers. Using YARG and Yet40 reporter mice, we did not detect arginase-1, IL12p40, or MHCII expression in microglia before or after TBI. Thus, microglial activation in TBI was dissimilar from macrophages, despite a broad increase in CD86 expression in both cell types.
In summary, our studies demonstrate that TBI-induces a robust infiltration of macrophages that differentiate into at least two subpopulations in the brain. The two subsets colocalize near the site of injury. They express distinct repertoires of chemotactic molecules, including some that were not previously associated with TBI. In studying the effect of macrophages on the consequences of TBI and in designing strategies to alter these effects, it may be important to consider the role of different macrophage subsets in shaping protective versus pathological responses.
Materials and Methods
Animals
C57BL/6 wild type males (age 10-16 weeks) were purchased from the Jackson Laboratory (Bar Harbor, Maine). YARG and Yet40 knock-in mice were generated from C57BL/6 mice as previously described [28, 33] and bred in the AALAC-approved transgenic animal facility of the San Francisco VA Medical Center. YARG mice express enhanced YFP from an IRES inserted at the 3′ end of the Arg1 gene, leaving the gene and regulatory regions intact, and Yet40 mice express enhanced YFP from an IRES inserted at the 3′ end of the IL-12p40 promoter. Where indicated, mice were administered LPS at 10 mg/kg i.p. and euthanized 4 days later.
Surgery
Controlled cortical impact (CCI) surgery or sham surgery was performed on anesthetized animals under a protocol approved by the San Francisco VA Medical Center Animal Care Committee. Briefly, bupivacaine was administered subcutaneously above the skull, and an incision was made followed by a 2.5 mm circular craniectomy. TBI was inflicted by a 2 mm circular, flat pneumatic piston traveling at 3 m/s, penetrating 1.5 mm, for 150 ms (Amscien Instruments, Richmond, VA with extensive modifications by H&R Machine, Capay, CA). Target brain coordinates for the center of injury were 1.5 mm lateral, 2.3 mm posterior to the bregma point. After minor bleeding had ceased, the skin was clipped together and animals were monitored for recovery. Sham animals received all surgical procedures without piston impact. As needed, animals were given rehydration therapy for the first three days.
Brain and blood leukocyte isolation
Brain leukocytes were harvested according to previously published methods [30]. Briefly, following perfusion brain tissues were obtained and mechanically disassociated through a 100 μm cell strainer. Washed cells were treated with 400 U/ml DNase I (Sigma-Aldrich) and 0.5 mg/ml collagenase type I (Worthington) at 37°C for 30 min. Leukocytes were isolated by separation on a Percoll gradient (Amersham Biosciences). For PBL isolation, mononuclear cells were separated from peripheral blood using ficoll-hypaque (GE Healthcare).
Flow cytometry and antibodies
Fc receptors were blocked with 10% rat serum (Sigma) and cells were stained with fluorescent antibodies. Leukocyte analysis used a combination of the following antibodies: anti-CD45 (clone Ly5) allophycocyanin (eBioscience), anti-CD11b (clone M1/70) PE (Invitrogen) or PE-Cy5 (eBioscience), anti-Ly6G (clone 1A8) PE-Cy7 (BD Biosciences), F4/80 (clone BM8) FITC or PE-Cy5 (eBioscience), MHCII (clone M5/114.15.2) PE (eBioscience), CD86 (clone GL1) PE (eBioscience). SYTOX Blue (Invitrogen) was used to gate out dead cells. Cells were sorted on a FACSAria (BD Biosciences), and data were analyzed using Flow Jo Software (Treestar). All data represent mean ± SEM.
Histology
Brains were perfused with saline followed by 3.7% formaldehyde. After a 2 h fixation, brains were incubated in 30% sucrose overnight and frozen in tissue-freezing medium (Sakura, Inc). For hematoxylin and eosin (H&E) staining, brains were sectioned 10 μm thick onto glass slides, heat-dried, and stained (at least 3 animals/group were analyzed, 5 sections/animal). For F4/80 staining, 5 μm sections that were quenched for endogenous peroxidases and blocked with streptavidin and biotin (VectorLabs) were immunostained with an anti-F480 antibody (Clone BM8, eBioscience), followed by goat anti-rabbit biotinylated antibody and visualized using a Vectastain ABC elite kit (VectorLabs) (3 animals/group and at least 5 sections/animal were analyzed).
For immunofluorescent labeling of YFP and F4/80, a biotinylated goat anti-YFP antibody (Abcam) and streptavidin-HRP (Perkin Elmer) were used and amplified by fluoresceinated tyramide (Perkin Elmer). After an additional round of quenching and blocking, mounted sections were further stained with a biotin-conjugated anti-F4/80 (Clone BM8, eBioscience) antibody followed by streptavidin-HRP and Alexa fluor-555 conjugated tyramide (Invitrogen). DAPI (Invitrogen) was used at 300 nM to identify cellular nuclei. Sections were mounted by using Fluorogel (Electron Microscopy Services). All sections were imaged using either a Nikon Eclipse 80i microscope or an Olympus BX-51 microscope. Three TBI animals were analyzed and at least 5 sections/animal were analyzed.
Microarrays
For gene expression profiling of macrophages from YARG mice, Arg1+ macrophages (YFP+ CD45hi CD11b+ Ly6G- SYTOX Blue-) and Arg1- macrophages (YFP- CD45hi CD11b+ Ly6G- SYTOX Blue-) were isolated by flow cytometry from ipsilateral brain hemispheres at day 1 following TBI (n=4 for each cell sample). Monocytes (CD11b+ F4/80+) from peripheral blood were also collected. Sorted cells were immediately lysed in denaturation buffer and frozen. RNA was isolated by using an RNAqueous Micro kit (Ambion). Further sample preparation, labeling, and array hybridizations were performed according to standard protocols from the UCSF Shared Microarray Core Facilities and Agilent Technologies. RNA quality was assessed using a Pico Chip on an Agilent 2100 Bioanalyzer (Agilent Technologies), and RNA was amplified by use of a whole transcriptome amplification kit (Sigma-Aldrich). Subsequent Cy3-CTP labeling was performed by using a NimbleGen one-color labeling kit (Roche-NimbleGen Inc). The quality of the amplified products was assessed by using an Agilent 2100 Bioanalyzer and Nanodrop ND-8000 (Nanodrop Technologies, Inc.). The products were hybridized to Agilent whole mouse genome 4×44K microarrays according to the manufacturer's protocol. Arrays were scanned with an Agilent microarray scanner, and raw signal intensities were extracted with Feature Extraction v10.5 software. Data were normalized by using the quantile normalization method [54]. No background subtraction was performed, and the median feature pixel intensity was used as the raw signal before normalization. A one-way ANOVA linear model was fitted to the comparison to estimate the false discovery rate (FDR) for each gene for the comparison of interest, and genes with an FDR<0.05 were considered significant. Scatter plots compared averaged log2 gene expression from each group. Principal component analysis was performed using the top 15% of genes exhibiting the most variance across all samples, using the Population Distances module of GenePattern (PMID: 16642009). For heat maps, data were log2 transformed and median centered across genes. Replicates were hierarchically clustered (PMID: 16939791). Heat maps of genes selected from the top 15% most variable genes that exhibited interesting pairwise comparisons were visualized using Java Tree view (available at http://sourceforge.net/projects/jtreeview/files/) (PMID: 15180930).
Meta-analysis of transcriptional responses of brain wound macrophages to bone marrow-derived macrophages stimulated by either IFNγ or IL4 was performed using previously published tables [38]. Macrophage genes with significant changes in expression upon IFNγ or IL4 stimulation were compared with genes with significant expression differences between Arg1+ brain macrophages versus Arg1- brain macrophages.
Accession number
Microarray data were deposited in Gene Expression Omnibus (GEO) under accession number GSE39759.
Semi-quantitative real-time PCR
Total RNA was isolated from sorted cell populations, including macrophages from injured brain hemispheres and monocytes from peripheral blood, by using an RNAqueous micro kit (Ambion). Reverse transcription was performed using oligo dT primers and Superscript II reverse transcriptase (Invitrogen). Amplicons were amplified using SYBR green (New England Biolabs) and the rate of amplification was measured using a 7500 Real-time PCR machine (Applied Biosystems). Relative transcript levels for each gene were normalized to GAPDH controls by calculating delta delta cycle of threshold values. The following primers were used for: Arg1 5′-CTCCAAGCCAAAGTCCTTAGAG-3′, 5′-GGAGCTGTCATTAGGGACATCA-3′; Mrc1 5′-CTCTGTTCAGCTATTGGACGC-3′, 5′-TGGCACTCCCAAACATAATTTGA-3′; Nos2 5′-TGTGGCTGTGCTCCATAGTT-3′, 5′-CCAGGGCTCGATCTGGTAGT-3′; Il1b 5′-GCAACTGTTCCTGAACTCAACT-3′, 5′-ATCTTTTGGGGTCCGTCAACT-3′; Ccl24 5′-TCTTGCTGCACGTCCTTTATT-3′, 5′-CTAACCACTCGGTTTTCTGGAAT-3′; Cxcl4 5′-CCTGGGTTTCCGGACTGGGC-3′, 5′-CCGCAGCGACGCTCATGTCA-3′; Cxcl3 5′-CAGAGCTTGACGGTGACGCCC-3′, 5′-CCAGACACCGTTGGGATGGA-3′; Spp1 5′-ATCTCACCATTCGGATGAGTCT-3′, 5′-CTTGTGTACTAGCAGTGACGG-3′; GAPDH 5′-ATTCAACGGCACAGTCAAGG-3′, 5′-TGGTTCACACCCATCACAAA-3′.
Supplementary Material
Acknowledgments
The authors thank Ruby Gribi of the San Francisco VA Flow Cytometry core, Dr. David Erle, Andrea Barczak, Rebecca Barbeau and Joshua Pollack at the Sandler Asthma Basic Research (SABRE) Center Functional Genomics Core Facility (NIH/NCRR UCSF-CTSI Grant Number UL1 RR024131), and Ivy Hsieh of the San Francisco VA Cell Imaging core for their contributions. This work was supported by grants from the Department of Defense, which were administered by the Northern California Institute for Research and Education, and by the Department of Veterans Affairs.
Abbreviations
- TBI
traumatic brain injury
- CCI
controlled cortical impact
- MHCII
MHC class II
- YFP
yellow fluorescent protein
- PCA
principal component analysis
- PC
principal component
- BMDM
bone marrow-derived macrophage
Footnotes
Conflict of interest: The authors declare no financial or commercial conflict of interest.
References
- 1.Potts MB, Koh SE, Whetstone WD, Walker BA, Yoneyama T, Claus CP, Manvelyan HM, Noble-Haeusslein LJ. Traumatic injury to the immature brain: inflammation, oxidative injury, and iron-mediated damage as potential therapeutic targets. NeuroRx. 2006;3:143–153. doi: 10.1016/j.nurx.2006.01.006. [DOI] [PMC free article] [PubMed] [Google Scholar]
- 2.Zhang Z, Artelt M, Burnet M, Trautmann K, Schluesener HJ. Early infiltration of CD8+ macrophages/microglia to lesions of rat traumatic brain injury. Neuroscience. 2006;141:637–644. doi: 10.1016/j.neuroscience.2006.04.027. [DOI] [PubMed] [Google Scholar]
- 3.Hausmann EH, Berman NE, Wang YY, Meara JB, Wood GW, Klein RM. Selective chemokine mRNA expression following brain injury. Brain Res. 1998;788:49–59. doi: 10.1016/s0006-8993(97)01160-8. [DOI] [PubMed] [Google Scholar]
- 4.Ransohoff RM. Chemokines in neurological trauma models. Ann N Y Acad Sci. 2002;961:346–349. doi: 10.1111/j.1749-6632.2002.tb03120.x. [DOI] [PubMed] [Google Scholar]
- 5.Israelsson C, Bengtsson H, Kylberg A, Kullander K, Lewen A, Hillered L, Ebendal T. Distinct cellular patterns of upregulated chemokine expression supporting a prominent inflammatory role in traumatic brain injury. J Neurotrauma. 2008;25:959–974. doi: 10.1089/neu.2008.0562. [DOI] [PubMed] [Google Scholar]
- 6.Kumar A, Loane DJ. Neuroinflammation after traumatic brain injury: opportunities for therapeutic intervention. Brain Behav Immun. 2012 doi: 10.1016/j.bbi.2012.06.008. [DOI] [PubMed] [Google Scholar]
- 7.Popovich PG, Guan Z, Wei P, Huitinga I, van Rooijen N, Stokes BT. Depletion of hematogenous macrophages promotes partial hindlimb recovery and neuroanatomical repair after experimental spinal cord injury. Exp Neurol. 1999;158:351–365. doi: 10.1006/exnr.1999.7118. [DOI] [PubMed] [Google Scholar]
- 8.Izikson L, Klein RS, Charo IF, Weiner HL, Luster AD. Resistance to experimental autoimmune encephalomyelitis in mice lacking the CC chemokine receptor (CCR)2. J Exp Med. 2000;192:1075–1080. doi: 10.1084/jem.192.7.1075. [DOI] [PMC free article] [PubMed] [Google Scholar]
- 9.Mahad DJ, Ransohoff RM. The role of MCP-1 (CCL2) and CCR2 in multiple sclerosis and experimental autoimmune encephalomyelitis (EAE) Semin Immunol. 2003;15:23–32. doi: 10.1016/s1044-5323(02)00125-2. [DOI] [PubMed] [Google Scholar]
- 10.Dimitrijevic OB, Stamatovic SM, Keep RF, Andjelkovic AV. Absence of the chemokine receptor CCR2 protects against cerebral ischemia/reperfusion injury in mice. Stroke. 2007;38:1345–1353. doi: 10.1161/01.STR.0000259709.16654.8f. [DOI] [PubMed] [Google Scholar]
- 11.Ajami B, Bennett JL, Krieger C, McNagny KM, Rossi FM. Infiltrating monocytes trigger EAE progression, but do not contribute to the resident microglia pool. Nat Neurosci. 2011;14:1142–1149. doi: 10.1038/nn.2887. [DOI] [PubMed] [Google Scholar]
- 12.Donnelly DJ, Longbrake EE, Shawler TM, Kigerl KA, Lai W, Tovar CA, Ransohoff RM, Popovich PG. Deficient CX3CR1 signaling promotes recovery after mouse spinal cord injury by limiting the recruitment and activation of Ly6Clo/iNOS+ macrophages. J Neurosci. 2011;31:9910–9922. doi: 10.1523/JNEUROSCI.2114-11.2011. [DOI] [PMC free article] [PubMed] [Google Scholar]
- 13.Semple BD, Bye N, Rancan M, Ziebell JM, Morganti-Kossmann MC. Role of CCL2 (MCP-1) in traumatic brain injury (TBI): evidence from severe TBI patients and CCL2-/- mice. J Cereb Blood Flow Metab. 2010;30:769–782. doi: 10.1038/jcbfm.2009.262. [DOI] [PMC free article] [PubMed] [Google Scholar]
- 14.Colton CA. Heterogeneity of microglial activation in the innate immune response in the brain. J Neuroimmune Pharmacol. 2009;4:399–418. doi: 10.1007/s11481-009-9164-4. [DOI] [PMC free article] [PubMed] [Google Scholar]
- 15.Shechter R, London A, Varol C, Raposo C, Cusimano M, Yovel G, Rolls A, et al. Infiltrating blood-derived macrophages are vital cells playing an anti-inflammatory role in recovery from spinal cord injury in mice. PLoS Med. 2009;6:e1000113. doi: 10.1371/journal.pmed.1000113. [DOI] [PMC free article] [PubMed] [Google Scholar]
- 16.Weber MS, Prod'homme T, Youssef S, Dunn SE, Rundle CD, Lee L, Patarroyo JC, et al. Type II monocytes modulate T cell-mediated central nervous system autoimmune disease. Nat Med. 2007;13:935–943. doi: 10.1038/nm1620. [DOI] [PubMed] [Google Scholar]
- 17.Chawla A. Control of macrophage activation and function by PPARs. Circ Res. 2010;106:1559–1569. doi: 10.1161/CIRCRESAHA.110.216523. [DOI] [PMC free article] [PubMed] [Google Scholar]
- 18.Gordon S, Taylor P. Monocyte and macrophage heterogeneity. Nat Rev Immunol. 2005;5:953–964. doi: 10.1038/nri1733. [DOI] [PubMed] [Google Scholar]
- 19.Geissmann F, Gordon S, Hume DA, Mowat AM, Randolph GJ. Unravelling mononuclear phagocyte heterogeneity. Nat Rev Immunol. 2010;10:453–460. doi: 10.1038/nri2784. [DOI] [PMC free article] [PubMed] [Google Scholar]
- 20.Nair MG, Guild KJ, Artis D. Novel effector molecules in type 2 inflammation: lessons drawn from helminth infection and allergy. J Immunol. 2006;177:1393–1399. doi: 10.4049/jimmunol.177.3.1393. [DOI] [PMC free article] [PubMed] [Google Scholar]
- 21.Nguyen KD, Qiu Y, Cui X, Goh YP, Mwangi J, David T, Mukundan L, et al. Alternatively activated macrophages produce catecholamines to sustain adaptive thermogenesis. Nature. 2011;480:104–108. doi: 10.1038/nature10653. [DOI] [PMC free article] [PubMed] [Google Scholar]
- 22.Shi C, Pamer EG. Monocyte recruitment during infection and inflammation. Nat Rev Immunol. 2011;11:762–774. doi: 10.1038/nri3070. [DOI] [PMC free article] [PubMed] [Google Scholar]
- 23.Daley JM, Brancato SK, Thomay AA, Reichner JS, Albina JE. The phenotype of murine wound macrophages. J Leukoc Biol. 2010;87:59–67. doi: 10.1189/jlb.0409236. [DOI] [PMC free article] [PubMed] [Google Scholar]
- 24.Kigerl KA, Gensel JC, Ankeny DP, Alexander JK, Donnelly DJ, Popovich PG. Identification of two distinct macrophage subsets with divergent effects causing either neurotoxicity or regeneration in the injured mouse spinal cord. J Neurosci. 2009;29:13435–13444. doi: 10.1523/JNEUROSCI.3257-09.2009. [DOI] [PMC free article] [PubMed] [Google Scholar]
- 25.Lloyd E, Somera-Molina K, Van Eldik LJ, Watterson D, Wainwright M. Suppression of acute proinflammatory cytokine and chemokine upregulation by post-injury administration of a novel small molecule improves long-term neurologic outcome in a mouse model of traumatic brain injury. J Neuroinflammation. 2008;5:28. doi: 10.1186/1742-2094-5-28. [DOI] [PMC free article] [PubMed] [Google Scholar]
- 26.Clausen F, Hanell A, Israelsson C, Hedin J, Ebendal T, Mir AK, Gram H, Marklund N. Neutralization of interleukin-1beta reduces cerebral edema and tissue loss and improves late cognitive outcome following traumatic brain injury in mice. Eur J Neurosci. 2011;34:110–123. doi: 10.1111/j.1460-9568.2011.07723.x. [DOI] [PubMed] [Google Scholar]
- 27.Ziebell JM, Bye N, Semple BD, Kossmann T, Morganti-Kossmann MC. Attenuated neurological deficit, cell death and lesion volume in Fas-mutant mice is associated with altered neuroinflammation following traumatic brain injury. Brain Res. 2011;1414:94–105. doi: 10.1016/j.brainres.2011.07.056. [DOI] [PubMed] [Google Scholar]
- 28.Reese TA, Liang HE, Tager AM, Luster AD, Van Rooijen N, Voehringer D, Locksley RM. Chitin induces accumulation in tissue of innate immune cells associated with allergy. Nature. 2007;447:92–96. doi: 10.1038/nature05746. [DOI] [PMC free article] [PubMed] [Google Scholar]
- 29.Wu D, Molofsky AB, Liang HE, Ricardo-Gonzalez RR, Jouihan HA, Bando JK, Chawla A, Locksley RM. Eosinophils sustain adipose alternatively activated macrophages associated with glucose homeostasis. Science. 2011;332:243–247. doi: 10.1126/science.1201475. [DOI] [PMC free article] [PubMed] [Google Scholar]
- 30.Sedgwick JD, Schwender S, Imrich H, Dorries R, Butcher GW, ter Meulen V. Isolation and direct characterization of resident microglial cells from the normal and inflamed central nervous system. Proc Natl Acad Sci U S A. 1991;88:7438–7442. doi: 10.1073/pnas.88.16.7438. [DOI] [PMC free article] [PubMed] [Google Scholar]
- 31.Ransohoff RM. Microglia and monocytes: 'tis plain the twain meet in the brain. Nat Neurosci. 2011;14:1098–1100. doi: 10.1038/nn.2917. [DOI] [PubMed] [Google Scholar]
- 32.Jin X, Ishii H, Bai Z, Itokazu T, Yamashita T. Temporal changes in cell marker expression and cellular infiltration in a controlled cortical impact model in adult male C57BL/6 mice. PLoS One. 2012;7:e41892. doi: 10.1371/journal.pone.0041892. [DOI] [PMC free article] [PubMed] [Google Scholar]
- 33.Reinhardt RL, Hong S, Kang SJ, Wang ZE, Locksley RM. Visualization of IL-12/23p40 in vivo reveals immunostimulatory dendritic cell migrants that promote Th1 differentiation. J Immunol. 2006;177:1618–1627. doi: 10.4049/jimmunol.177.3.1618. [DOI] [PubMed] [Google Scholar]
- 34.Martinez FO, Helming L, Gordon S. Alternative activation of macrophages: an immunologic functional perspective. Annu Rev Immunol. 2009;27:451–483. doi: 10.1146/annurev.immunol.021908.132532. [DOI] [PubMed] [Google Scholar]
- 35.Faden AI. Microglial activation and traumatic brain injury. Ann Neurol. 2011;70:345–346. doi: 10.1002/ana.22555. [DOI] [PubMed] [Google Scholar]
- 36.Ramlackhansingh AF, Brooks DJ, Greenwood RJ, Bose SK, Turkheimer FE, Kinnunen KM, Gentleman S, et al. Inflammation after trauma: Microglial activation and traumatic brain injury. Ann Neurol. 2011;70:374–383. doi: 10.1002/ana.22455. [DOI] [PubMed] [Google Scholar]
- 37.Murray PJ, Wynn TA. Obstacles and opportunities for understanding macrophage polarization. J Leukoc Biol. 2011;89:557–563. doi: 10.1189/jlb.0710409. [DOI] [PMC free article] [PubMed] [Google Scholar]
- 38.Zhang S, Kim CC, Batra S, McKerrow JH, Loke P. Delineation of diverse macrophage activation programs in response to intracellular parasites and cytokines. PLoS Negl Trop Dis. 2010;4:e648. doi: 10.1371/journal.pntd.0000648. [DOI] [PMC free article] [PubMed] [Google Scholar]
- 39.Zhang J, Dong J, Gu H, Yu S, Zhang X, Gou Y, Xu W, et al. CD9 Is Critical for Cutaneous Wound Healing through JNK Signaling. J Invest Dermatol. 2011 doi: 10.1038/jid.2011.268. [DOI] [PubMed] [Google Scholar]
- 40.Wietecha MS, Chen L, Ranzer MJ, Anderson K, Ying C, Patel TB, DiPietro LA. Sprouty2 downregulates angiogenesis during mouse skin wound healing. Am J Physiol Heart Circ Physiol. 2011;300:H459–467. doi: 10.1152/ajpheart.00244.2010. [DOI] [PMC free article] [PubMed] [Google Scholar]
- 41.Santos CR, Martinho A, Quintela T, Goncalves I. Neuroprotective and neuroregenerative properties of metallothioneins. IUBMB Life. 2012;64:126–135. doi: 10.1002/iub.585. [DOI] [PubMed] [Google Scholar]
- 42.Levy A, Bercovich-Kinori A, Alexandrovich AG, Tsenter J, Trembovler V, Lund FE, Shohami E, et al. CD38 facilitates recovery from traumatic brain injury. J Neurotrauma. 2009;26:1521–1533. doi: 10.1089/neu.2008.0746. [DOI] [PMC free article] [PubMed] [Google Scholar]
- 43.Nussler AK, Hao L, Knobeloch D, Yao P, Nussler NC, Wang Z, Liu L, Ehnert S. Protective role of HO-1 for alcohol-dependent liver damage. Dig Dis. 2010;28:792–798. doi: 10.1159/000324287. [DOI] [PubMed] [Google Scholar]
- 44.Vergadi E, Chang MS, Lee C, Liang OD, Liu X, Fernandez-Gonzalez A, Mitsialis SA, Kourembanas S. Early macrophage recruitment and alternative activation are critical for the later development of hypoxia-induced pulmonary hypertension. Circulation. 2011;123:1986–1995. doi: 10.1161/CIRCULATIONAHA.110.978627. [DOI] [PMC free article] [PubMed] [Google Scholar]
- 45.Puig-Kroger A, Sierra-Filardi E, Dominguez-Soto A, Samaniego R, Corcuera MT, Gomez-Aguado F, Ratnam M, et al. Folate receptor beta is expressed by tumor-associated macrophages and constitutes a marker for M2 anti-inflammatory/regulatory macrophages. Cancer Res. 2009;69:9395–9403. doi: 10.1158/0008-5472.CAN-09-2050. [DOI] [PubMed] [Google Scholar]
- 46.Diet A, Abbas K, Bouton C, Guillon B, Tomasello F, Fourquet S, Toledano MB, Drapier JC. Regulation of peroxiredoxins by nitric oxide in immunostimulated macrophages. J Biol Chem. 2007;282:36199–36205. doi: 10.1074/jbc.M706420200. [DOI] [PubMed] [Google Scholar]
- 47.Yang D, Song Y, Wang X, Sun J, Ben Y, An X, Tong L, et al. Deletion of peroxiredoxin 6 potentiates lipopolysaccharide-induced acute lung injury in mice. Crit Care Med. 2011;39:756–764. doi: 10.1097/CCM.0b013e318206befd. [DOI] [PubMed] [Google Scholar]
- 48.Nishiya T, Matsumoto K, Maekawa S, Kajita E, Horinouchi T, Fujimuro M, Ogasawara K, et al. Regulation of inducible nitric-oxide synthase by the SPRY domain- and SOCS box-containing proteins. J Biol Chem. 2011;286:9009–9019. doi: 10.1074/jbc.M110.190678. [DOI] [PMC free article] [PubMed] [Google Scholar]
- 49.Manevich Y, Fisher AB. Peroxiredoxin 6, a 1-Cys peroxiredoxin, functions in antioxidant defense and lung phospholipid metabolism. Free Radic Biol Med. 2005;38:1422–1432. doi: 10.1016/j.freeradbiomed.2005.02.011. [DOI] [PubMed] [Google Scholar]
- 50.Daley JM, Brancato SK, Thomay AA, Reichner JS, Albina JE. The phenotype of murine wound macrophages. J Leukoc Biol. 2009 doi: 10.1189/jlb.0409236. [DOI] [PMC free article] [PubMed] [Google Scholar]
- 51.El Kasmi KC, Qualls JE, Pesce JT, Smith AM, Thompson RW, Henao-Tamayo M, Basaraba RJ, et al. Toll-like receptor-induced arginase 1 in macrophages thwarts effective immunity against intracellular pathogens. Nat Immunol. 2008;9:1399–1406. doi: 10.1038/ni.1671. [DOI] [PMC free article] [PubMed] [Google Scholar]
- 52.Yi JH, Park SW, Brooks N, Lang BT, Vemuganti R. PPARgamma agonist rosiglitazone is neuroprotective after traumatic brain injury via anti-inflammatory and anti-oxidative mechanisms. Brain Res. 2008;1244:164–172. doi: 10.1016/j.brainres.2008.09.074. [DOI] [PMC free article] [PubMed] [Google Scholar]
- 53.Ajami B, Bennett JL, Krieger C, Tetzlaff W, Rossi FM. Local self-renewal can sustain CNS microglia maintenance and function throughout adult life. Nat Neurosci. 2007;10:1538–1543. doi: 10.1038/nn2014. [DOI] [PubMed] [Google Scholar]
- 54.Bolstad BM, Irizarry RA, Astrand M, Speed TP. A comparison of normalization methods for high density oligonucleotide array data based on variance and bias. Bioinformatics. 2003;19:185–193. doi: 10.1093/bioinformatics/19.2.185. [DOI] [PubMed] [Google Scholar]
Associated Data
This section collects any data citations, data availability statements, or supplementary materials included in this article.