

Abstract
Superoxide plays a key role in many pathological processes; however, detection of superoxide by one of the most common methods using dihydroethidium may be unspecific due to overlapping fluorescence of the superoxide specific product, 2-OH-ethidium (2OH-E), and the unspecific oxidation product, ethidium. Here, we show new optimized fluorescence spectroscopy protocol that allows rapid and specific detection of superoxide in cell free systems and intact cells using dihydroethydium (DHE). We defined new optimized fluorescent settings to measure superoxide specific product and minimize interference of unspecific DHE oxidation products. Using this protocol we studied real time superoxide production by xanthine oxidase and menadione-treated cultured cells. Specificity of the plate reader-based superoxide measurements was confirmed by the inhibition of fluorescence with superoxide dismutase and HPLC analysis. We show that limitations of the HPLC-based analysis can be overcome by the optimized fluorescence spectroscopy.
Keywords: Superoxide, reactive oxygen species, dihydroethidium, hydroethidine, fluorescence, spectroscopy
Introduction
Superoxide has been implicated in the initiation and development of many pathological conditions including drug toxicity, inflammation, cardiovascular diseases and diabetes1. Despite its importance, there are a limited number of methods for measurement of superoxide in live cells and tissue. Many probes including dichlorodihydrofluorescein, lucigenin or dihydrorhodamine, have low specificity and are prone to artifacts2. Seminal work of Kalyanaraman’s group3 has shown that dihydroethidium (DHE) produces number of unspecific products and a single superoxide-specific product, 2-OH-ethidium (2OH-E; Supplement 1). Detection of 2OH-E is however complicated because of overlapping fluorescence of 2OH-E and the non-specific oxidation product, ethidium (Eth) 4. Since then, a number of concerns have been raised regarding methods that are nondiscriminatory for the fluorescence signal and measure combined fluorescence of the specific and non-specific DHE oxidation products 4. HPLC has been suggested as the best way to separate unspecific DHE products from 2OH-E 5, however, this method has number of limitations including time consuming procedures resulting in low through-put and inability to track real time intracellular and extracellular superoxide production. Because of these HPLC limitations, many investigators use fluorescent microscopy or flow cytometry without determination of specific products. These studies may be inaccurate and carry number of artifacts; Therefore, development of a rapid and specific method for detection of 2OH-E is important for studies of superoxide.
It has been recently shown that superoxide-specific product of mitochondria-targeted triphenylphosphonium-DHE conjugate (MitoSOX) has a specific excitation peak at 396 nm which can facilitate selective superoxide detection 6. The excitation spectrum of 2OH-E, however, is very similar to the Eth spectrum, and excitation at the 2OH-E peak intensity (480 nm) does not provide specific 2OH-E measurements 3. Excitation at 480 nm is used in many studies where total fluorescent is recorded 7. These settings however may generate artifacts due to unspecific ethidium fluorescence 4.
In this work, we investigated fluorescent properties of ethidium and superoxide specific product of DHE, 2OH-E, and developed an optimized fluorescence spectroscopy protocol that allows rapid and specific detection of superoxide in cell free systems and intact cells using DHE.
Material and Methods
HPLC detection of DHE
Generation of 2OH-E was confirmed by HPLC analysis as described previously 8. Briefly, DHE and its oxidation products were separated by using Thermo C18 reverse-phase HPLC Betacil column, 250 mm × 4.6 mm, 5 μm and a mobile phase containing 0.1% trifluoroacetic acid and an acetonitrile gradient (from 37% to 47% over 23 minutes) at a flow rate of 0.5 mL/min. Ethidium and 2OH-E were detected with a fluorescence detector using an emission wavelength of 580 nm and an excitation of 480 nm. A photodiode array detector was additionally used for DHE detection. To identify DHE (Molecular Probes) and its oxidation products, we used ethydium (Eth; Molecular Probes) and 2OH-E generated as described below. Standards were used in the range of 10 nM to 10 μM with injection volume of 30μl. The stock of 2OH-E was generated by complete DHE oxidation for 6 hours in superoxide generating cell-free enzymatic system containing 10 mU/ml xanthine oxidase (Roche Molecular Biochemicals Indianapolis, Ind., USA) and 0.5 mM xanthine (Sigma Chemical Co. St. Louis, Mo., USA) as previously described 5. The reaction mixture did not contain more than 0.1% of DMSO. Xanthine was prepared in advance as 50 mM stock solution in 0.9% saline. Progression of DHE oxidation to 2OH-E was tracked with HPLC analysis until complete DHE conversion.
The HPLC system was purchased from Shimadzu and consisted of central communication and control module CBM-20A, DGU-20A5 vacuum degasse, LC-20AD quaternary solvent delivery unit, LC-20AD pump rinsing kit, SIL-20AC UFLC autosampler, SPD-20A UV-VIS detector, and RF-20Axs fluorescence detector. Data was analyzed using Shimadzu LabSolutions® LC/GC Workstation v5.32 SP1 Software.
Fluorescent spectroscopy
To obtain fluorescence spectra and to generate DHE fluorescent products, 20 μM DHE from DMSO stock solution was freshly prepared in 50mM PBS (0.9% NaCl, 50 mM Na2HPO4, pH 7.4). Final DMSO content was 0.1%. The stock of 2OH-E as previously described 5 was generated by complete DHE oxidation for 6 hours in superoxide generating cell-free enzymatic system containing 10 mU/ml xanthine oxidase (Roche Molecular Biochemicals Indianapolis, Ind., USA) and 0.5 mM xanthine. Xanthine (50 mM; Sigma Chemical Co. St. Louis, Mo., USA) was prepared in 0. 9% NaCl as a stock solution and the appropriate volume was added to the reaction mixture to reach required concentration. Progression of DHE oxidation was analyzed by HPLC.
Fluorescence intensities were acquired using BioTek H1 96-well plate reader. For experiments with cultured cells black glass-bottom plates were used (BD Bioscience, USA) for all other experiments polypropylene black plates (Nunc Thermo, Denmark). The instrument was kept at 37 °C during the measurements.
Cell culture
Human aortic endothelial cells (HAECs) were purchased from Lonza and cultured in the EGM-2 medium supplemented with 2% fetal bovine serum. Cells 80–90% confluent were used for experiments. Before treatment EGM-2 medium was replaced with 50mM Krebs-HEPES buffer (145 mM NaCl, 4.86 mM KCl, 5.7 mM NaH2PO4, 0.54 mM CaCl2, 1.22 mM MgSO4, 5.5 mM glucose,; pH 7.4)
Results and Discussion
Oxidation of DHE in biological systems forms a superoxide-specific product, 2OH-E, and unspecific product, Eth. Other oxidation products do not generate considerable fluorescence. Detection of 2OH-E is however complicated because of overlapping fluorescence of 2OH-E and Eth 4. We, therefore, searched for new optimized fluorescence spectroscopy protocol that allows rapid and specific detection of 2OH-E and eliminate contribution of the Eth fluorescent signal. In order to improve specificity of 2OH-E detection, we analyzed emission spectra of commercially available ethidium (Molecular Probes) and 2OH-E generated as described in the Methods sections.. We used different excitation wavelengths to determine the best conditions to specifically detect signal of 2OH-E. As shown in Fig. 1A, excitation at 480 nm results in slightly shifted emission spectra of 2OH-E compared to Eth. Changing the excitation from 480 nm to 405 nm significantly reduced emission intensity of Eth compared to 2OH-E. Importantly, changing excitation from 480 nm to 405 nm increases specificity of the 2OH-E detection; however, the emission signal of 2OH-E is also reduced. As shown in Fig. 1B, the emission signal at 580 nm was 2.5-fold lower at 405 nm excitation compared with 480 nm excitation. Since both excitation at 405 nm and 480 nm gave distinct fluorescent spectra of 2OH-E and Eth (Fig. 1A), we calculated fluorescence ratio between 2OH-E and Eth. As shown in Fig. 1B, fluorescence ratio at 480 nm excitation was maximal at 530 nm emission (52:1 2OH-E:Eth ratio), while at 405 nm excitation fluorescence ratio was maximal at 570 nm (21:1 2OH-E:Eth ratio). In most studies when DHE is used, the probe is exited at 480 nm and the emission signal at 580 nm is recorded 7. With these settings, the ratio of 2OH-E:Eth fluorescence signals is low (Fig. 1), therefore, these conditions do not provide reliable and specific superoxide detection due to high contribution of ethidium to overall fluorescence. Analysis of the fluorescent intensity of 2OH-E and the fluorescence ratio between 2-OH-E and ethidium (Fig. 1B) shows potential to improve 2OH-E detection by changing these settings. The highest selectivity could be achieved by changing emission detection to 540 nm for excitation at 480 nm; however, this modification results in substantial reduction in fluorescence intensity. For this reason, these “selective” settings may have limited application under conditions of low level superoxide or limitations of equipment sensitivity. One possible solution is to find optimal excitation and emission wavelength which would provide high fluorescence intensity with relatively high specificity. As shown in Fig. 1B, specificity of the assay dramatically improves comparing to standard setting, when the excitation is changed to 405 nm and emission is detected at 570 nm. In our cell-free and intact cell experiments using Synergy H1 fluorescent plate reader (Biotek) we found that excitation at 405 nm and emission at 570 nm provide optimal settings. The optimal settings should be confirmed empirically depending on the sensitivity of equipment, the amount of superoxide production in biological samples and ratio of 2-OH-ethidium and ethidium. Using these settings we investigated superoxide production in a cell-free xanthine oxidase superoxide generating system and menadione-treated cultured endothelial cells.
Figure 1.

Fluorescence spectra of ethidium and 2-OH-ethidium. A. Spectra of 10 μM ethidium and 10μM 2-OH-ethidium in 100 μl PBS pH 7.4 collected when excited at 405 nm and 480 nm. B. Intensity of fluorescent signal of 2-OH-ethidium excited at 405 nm or 480 nm and compared with ethidium expressed as a ratio between 2-OH-ethidium and ethidium. Inset shows emission intensity of 20 μM 2-OH-ethidium excited at 405 nm and 480 nm.
First, we measured superoxide generation in a cell-free xanthine oxidase (0.1 mU/ml) plus xanthine (0.2 mM) enzymatic system using optimized fluorescence settings. As shown in Fig. 2, this method allowed kinetic measurements of superoxide by following fluorescence signal at 570 nm using excitation at 405 nm. Superoxide dismutase (SOD) is an enzyme that dismutates superoxide to hydrogen peroxide therefore it is frequently used in experimental models to scavenge superoxide and demonstrate specificity of an assay. It is important to note that SOD is a much better negative control then SOD mimetic compounds because of potential unspecific reactivity of fluorescent probes, reaction mixture components and metabolites 9. In measurements presented in Fig. 2, the fluorescent signal was inhibited in the presence of 50 U/ml SOD confirming superoxide specific origin of the signal. Data from this experiment appears to exhibit a delay in the fluorescence that may be a result of limited sensitivity of the method. We used very low activity of xanthine oxidase (0.1 mU/ml) to mimic physiological production of superoxide while in the previous publications 10 mU/ml xanthine oxidase was used. In first 5 minutes, the ratio between signals from xanthine oxidase+xanthine and xanthine oxidase+xanthine+SOD samples is low and thus limits capability to detect increasing fluorescence signal. This ratio increases with time and thus overcomes the limitation. In order to further confirm specificity of detected fluorescent products we analyzed these samples using HPLC with a fluorescence detection system. As shown in the inset of Fig. 2, HPLC analysis confirmed formation of the superoxide specific product 2OH-E in the presence of xantine oxidase/xanthine and DHE. Detection of superoxide in samples containing low activity of xanthine oxidase suggests that new protocol is both selective and sensitive to measure superoxide production in real biological samples.
Figure 2.

On-line superoxide detection by 10 μM DHE in xanthine oxidase system at 405 nm excitation and 570 nm emission. Freshly prepared solutions of 0.1 mU/ml xanthine oxidase and DHE from DMSO stock were mixed in 50 mM PSB pH 7.4. Superoxide production was initiated by 0.2 mM xanthine added from saline stock and inhibited by 50 units/ml SOD. Inset shows typical HPLC analysis of 2OH-E accumulation in samples containing: DHE, xanthine oxidase plus xanthine (DHE/XO/X); DHE, xanthine (DHE/X); DHE and xanthine oxidase (DHE/XO) or DHE. There were no differences in HPLC chromatograms after 10 min.
Next, we tested if this method permits specific 2OH-E detection in intact cells. For this aim we investigated fluorescence spectra of ethidium and 2-OH-ethidium in cultured human aortic endothelial cells. Cells grown on fluorescent plates at 90% confluence were loaded with 10 μM 2OH-E (prepared as described in Methods section) or Eth (from PBS stocks in Krebs-HEPES buffer) for 60 minutes and then washed with Krebs-Hepes buffer prior to measurements. The accumulation of ethidium or 2-OH-ethidium in endothelial cells was confirmed using HPLC using a previously described protocol 8. As shown in Fig. 3, excitation at 405 nm resulted in diminishing fluorescence emission spectra of the Eth. These data are consistent with cell-free data (Fig. 1A) where excitation 405 nm significantly suppressed the signal of ethidium while 2OH-E had a strong fluorescence signal.
Figure 3.
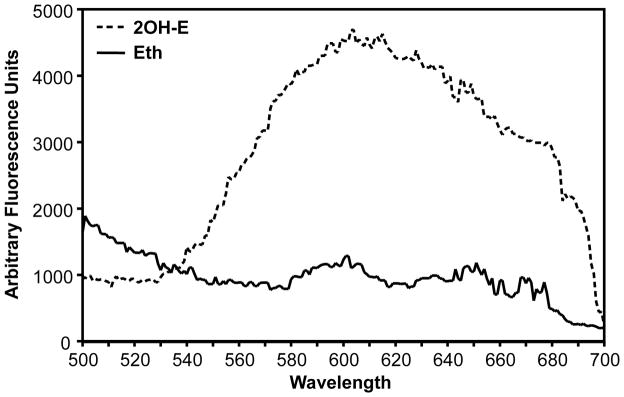
Fluorescence spectra of human endothelial cells loaded with 10μM ethidium (Eth) or 10 μM 2OH-ethidium (2OH-E) in PBS, at 405 nm excitation.
Next we investigated menadione-induced superoxide production in cultured human aortic endothelial cells. Menadione is well-known redox cycling quinone used as a model for intracellular superoxide production 10. For this experiment cells grown on a glass bottom plates were treated with menadione (15 minutes, 10 μM), washed and loaded with DHE (10 μM). Cell-permeable PEG-SOD (50 U/ml) was used to determine the specificity of the fluorescence signal. Accumulation of 2-OH-ethidium and Eth in endothelial cells was also confirmed using HPLC. Production of cellular superoxide was monitored on-line and expressed as time dependent increase in the fluorescent signal (Fig. 4A) and confirmed with HPLC as shown in the inset in Fig 4B. Accumulation of superoxide after 30 minutes of treatment is shown in Fig. 4B (plate bottom readings,) this was confirmed by HPLC as shown in the inset in Fig. 4B. Both fluorescence spectroscopy and HPLC analysis, showed similar increases in superoxide production indicating the specificity of our improved protocol. As shown in Fig. 4A, there was a slight increase of fluorescence in control unstimulated cells, indicating basal superoxide production, while menadione caused robust increase in the fluorescence signal. It is important to note that supplementation of the cells with cell-permeable PEG-SOD completely inhibited menadione-induced fluorescent signal which support the specificity of superoxide detection.
Figure 4.

Superoxide detection in cultured endothelial cells. A. On-line superoxide detection by DHE in menadione-treated cultured endothelial cells at 405 nm excitation and 570 nm emission. Human Aortic Endothelial Cells at 90% confluence grown on bottom glass fluorescence plate were pre-incubated with 0.1% DMSO (Control), 50 U/ml PEG-SOD from saline stock or 10 μM menadione from DMSO stock solution for 15 min prior to supplementation of 10 μM DHE from DMSO stock. Insert shows HPLC analysis of Control, menadione (Men) treated and menadione plus SOD (Men.+SOD) samples. B. Total superoxide production was measured in human aortic endothelial cells. Fluorescence signal was recorded at the bottom of the plate using 405 nm excitation and 570 nm emission after 60 minute incubation with 10 μM DHE in untreated cells (Control) or cell acutely supplemented with 50 U/ml PEG-SOD (Con.+SOD), menadione (Menadione) or 10 μM menadione plus 50 U/ml PEG-SOD (Men.+SOD). Insert shows HPLC analysis of of 2OH-E accumulation in the samples.
Specificity of the superoxide detection using the plate reader was confirmed by HPLC analysis of 2OH-E and ethidium in cell-free experiments and in cells treated with menadione. As shown in the insert of Fig. 2, HPLC analysis of the sample with xanthine oxidase plus xanthine and DHE showed specific accumulation of 2OH-E. HPLC analysis of cellular samples showed significant increase in 2-OH-E in menadione-treated cells (insert Fig. 4B). These data are in line with our previously reported findings 10.
Although electron spin resonance and HPLC are the most reliable methods for detection of cellular superoxide 8, these methods do not provide on-line superoxide detection in attached cultured cells and require time-consuming sample preparation. To overcome these problems the high-throughput DHE fluorescent assay has been recently suggested, however according to this method, plate reader data must be confirmed by HPLC analysis 11. Our work shows that a plate reader-based assay with optimized fluorescence protocol may overcome these limitations and provide high through output method for superoxide detection.
In summary, our data show that optimized fluorescence spectroscopy can be used for rapid and specific measurements of superoxide in cell-free systems and in intact cells to track on-line kinetic measurements or to determine superoxide production by accumulation of fluorescence signal.
Supplementary Material
Acknowledgments
This research was supported by NIH grant PO-1 HL058000.
ABBREVIATIONS
- DHE
dihydroethidium
- 2OH-E
2-OH-ethidium
- Eth
ethidium
- SOD
superoxide dismutase
- PEG-SOD
polyethylene glycol-conjugated superoxide dismutase
References
- 1.Dikalov S. Cross talk between mitochondria and NADPH oxidases. Free Radic Biol Med. 2011;51(7):1289–1301. doi: 10.1016/j.freeradbiomed.2011.06.033. [DOI] [PMC free article] [PubMed] [Google Scholar]
- 2.Kalyanaraman B, Darley-Usmar V, Davies KJ, Dennery PA, Forman HJ, Grisham MB, Mann GE, Moore K, Roberts LJ, 2nd, Ischiropoulos H. Measuring reactive oxygen and nitrogen species with fluorescent probes: challenges and limitations. Free Radic Biol Med. 2012;52(1):1–6. doi: 10.1016/j.freeradbiomed.2011.09.030. [DOI] [PMC free article] [PubMed] [Google Scholar]
- 3.Zhao H, Kalivendi S, Zhang H, Joseph J, Nithipatikom K, Vasquez-Vivar J, Kalyanaraman B. Superoxide reacts with hydroethidine but forms a fluorescent product that is distinctly different from ethidium: potential implications in intracellular fluorescence detection of superoxide. Free Radic Biol Med. 2003;34(11):1359–68. doi: 10.1016/s0891-5849(03)00142-4. [DOI] [PubMed] [Google Scholar]
- 4.Zielonka J, Kalyanaraman B. Hydroethidine- and MitoSOX-derived red fluorescence is not a reliable indicator of intracellular superoxide formation: another inconvenient truth. Free Radic Biol Med. 2010;48(8):983–1001. doi: 10.1016/j.freeradbiomed.2010.01.028. [DOI] [PMC free article] [PubMed] [Google Scholar]
- 5.Zielonka J, Vasquez-Vivar J, Kalyanaraman B. Detection of 2-hydroxyethidium in cellular systems: a unique marker product of superoxide and hydroethidine. Nat Protoc. 2008;3(1):8–21. doi: 10.1038/nprot.2007.473. [DOI] [PubMed] [Google Scholar]
- 6.Robinson KM, Janes MS, Pehar M, Monette JS, Ross MF, Hagen TM, Murphy MP, Beckman JS. Selective fluorescent imaging of superoxide in vivo using ethidium-based probes. Proc Natl Acad Sci U S A. 2006;103(41):15038–43. doi: 10.1073/pnas.0601945103. [DOI] [PMC free article] [PubMed] [Google Scholar]
- 7.Fernandes DC, Wosniak J, Jr, Pescatore LA, Bertoline MA, Liberman M, Laurindo FR, Santos CX. Analysis of DHE-derived oxidation products by HPLC in the assessment of superoxide production and NADPH oxidase activity in vascular systems. Am J Physiol Cell Physiol. 2007;292(1):C413–22. doi: 10.1152/ajpcell.00188.2006. [DOI] [PubMed] [Google Scholar]
- 8.Dikalov S, Griendling KK, Harrison DG. Measurement of reactive oxygen species in cardiovascular studies. Hypertension. 2007;49(4):717–27. doi: 10.1161/01.HYP.0000258594.87211.6b. [DOI] [PMC free article] [PubMed] [Google Scholar]
- 9.Konorev EA, Kotamraju S, Zhao H, Kalivendi S, Joseph J, Kalyanaraman B. Paradoxical effects of metalloporphyrins on doxorubicin-induced apoptosis: scavenging of reactive oxygen species versus induction of heme oxygenase-1. Free Radic Biol Med. 2002;33(7):988. doi: 10.1016/s0891-5849(02)00989-9. [DOI] [PubMed] [Google Scholar]
- 10.Fink B, Laude K, McCann L, Doughan A, Harrison DG, Dikalov S. Detection of intracellular superoxide formation in endothelial cells and intact tissues using dihydroethidium and an HPLC-based assay. Am J Physiol Cell Physiol. 2004;287(4):C895–902. doi: 10.1152/ajpcell.00028.2004. [DOI] [PubMed] [Google Scholar]
- 11.Zielonka J, Zielonka M, Sikora A, Adamus J, Joseph J, Hardy M, Ouari O, Dranka BP, Kalyanaraman B. Global profiling of reactive oxygen and nitrogen species in biological systems: High-throughput real-time analyses. J Biol Chem. 2011 doi: 10.1074/jbc.M111.309062. [DOI] [PMC free article] [PubMed] [Google Scholar]
Associated Data
This section collects any data citations, data availability statements, or supplementary materials included in this article.