Abstract
We report a 3D microfluidic pulsed laser-triggered fluorescence-activated cell sorter capable of sorting at a throughput of 23,000 cells sec−1 with 90% purity in high-purity mode and at a throughput of 45,000 cells sec−1 with 45% purity in enrichment mode in one stage and in a single channel. This performance is realized by exciting laser-induced cavitation bubbles in a 3D PDMS microfluidic channel to generate high-speed liquid jets that deflect detected fluorescent cells and particles focused by 3D sheath flows. The ultrafast switching mechanism (20 μsec complete on-off cycle), small liquid jet perturbation volume, and three-dimensional sheath flow focusing for accurate timing control of fast (1.5 m sec−1) passing cells and particles are three critical factors enabling high-purity sorting at high-throughput in this sorter.
Introduction
Following its invention in 1969, the fluorescence-activated cell sorter (FACS) has become widely used in biomedical research laboratories and hospitals for clinical diagnostics [1-3]. However, aerosols accompanying high-speed droplet generation and sorting in conventional FACS are always concerns for both sample contamination and operating personnel safety when sorting infectious samples [4]. To address this problem, various closed-form microfluidic FACS systems [5-11] have been developed over the past decade to provide sterile (contamination and infectious agent-free) sorting and improved downstream device integration for additional molecular analysis following sorting. Besides solving the aerosolization issue and offering downstream integration capabilities, microfluidic FACS systems also has strong advantages in handling structures or flows at a scale commensurate with that of single cells. This offers greater control over single cell analysis in realizing true point-of-care (POC) labon-a-chip (LOC) systems [5-11]. Moreover, from the economic perspective, miniaturizing the device reduces both device cost and reagent consumption. For example, a disposable single use device is desired for sorting pathogenic samples. For example, live E. coli can be electro-osmotically switched for sorting at a throughput of 20 cells sec−1 and enriched by 30-fold on a microfluidic chip [12]. Employing a polydimethylsiloxane (PDMS)-based pneumatic valve, a sorter has achieved a throughput of 44 cells sec−1 with 40% yield and 83-fold enrichment [13]. In this device, the slow rate of pneumatic control valve actuation blocks further increases in switching speed. Solenoid valve can also be used to switch droplets containing various number of target cells at a throughput of 30 droplets sec−1 [14]. The slow response of the solenoid valve also limits the throughput. Optical force is another mechanism used in microfluidic switching [15]. High after-sort purity of > 90% has been demonstrated with a throughput of ~100 cells sec−1 using HeLa human cancer cells [16]. A sorter utilizing a piezoelectric actuator with a PDMS valve provided an enrichment of ~230-fold and after-sort purity of ~65% at 1,000 cells sec−1 [17]. Overall, the major challenge of μFACS systems to date is the low sorting throughput and purity, compared to conventional aerosol-based FACS that yield >90% purity at 70,000 cells sec−1 [18-20]. In some fields such as oncology, stem cell research, or infectious disease biology, high purity sorting for rare target cells at high-throughput is essential. For example, the separation of human T-lymphocytes (CD4+) from the whole blood with high accuracy [8], the selection of circulating tumor cells (CTCs) from blood samples at high-throughput (7.5 ml in a few hours [10]), the isolation of fetal erythroblasts, lymphocytes, and stem cells from maternal blood at high purity (1 fetal red blood cell per 105 to 107 maternal red blood cells [21]) are all challenging applications.
Wu et al. recently demonstrated a novel sorting mechanism termed a Pulsed Laser Activated Cell Sorter (PLACS) in an attempt to bridge the gap in speed and sorting purity between μFACS and commercial aerosol FACS [22]. PLACS achieved 90% sorting purity at 3,000 cells sec−1 with high cell viability. However, the sorting purity dropped to 45% at 10,000 cells sec−1 due to the lack of third dimension flow focusing in a device with only 2D sheath flows. Cells at different vertical positions in the fluid channel with a parabolic velocity profile reached the switching zone at different times after fluorescent detection. This created a major synchronization issue between detection and sample switching and decreased the switching efficiency, especially in high-speed flow situations where the switching window was small and actuation timing was therefore critically important. This synchronization issue also decreased the sort purity at high-throughput since a large perturbation volume was required to provide a larger switching zone to ensure that detected cells arriving at different times were sorted correctly. At high-throughput sorting speeds, the distance between neighbouring cells decreased. A large switching zone needed to capture all desired cells also increased the chance of capturing nearby unwanted cells which reduced the sort purity. If this synchronization problem is not solved, there remains a trade-off between switching efficiency and sort purity at high-throughput.
Here, we present a new 3D PLACS device that utilizes multilayer 3D PDMS channels with interlayer connection vias to achieve 3D sheath focusing. This approach not only solves the synchronization issue between detection and switching but also allows efficient particle switching using a smaller bubble with smaller perturbation volume to result in a more accurate and shorter switching cycle. 3D PLACS can achieve 90% purity sorting at a throughput of 23,000 cells sec−1. This is the first microfluidic FACS to perform single stage, single channel sorting at a throughput comparable to conventional aerosol based FACS on a fully enclosed microfluidic chip.
Materials and methods
Principle of 3D PLACS
Pulsed laser-induced fluid cavitation is a promising mechanism for high-speed micro- and nano-fluid actuation. High-speed microparticle switching [23], fluid pumping [24, 25], droplet generation [26], and cell sorting [22] have been demonstrated utilizing a laser-induced water vaporization mechanism. A sharply-focused laser pulse can induce liquid water to vaporize rapidly through nonlinear optical absorption. The laser creates localized hot plasma that vaporizes water to generate rapidly expanding cavitation bubbles. The high vapor pressure inside a laser induced cavitation bubble provides a large mechanical force for fast actuation in a viscous microfluidic channel. Such high-speed and localized fluid flows have been used for cell lysing [27], inducing transient cell membrane permeability for gene delivery, and for microparticle transport [28-30]. By shaping a laser beam using holography techniques through a spatial light modulator, multiple cavitation bubbles of different shapes can be generated to create complex micro-fluid flows to deform nanostructures, such as carbon nanotubes [31].
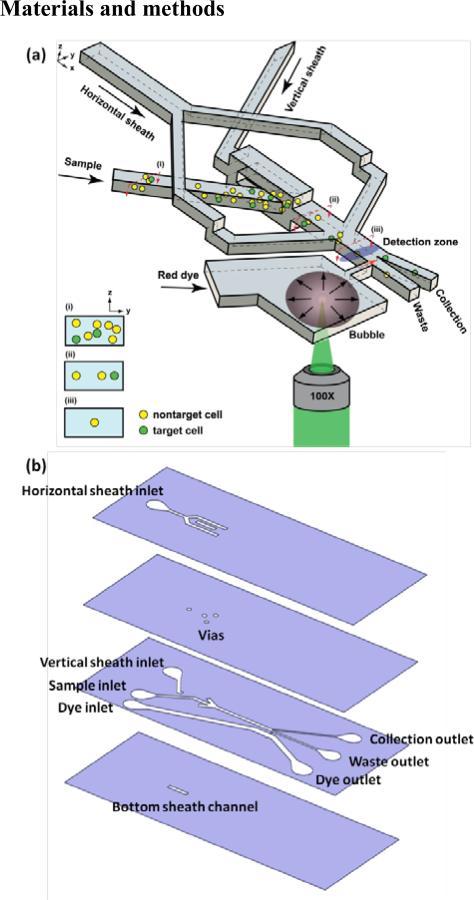
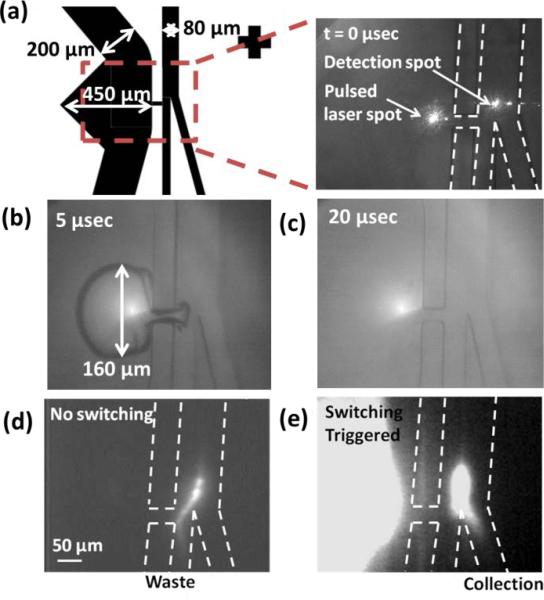
The principle of 3D PLACS is shown in Figs. 1 and 2. The device consists of a main channel with two outlets, collection and waste. Utilizing thin film PDMS fabrication techniques, 3D hydrodynamic flow focusing can be realized. Samples are focused into the waste channel initially. When cells flow through the detection zone, their fluorescent signals are collected by a 25× N.A. 0.4 objective lens and detected by a PMT (photodetector module P30CWAD5-01 SENS-TECH). When a target cell is identified, a laser pulse (Q-switched Nd:YVO4, 8 nsec pulse width, 532 nm wavelength) is triggered to generate a cavitation bubble through a 100× N.A. 0.9 objective lens with a proper delay time. Fig. 2 demonstrates a bubble with a diameter of 160 μm that creates a high-speed jet to deflect a fluorescent particle into the collection channel. At 5 μsec, the bubble expands to its largest size (Fig. 2b) and induces a liquid jet through the nozzle. With this perturbation, detected fluorescent cells, originally flowing into the waste channel (Fig. 2c), are deflected into the collection channel (Fig. 2d). The bubble collapses and fully disappears within 20 μsec.
Fig. 1.
Schematic of a 3D PLACS. (a) 3D sheath flow focusing is achieved by multilayer PDMS structures with vertical vias connecting channels in different layers. Detected fluorescent particles are deflected into the collection channel by high-speed liquid jets induced by rapidly expanding laser cavitation bubbles that squeeze fluid across a micro nozzle. (b) Microfluidic structure of each layer.
Fig. 2.
Particle switching triggered by a focused laser pulse. (a) The main channel is 80 μm wide and is split into two 40 μm wide channels after the switching junction, one for collection and one for waste. The bubble excitation channel is 200 μm in width and increases to 450 μm at the bubble excitation location. The nozzle connecting bubble channel and the main channel is 50 μm in length and 20 μm in width; (b and c) Time-resolved images showing a jet created by a bubble. The bubble expands to its maximum diameter of 160 μm (major axis) in 5 μsec and fully disappears by 20 μsec following the laser pulse; (c) fluorescent trace of a non-switched particle and (d) of a switched particle.
In the bubble excitation channel, red dye is added to reduce the laser threshold energy required to trigger a cavitation bubble. The cavitation bubble is excited at the mid-height of the channel where the highest flow speed occurs in a parabolic flow pattern. This high-speed flow not only helps remove residual bubbles that are not fully collapsed but also the heat generated at the laser excitation spot through fast convection flow, instead of through slow thermal diffusion. This prevents heat from accumulating at the same spot over time with high repetition rate excitation. Using these operating principles, PLACS enables reliable switching for >100 million bubble cycles without any thermal damage to surrounding low melting temperature PDMS structures [22].
Device design and fabrication
The microfluidic component of the 3D PLACS sorter consists of a bonded cover glass with three thin film PDMS layers containing through-layer vias and one bulk PDMS layer, as shown in Fig. 1. This device consists of four inlets, one for sample introduction, one for vertical sheath focusing, one for lateral sheath focusing, and one for introducing fluid with red dye to the cavitation bubble channel. The through-layer vias solve the fluid routing issue for 3D hydrodynamic sheath focusing. The microfluidic device is fabricated using standard soft lithography processes and a PDMS stamp. The detailed fabrication process is provided in references [32, 33]. Briefly, a SU-8 mold was fabricated on a silicon wafer. A thin layer of Cytop (CTX-809A, AGC) was coated onto the mold. A thin layer of uncured PDMS mixed with curing catalyst platinum-divinyltetramethyldisiloxane complex is spin coated onto the mold. A flat PDMS stamp treated by trichloro (1H, 1H, 2H, 2H-perfluorooctyl) silane (Aldrich) is pressed onto the mold for 4 hours until the PDMS thin film is cured. The cured PDMS film is then peeled off from the Cytop treated mold. The elastic PDMS stamp insures complete removal of residual PDMS between the SU-8 mold and the stamp to create through-layer vias. The peeled off PDMS thin film with vias is bonded strongly to a glass substrate or other PDMS layers through oxygen plasma treatment. The stamp is detached from the thin film afterward. By repeating the PDMS thin film fabrication and transfer processes, multilayer PDMS channels with interlayer vias are built in this manner.
All channels in our microfluidic devices are 40 μm in height. The main channel is 80 μm wide and is split into two 40 μm wide channels after the switching junction, one for collection and one for waste. The bubble excitation channel is 200 μm in width and increases to 450 μm at the bubble excitation location to allow more space for bubble expansion.
Experimental setup
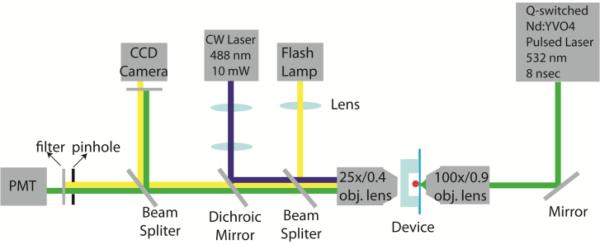
The experimental setup is illustrated in Fig. 3. A Q-switched Nd: YVO4 pulsed laser (EKSPLA, Jazz 20) is focused into the microfluidic channel through a 100× objective lens (N.A. 0.9). The laser delivers 8 nsec pulses at 532 nm wavelength with a repetition rate up to 100 kHz. A polarizer and a beam splitter are added to continuously tune the laser pulse energy between 0~100 μJ to control the size of laser-induced cavitation bubbles. For cell fluorescence excitation, a CW laser (CrystalLaser, DL-488-010, 10mW) at 488 nm wavelength is reflected by a dichroic mirror (Chroma, z488rdc) and focused through a 25× objective lens (N.A. 0.4) into the microfluidic channel. The emitted fluorescence signal is collected by the same objective lens and then detected by a photomultiplier tube (Sens-Tech, P30CWAD501) after passing through a bandpass filter (Chroma, HQ510/20m) that matches with the emission spectrum of the fluorescence under detection. A CCD camera (Zeiss, AxioCam MRm) is positioned at the conjugate image plane for observation. A flashlamp (High-Speed Photo-Systems, NANOLITE, KL-M) that can emit 11 nsec duration flash light is used as an illumination light source to take time-resolved images for calibrating and characterizing the fast dynamics of cavitation bubbles and induced high-speed liquid jets. The PMT signal is sampled and integrated by a Labview DAQ card (National Instruments, PCI 7831R). FPGA logic is programmed to perform real-time detection, threshold comparisons, and timed triggering of the laser pulses and the flashlamp.
Fig. 3.
Experimental setup. A Q-switched Nd: YVO4 pulsed laser was focused into the middle of the bubble channel through a 100×/N.A. 0.9 objective lens. CW laser at 488 nm was used for fluorescence excitation through a 25×/N.A. 0.4 objective lens. The emission fluorescence was collected by the same objective lens and detected by a photomultiplier tube (PMT) which connected to a DAQ card for signal acquisition and processing. FPGA logic was programmed using Labview to perform real-time detection, threshold comparison, and timed triggering of the pulsed laser. To observe and characterize the bubble, a flash lamp was used to capture time-resolved images on a CCD camera.
Results and discussion
Three dimensional (3D) sheath flow focus
Synchronization between fluorescence detection and cell switching is critical for achieving high-purity, high-throughput sorting. In two-dimensional sheath flow focusing, samples are confined only in the lateral direction. Without third dimension confinement, cell positions in the vertical position are not uniform. In a microfluidic channel with a parabolic flow velocity profile, cells travel at different speeds at different vertical positions and arrive at the switching zone with different delay times. Accurate timing to trigger cavitation bubble formation is hard to predict in this configuration. This imprecision could result in failure to collect target cells or collecting non-target cells that reduces the sort purity. Third dimensional flow focusing is therefore crucial to solve this synchronization issue.
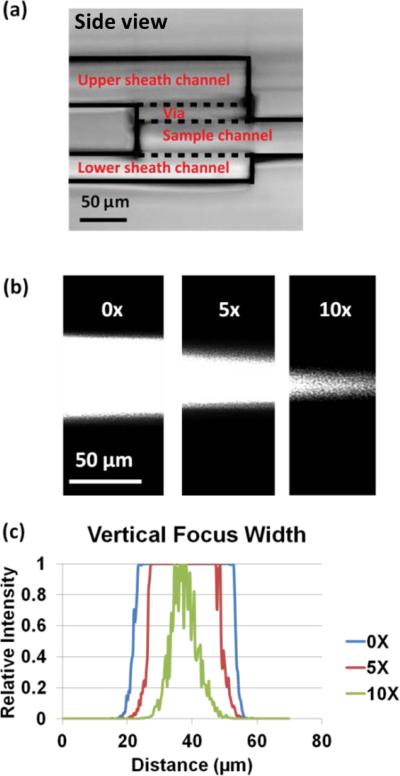
Fig. 4a shows a side view of the 3D device. To provide vertical sheath flows without interfering with the paths of sample flow and lateral sheath flows, one via layer and two extra fluid routing layers are fabricated for the device.
Fig. 4.
Vertical hydrodynamic focusing. (a) Side view of a 3D device. The sample flow is sandwiched by upper and bottom sheaths. (b) Fluorescence image of vertical focusing at different sheath/sample flow ratios. The 100 nm red fluorescent particle solution is flowing in the sample channel at a flow rate of 1 ml h−1. The upper and bottom sheaths are DI water at flow rate of 0 ml h−1, 5 ml h−1 and 10 ml h−1, respectively. (c) Measurement of sample stream width.
The vertical focusing effect is tested using DI water to introduce vertical sheath flows to focus a sample stream carrying 100 nm red fluorescent particles. The sample flow rate is set at 1 ml h−1. Different sample-sheath flow rate ratios are measured by varying the vertical sheath flow rate from 0 ml h−1, 5 ml h−1 to 10 ml h−1. Fluorescence images are taken in the main channel ~100 μm downstream of the merged junction of the sample and vertical sheath flows. At a 1:10 sample-sheath ratio, the width of the sample stream decreased from 40 μm to 10 μm (Fig. 4b).
Lateral flow focusing is demonstrated in Fig. 5a. A sample with red color dye flowing at a rate of 2 ml h−1 is laterally focused by sheath flows at a total flow rate of 20 ml h−1. At the collection and waste channel separation junction (Y junction), the focused sample stream is biased toward the waste channel (Fig. 5b). The flow rate of the bubble channel is tuned such that the sample does not flow into the collection channel or flow through the nozzle into the bubble channel. In our studies, an optimal flow rate of 20 ml h−1 is used in the bubble channel.
Fig. 5.
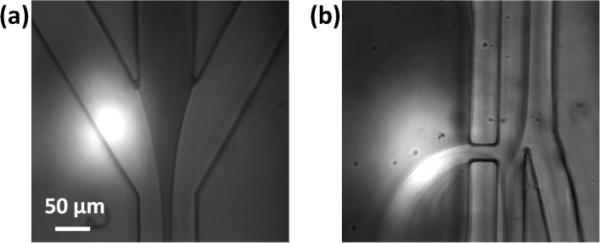
Lateral hydrodynamic focusing. (a) Sample (red color dye) flows at 2 ml h−1 and the total lateral sheath flow rate is 20 ml h−1. (b) The focused sample stream is biased towards the waste channel by the nozzle opening between the main channel and the bubble channel. The bubble channel flow rate is 20 ml h−1.
Switching window optimization and sort purity prediction
Since bubble generation and destruction time is as short as 20 μsec, successful switching critically depends on controlling the time delay from detecting the cell to triggering a bubble for sorting while considering the traveling speed of a cell. As a fluorescent cell is detected, a cavitation bubble will be triggered at the optimal time delay as the cell travelling down to the sorting junction. Switching is the most effective only when the strongest liquid jet moment meets the cell passing by the Y junction. In our sorting experiments, the distance between the detection spot and the bubble trigger spot is 50 μm. The cell traveling speed is constant at 1.5 m sec−1 due to 3D hydrodynamic focusing. We experimentally varied the delay time from detection to laser triggering and characterized the switching efficiency, which is defined as the probability of successful switching.
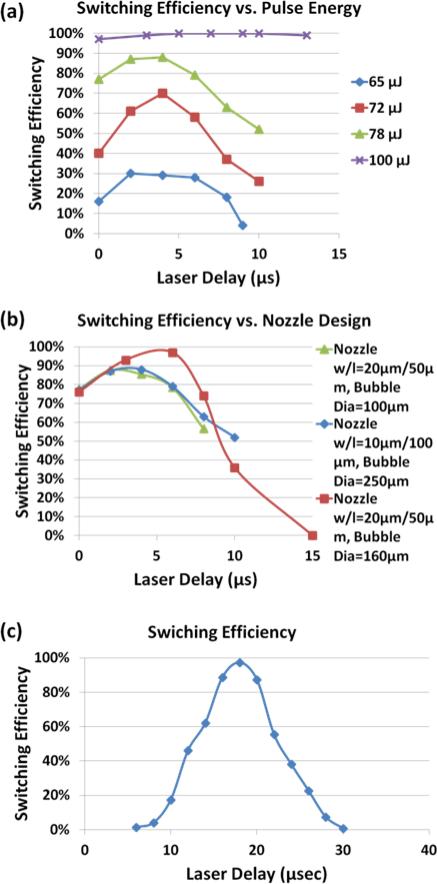
Laser pulse energy, nozzle design, and the timing of bubble triggering are critical parameters that have to be optimized to achieve high purity sorting in PLACS. To characterize the switching window, a sample solution containing 10 μm green fluorescent beads at a concentration of 106 beads ml−1 is used. The calculated average distance between neighbouring beads is 2500 μm and the probability of more than one bead passing by the detection and switching zone at the same time is 0.8% by Poisson distribution estimation. When a fluorescent bead passes through the detection zone, a camera (Zeiss, AxioCam MRm) is triggered to take an image with an exposure time of 1 msec to capture the trace of this fast moving bead. By analyzing the images of particles’ fluorescent traces, the switching efficiency, the percentage of identified beads successfully switched into the collection channel, can be measured. Two parameters, laser trigger delay time and the pulse energy, are varied to characterize the switching efficiency. In the laser pulse energy test (Fig. 6a), a device with a 10 μm wide and 100 μm long nozzle is used.
Fig. 6.
Switching window optimization. (a) Switching efficiency at different pulse energies and delay times. Larger pulse energies generate larger bubbles for higher switching efficiencies but also larger switching windows that could deflect non-target particles into collection channel. (b) Optimization of the nozzle design helps to increase the switching efficiency by narrowing the switching window to allow smaller bubbles for high purity sorting. (c) An optimized switching window is 25 μsec wide in time which equates to 40 μm in distance at a flow speed of 1.5 m sec−1. The highest switching efficiency of 97% occurs at a laser delay time of 18 μsec and decreases to 1% at 5 μsec and 30 μsec delays.
With a 100 μJ laser pulse energy, peak switching efficiency reaches 100% but the switching window is wide, which is not ideal for high purity sorting when the cell separation distance is small. As the laser pulse energy decreases, the switching window narrows but the peak switching efficiency also decreases. An ideal shape of a switching window profile should be a sharp peak to ensure high efficiency switching of target particles that excludes all non-target neighbouring particles. To generate a sharp peak switching profile, several nozzle designs with different lengths and widths have been tested (Fig. 6b). The goal was to identify optimal nozzle dimensions that allow effective particle switching with minimum volume of liquid injected into the sample channel, a parameter affecting the width of switching window. Using a 20 μm wide and 50 μm long nozzle, and an excitation bubble of 160 μm in diameter, an optimal switching profile is obtained with a peak switching efficiency at 97% and a switching window of 25 μsec, corresponding to a 40 μm switching range in the sample channel (Fig. 6c) when the flow speed in the sample channel is 1.5 m sec−1. The cut-off switching efficiency in defining our switching window is 1%, which means particles outside this switching window are almost impossible to get switched into the collection channel. The switching profile shown in Fig. 6c is symmetric. This means non-target particles outside the ±20 μm range of the target particle will not be switched. However, if the non-target particle is located within 20 μm away from the target particle, the probability that it will be switched into the collection channel varies with its distance from the target particle.
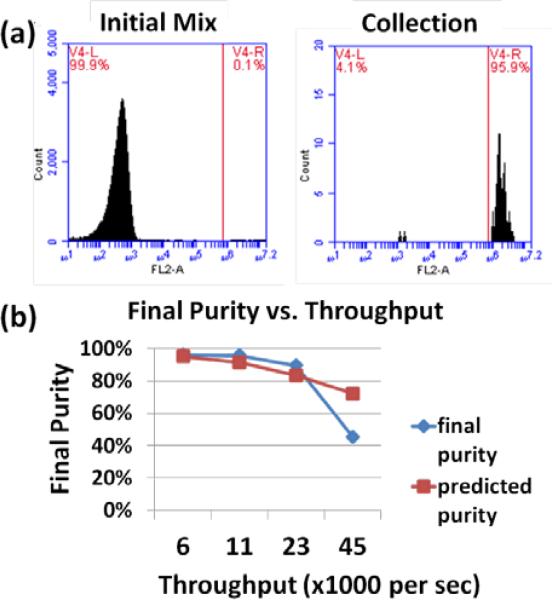
In practical sorting experiments, cells come into the detection and switch zone randomly. The separation distance between cells follows the Poisson distribution. For example, at a sorting throughput of 10,000 cells sec−1, the average cell separation distance is 160 μm when cells flow at a speed of 1.5 m sec−1 in the sample channel. According to the Poisson distribution, only 25% of cells will be within the ±20 μm range. For cells within this range, the probability for each cell to be switched is determined by the experimentally obtained switching profile. In theory, a sorting purity above 90% can be achieved at a throughput up to 11,000 cells cec−1 when the flow speed in the sample stream is 1.5 m sec−1 as shown in Fig. 7b.
Fig. 7.
3D PLACS sorting results. (a) Initial cell sample was a 0.1% mixture of Vybrant® CFDA SE Cell Tracer stained to unstained Ramos human Burkitt lymphoma cells at 2×10⁷ cells ml−1. After sorting at a throughput of 11,000 cells sec−1, the final purity is 95.9%. (b) Final sorting purity as a function of throughput varying from 6,000 cells sec−1 to 45,000 cells sec−1. At low throughputs, >95% final purity was achieved. The final purity at the highest throughput tested is 45.4% at 45,000 cells sec−1. Because the separation between cells decreases as the throughput increases, the final purity decreases with higher throughput, as predicted. At 45,000 cells sec−1, the cells clog at the switching junction shifting the optimal switching location, which causes the final purity to drop dramatically from the prediction.
Mammalian cell sample preparation
To validate the sorting capability for biological samples, Ramos human Burkitt lymphoma cells are stained with Vybrant® CFDA SE Cell Tracer (Invitrogen) and mixed with unstained cells at desired ratios. Cells cultured in RPMI 1640 with standard supplements were washed and re-suspended in phosphate buffered saline (1× PBS, pH 7.4). Staining was performed by incubating cells in PBS containing 1 μM carboxyfluorescein diacetate, succinimidyl ester (CFDA SE) at 37°C for 15 min, followed by centrifugation and 3 washes with PBS. Following the third wash, cells were placed in 1 x PBS with 10% fetal bovine serum (FBS) and 1 mM ethylenediaminetetraacetic acid (EDTA) to prevent aggregation. The unstained cells were also transferred into the PBS/FBS/EDTA solution at the desired concentration, ranging from 107 to 108 cell ml−1, which would correspond to different throughputs in the PLACS device. The stained cells were mixed with the unstained cells at a ratio of 0.001 (confirmed by conventional flow cytometry) after filtering out large cell clumps using a 40 μm pore-size cell strainer. Once the cell sample was prepared, it was transferred into a 3 ml syringe with two magnetic bars inside which agitate the sample solution to prevent sedimentation and aggregation during an experiment. The sheath fluid was PBS/FBS/EDTA and was filtered before pumping into the microchannels. The dye solution was prepared by mixing Allura Red dye (67 mg ml−1, Sigma-Aldrich) into PBS and filtered. All the solutions were driven into the PLACS device by syringe pump (Harvard Apparatus, PHD2000). The flow rates were fixed at 2 ml h−1 for the sample channel, 4 ml h−1 for the vertical sheaths, 20 ml h−1 for the lateral sheaths, and 20 ml h−1 for the dye channel. Under this flow rate setting, the cells were travelling at a speed of 1.5 m sec−1. After sorting, propidium iodide (Invitrogen) was added to the collected samples for viability testing.
Sort purity analysis by conventional flow cytometer
After sorting, the collected samples were immediately analyzed by a conventional flow cytometer (BD, FACSCanto II). To obtain the proper fluorescent gating parameters, negative controls (unstained cells) and positive controls (green fluorescence stained cells and fixed dead cells with PI dye) were also analyzed. Moreover, forward and side scatter signals were also used to gate the proper cell population. From these analyses, purity and viability data were obtained for pre-sorted samples, collection channel samples, and waste channel samples. For each measurement, >1,500 cells were analyzed from collection channel samples and >10,000 cells for all other samples.
Mammalian cell sorting
The bubble excitation location, bubble size (160 μm in diameter), and time delay between detection and laser excitation (18 μsec) are all fixed to ensure optimal switching performance. Since the fluid flow rates are fixed, experiments at different throughput are achieved by varying the initial cell concentration. At low throughput, the average cell-cell separation distance is large and high purity (>95%) sorting can be achieved easily (Fig. 7). For example, as shown in Table 1, a sorting purity of 96.2% is accomplished at a throughput of 6,000 cells sec−1 and a purity of 95.9% is also achieved at 11,000 cells sec−1. The average cell-cell separation distances at these two cell concentrations are 252 μm and 135 μm, respectively. When the throughput increased to 23,000 cells sec−1, the average distance between cells decreases to 64 μm, which is still larger than the switching window, but the sorting purity decreases to 89.6%. This means that the proportion of cells with separation distances smaller than 20 μm starts to become significant. The sorting purity, up to 23,000 cells sec−1, matches well with our prediction based upon a Poisson distribution. In fact, the experimentally obtained sorting purity is slightly higher than what we predicted since the Poisson distribution neglects the cell size effect, meaning, in real experiments, not that many cells will get into the effective switching zone as the theory predicts. At a throughput of 23,000 cells sec−1, the initial cell concentration was 4.2×10⁷ cells ml−1. By further increasing the cell concentration for higher throughput, the frequency of cell clogging at the switching zone increases substantially. This caused problems since aggregated cells could be lysed and stacked at the switching junction, blocking the channel and severely affecting the switching function. As a result, the collection purity dropped to 45.4%, much lower than what the theory predicted, at a throughput of 45,000 cells sec−1. During an sorting experiments, three methods were employed to avoid cell clogging: (1) adding 10% FBS (fetal bovine serum) and 1 mM EDTA (ethylenediaminetetraacetic acid) to the buffer medium; (2) pipetting the cell suspension and filtering it with 40 μm pore size cell strainers to remove large clumps before introduction into microchannels and (3) stirring the cell suspension in a delivery syringe with magnetic stirring bars during sorting. From our experimental results, these methods effectively help prevent cell clogging for concentrations below 4.2×10⁷ cells ml−1. There are additional methods that can be considered as well, such as Teflon coating the microchannel [17] or designing a wider channel [34].
Table 1.
Results of sorting B lymphoma Ramos cells at different sorting throughputs (Col: Collection sample; W: Waste sample)
| Before sort | After sort | ||||||
|---|---|---|---|---|---|---|---|
| Throughput (cells cec−1) | Initial green cell percentage (%) | Cell density (×107 cells ml−1) | Viability (%) | Col. purity (%) | W. purity (%) | Col. viability (%) | W. viability (%) |
| 6,000 | 0.1 | 1 | 87.6 | 96.2 | 0.0 | 98.0 | 74.6 |
| 11,000 | 0.1 | 2 | 76.9 | 95.9 | 0.0 | 96.7 | 79.2 |
| 23,000 | 0.2 | 4.2 | 86.8 | 89.6 | 0.1 | 95.0 | 92.4 |
| 45,000 | 0.1 | 8.1 | 82.2 | 45.4 | 0.0 | 82.8 | 71.5 |
In our current 3D PLACS system, increasing the percentage of labeled cells at high-throughput will not affect the sorting purity but the yield will drop with the increasing percentage of labeled cells. This means more labeled cells will not be captured by sorting. This limitation is due to laser energy instability at high pulse triggering rates. The nanosecond laser used in the current system requires a minimum delay of 200 μsec between two consecutive laser pulses when operating in the pulse-on-demand mode. If the second pulse is triggered within 200 μsec from the first laser pulse, the energy of the second pulse does not reach its maximum, which in turn affects the switching and leads to lower yields. Using a laser with a shorter pulse-on-demand time could solve this problem.
Cell viability testing is achieved by PI staining of sorted cells. No significant loss of viability is observed in the sorted sample, compared to unsorted cells.
Conclusions
3D PLACS overcomes the synchronization problem between cell detection and sorting, thus outperforming other microfluidic based cell sorters and achieving performance at a level comparable with conventional aerosol-based FACS. From the study of laser energy, nozzle shape, and bubble size, the switching window is optimized at 25 μsec, which equates to a 40 μm window at 1.5 m sec−1. Using this sharp window, the sort purity achieved 90% at 23,000 cells sec−1. Sort purity dropped to 45.4% at 45,000 cells sec−1 due to a cell clogging issue at the switch junction. 3D PLACS has the potential to substitute for conventional electrostatic-droplet-based cell sorters. By integrating with downstream microfluidic cell analysis functions, 3D PLACS will greatly facilitate biomedical research and clinical diagnostics.
Acknowledgement
The authors thank Dr Kayvan Niazi and Dr Shahrooz Rabizadeh (California NanoSystems Institute) for helpful discussions and support. This work was supported in part by NSF ECCS-0901154, NSF DBI-0852701, NIH R21EB014456, NIH R01CA156674, NIH R01CA90571, NIH P01GM081621, a UC Discovery/Abraxis BioScience Biotechnology Award (#178517), and by the Broad Center of Regenerative Medicine and Stem Cell Research at UCLA. We thank the UCLA Nanoelectronics Research Facility and the Center for Cell Control for providing instrumentation for device fabrication and characterization.
Notes and references
- 1.Hulett HR, Bonner WA, Barrett J, Herzenberg LA. Science. 1969;166:747. [PubMed] [Google Scholar]
- 2.Eisenstein M. Nature. 2006;441:1179. doi: 10.1038/4411179a. [DOI] [PubMed] [Google Scholar]
- 3.Shapiro HM. Practical flow cytometry. Wiley-Liss; New York: 2003. [Google Scholar]
- 4.Schmid I, Lambert C, Ambrozak D, Marti G, Moss D, Perfetto S. Cytometry A. 2007;7:414. doi: 10.1002/cyto.a.20390. [DOI] [PubMed] [Google Scholar]
- 5.Godin J, Chen C, Cho S, Qiao W, Tsai F, Lo Y. J. Biophotonics. 2008;1:355. doi: 10.1002/jbio.200810018. [DOI] [PMC free article] [PubMed] [Google Scholar]
- 6.El-Ali J, Sorger P, Jensen KF. Nature. 2006;442:403. doi: 10.1038/nature05063. [DOI] [PubMed] [Google Scholar]
- 7.Ateya DA, Erickson JS, Howell PB, Jr., Hilliard LR, Golden JP, Ligler FS. Anal. Bioanal. Chem. 2008;391:1485. doi: 10.1007/s00216-007-1827-5. [DOI] [PMC free article] [PubMed] [Google Scholar]
- 8.Bhagat AAS, Bow H, Hou HW, Tan SJ, Han J, Lim CT. Med. Bio. Eng. Comput. 2010;48:999. doi: 10.1007/s11517-010-0611-4. [DOI] [PubMed] [Google Scholar]
- 9.Kovarik ML, Gach PC, Ornoff DM, Wang Y, Balowski J, Farrag L, Allbritton NL. Anal. Chem. 2011;84:516. doi: 10.1021/ac202611x. [DOI] [PMC free article] [PubMed] [Google Scholar]
- 10.Autebert J, Coudert B, Bidard F-C, Pierga J-Y, Descroix S, Malaquin L, Viovy J-L. Methods. 2012;57:297. doi: 10.1016/j.ymeth.2012.07.002. [DOI] [PubMed] [Google Scholar]
- 11.Gao Y, Li W, Pappas D. Analyst, Advance Article. 2013 doi: 10.1039/c3an00315a. [DOI] [PMC free article] [PubMed] [Google Scholar]
- 12.Fu AY, Spence C, Scherer A, Arnold FH, Quake SR. Nat. Biotechnol. 1999;17:1109. doi: 10.1038/15095. [DOI] [PubMed] [Google Scholar]
- 13.Fu AY, Chou H-P, Spence C, Arnold FH, Quake SR. Anal. Chem. 2002;74:2451. doi: 10.1021/ac0255330. [DOI] [PubMed] [Google Scholar]
- 14.Cao Z, Chen F, Bao N, He H, Xu P, Jana S, Jung S, Lian H, Lu C. Lab Chip. 2013;13:171. doi: 10.1039/c2lc40950j. [DOI] [PubMed] [Google Scholar]
- 15.Wang MM, Tu E, Raymond DE, Yang JM, Zhang H, Hagen N, Dees B, Mercer EM, Forster AH, Kariv I, Marchand PJ, Butler WF. Nat. Biotechnol. 2005;23:83. doi: 10.1038/nbt1050. [DOI] [PubMed] [Google Scholar]
- 16.König K, Liang H, Berns MW, Tromberg BJ. Opt. Lett. 1996;21(14):1090. doi: 10.1364/ol.21.001090. [DOI] [PubMed] [Google Scholar]
- 17.Cho SH, Chen CH, Tsai FS, Godin JM, Lo Y-H. Lab Chip. 2010;10:1567. doi: 10.1039/c000136h. [DOI] [PMC free article] [PubMed] [Google Scholar]
- 18.Ibrahim SF, van den Engh G. Current Opinion in Biotechnology. 2003;14(1):5–12. doi: 10.1016/s0958-1669(02)00009-5. [DOI] [PubMed] [Google Scholar]
- 19.Leary JF. Cytometry Part A. 2005;67A(2):76. doi: 10.1002/cyto.a.20160. [DOI] [PubMed] [Google Scholar]
- 20.Ibrahim SF, van den Engh G. Cell Separation, Springer Berlin Heidelberg. 2007;106:19. [Google Scholar]
- 21.Wachtel SS, Shulman LP, Sammons D. Clin. Genet. 2001;59:74. doi: 10.1034/j.1399-0004.2001.590202.x. [DOI] [PubMed] [Google Scholar]
- 22.Wu T-H, Chen Y, Park S-Y, Hong J, Teslaa T, Zhong JF, Di Carlo D, Teitell MA, Chiou P-Y. Lab on a Chip. 2012;12:1378. doi: 10.1039/c2lc21084c. [DOI] [PMC free article] [PubMed] [Google Scholar]
- 23.Wu T-H, Gao L, Chen Y, Wei K, Chiou P-Y. Appl. Phys. Lett. 2008;93:144102. [Google Scholar]
- 24.Dijkink R, Ohl C-D. Lab Chip. 2008;8:1676. doi: 10.1039/b806912c. [DOI] [PubMed] [Google Scholar]
- 25.Chen S-Y, Wu T-H, Chiou P-Y. Lab Chip. 2012;12:1771. doi: 10.1039/c2lc40079k. [DOI] [PubMed] [Google Scholar]
- 26.Park S-Y, Wu T-H, Chen Y, Teitell MA, Chiou P-Y. Lab Chip. 2011;11:1010. doi: 10.1039/c0lc00555j. [DOI] [PMC free article] [PubMed] [Google Scholar]
- 27.Rau KR, Quinto-Su PA, Hellman AN, Venugopalan V. Biophys. J. 2006;91:317. doi: 10.1529/biophysj.105.079921. [DOI] [PMC free article] [PubMed] [Google Scholar]
- 28.French CT, Toesca IJ, Wu T-H, Teslaa T, Wong W, Liu M, Chiou P-Y, Teitell MA, Miller JF. PNAS. 2011;108:12095. doi: 10.1073/pnas.1107183108. [DOI] [PMC free article] [PubMed] [Google Scholar]
- 29.Wu T-H, Teslaa T, Kalim S, French CT, Moghadam S, Wall R, Miller JF, Witte ON, Teitell MA, Chiou P-Y. Anal. Chem. 2011;83:1321. doi: 10.1021/ac102532w. [DOI] [PMC free article] [PubMed] [Google Scholar]
- 30.Wu T-H, Teslaa T, Teitell MA, Chiou P-Y. Opt. Express. 2010;18:23153. doi: 10.1364/OE.18.023153. [DOI] [PMC free article] [PubMed] [Google Scholar]
- 31.Quinto-Su PA, Huang XH, Gonzalez-Avila SR, Wu T, Ohl CD. Phys. Rev. Lett. 2010;104:014501. doi: 10.1103/PhysRevLett.104.014501. [DOI] [PubMed] [Google Scholar]
- 32.Zhang M, Wu J, Wang L, Xiao K, Wen W. Lab Chip. 2010;10:1199, 100. doi: 10.1039/b923101c. [DOI] [PubMed] [Google Scholar]
- 33.Kung Y-C, Huang K-W, Yang Y, Fan Y-J, Chiou P-Y. Proceeding of 25th Annual International Conference on Micro Electro Mechanical Systems (MEMS `13) 2013;915 [Google Scholar]
- 34.Chung AJ, Pulido D, Oka JC, Amini H, Masaeli M, Di Carlo D. Lab Chip, Advance Article. 2013 doi: 10.1039/c3lc41227j. [DOI] [PubMed] [Google Scholar]


