

Abstract
Background
MCL (mantle cell lymphoma) is a rare subtype of NHL (non-Hodgkin lymphoma) with mostly poor prognosis. Different races have different etiology, presentation, and progression patterns.
Methods
Data were analyzed on MCL patients in the United States reported to the SEER (Surveillance, Epidemiology, and End Results) database between 1992 and 2009. SEER contains the most comprehensive population-based cancer information in the U.S., covering approximately 28% of the population. Racial groups analyzed included non-Hispanic whites, Hispanic whites, blacks, and Asians/PIs (Pacific Islanders). Patient characteristics, age-adjusted incidence rate, and survival rate were compared across races. Stratification by age, gender, and stage at diagnosis was considered. Multivariate analysis was conducted on survival.
Results
In the analysis of patients’ characteristics, distributions of gender, marital status, age at diagnosis, stage, and extranodal involvement were significantly different across races. For all three age groups and both male and female, non-Hispanic whites have the highest incidence rates. In the analysis of survival, for cancers diagnosed in the period of 1992–2004, no significant racial difference is observed. For cancers diagnosed in the period of 1999–2004, significant racial differences exist for the 40–64 age group and stage III and IV cancers.
Conclusions
Racial differences exist among MCL patients in the U.S. in terms of patients’ characteristics, incidence, and survival. More extended data collection and analysis are needed to more comprehensively describe and understand the racial differences.
Electronic supplementary material
The online version of this article (doi:10.1186/1471-2407-14-764) contains supplementary material, which is available to authorized users.
Keywords: Mantle cell lymphoma, Racial differences, SEER, Non-hodgkin lymphoma
Background
NHL (non-Hodgkin lymphoma) has over 30 subtypes, with different subtypes having different clinical and molecular features [1]. MCL (mantle cell lymphoma) is a rare subtype of NHL. It was proposed as a distinct entity in 1992 [2] and accepted by the Revised European American Classification for Lymphoma (REAL) in 1994. The symptoms of MCL include swelling, loss of appetite and fatigue, night sweats, fevers, and weight loss. Diagnosis of MCL usually requires removing an enlarged lymph node and examining the cells under a microscope. MCL comprises about 6% of all NHL cases [3]. Its age-adjusted incidence rate is about 0.51 to 0.55 per 100,000 person-years. In the U.S., the incidence of MCL had been increasing between 1992 and 2007 [4, 5], and there are currently about 15,000 MCL patients in total. These patients are typically Caucasian, male, and elderly. Multiple risk factors have been suggested as associated with the risk of developing MCL, including lifestyle and occupational risk factors, viruses, family history, and molecular risk factors [6]. For MCL patients, the standard first-line treatment consists of rituximab (a chimeric monoclonal anti-CD20 antibody, approved by U.S. FDA in 1997) in combination with chemotherapy [7]. Other treatment options include other monoclonal antibody therapy, stem cell transplants, radiotherapy, steroid therapy, and relatively newer drugs such as Temsirolimus, Lenalidomide, and Bortezomib. Most MCLs have an aggressive clinical course with a median survival of 3–7 years [8]. Multiple factors influence MCL prognosis. Shorter overall survival has been associated with older age, worse ECOG (Eastern Cooperative Oncology Group) performance status, higher LDH (Lactate dehydrogenase), higher white blood cell count [9], and advanced diseases [10]. Multiple genetic factors have also been implicated in MCL prognosis.
The goal of this study, different from that of many published ones, is to comprehensively investigate the racial differences among MCL patients in the U.S., in terms of patients’ characteristics, clinical-pathologic features, incidence, and survival rates. Racial differences in multiple clinical and epidemiologic aspects for some other cancer types and other NHL subtypes, such as DLBCL (diffuse large B-cell lymphoma) and follicular lymphoma, have been studied [11–18]. However, research on MCL remains scarce. The existing MCL studies have limitations by focusing on specific racial groups or specific outcomes. For example, Chim and others [19] compared only Chinese and Caucasians; and Zhou and others [4] focused on incidence rates. This article targets filling the knowledge gap by comprehensively comparing non-Hispanic whites, Hispanic whites, blacks, and Asians/PIs (Pacific Islanders) in multiple aspects of MCL.
Methods
Source population
The population-based sample was obtained from the SEER (Surveillance, Epidemiology, and End Results, http://seer.cancer.gov/) database. All data analyzed in this study are publicly available. SEER is the most comprehensive population-based cancer database in the U.S., containing data from 18 regional and state registries. It has multiple registry groupings for analyses. Different registry groupings cover different numbers of regions and time periods. More details are available at http://seer.cancer.gov/registries/terms.html. SEER 9, 13, and 18 registries, which are analyzed in this article, cover approximately 9.5%, 14%, and 28.0% of the U.S. population, respectively. For each MCL case, the first matching record was selected for analysis. The International Classification of Diseases for Oncology (ICD-O)-3 code used for MCL was 9673. In data examination, we found 16 patients with T-cell MCL and 5 patients with null-cell MCL. Such samples were removed from analysis. All SEER registries were included in the analysis.
Different SEER registry groupings were used to maximize sample size. Specifically, for the analysis of patients’ characteristics and clinical-pathologic features, SEER 9 contains data on cancers diagnosed between 1973 and 2009. For incidence, SEER 13 data, which include detailed race and incidence information for cancers diagnosed between 1992 and 2009, are analyzed. And for survival, SEER 18 has data for cancers diagnosed between 1973 and 2004 and followed up to 12/31/2009. As the current definition of MCL was not established until 1992, we limited our analysis to all cancers diagnosed after 1992. Rituximab was introduced in 1997, is now the standard first-line treatment, and has a significant effect on survival. Thus, we also conducted survival analysis on cancers diagnosed after 1999 [20]. Clinical-pathologic features analyzed include gender, marital status (single, married, and separated/divorced/widowed), age at diagnosis, stage (I, II, III, and IV, according to the Ann Arbor staging system), B symptoms (no, yes, and unknown), extranodal involvement (no and yes), and survival time. The main outcomes of interest are incidence rate and survival rate.
Statistical analysis
In the comparison of patient characteristics and clinical-pathologic features across racial groups, Chi-squared tests and ANOVA were used, and p-values were computed. The analysis was conducted using SAS version 9.2. Age-adjusted incidence rates were calculated with SEER*Stat using U.S. 2000 Census data for age-standardization. Five-year relative survival rates were calculated with SEER*Stat using an actuarial method, which accommodates the right-censored nature of survival data [21]. Multivariate Cox regressions were then conducted, adjusting for age at diagnosis, gender, marital status, B symptoms, and extranodal involvement, and stratified by stage at diagnosis.
Results
Patients’ characteristics and clinical-pathologic features
A total of 2,958 MCL patients were identified in SEER between 1992 and 2009 (Table 1). There are overall more male patients (67.2%). The gender distributions are different across races (p-value = 0.043), with Hispanic whites having the most male patients (70.6%) and blacks having the least (56.2%). Most MCL patients are married (68.4%). Different racial groups have significantly different marital status (p-value < 0.001). Among Asian/PI patients, 74.8% are married. In contrast, only 42.9% of black patients are married. The age at diagnosis is also significantly different across races (p-value < 0.001). For non-Hispanic whites, the mean age at diagnosis is 68.2, compared to 62.8 for blacks. Most MCLs are diagnosed at late stages. In our analysis, 62.3% are stage IV, and 14.7% are stage III. The racial difference is significant (p-value-0.029), with for example 63.2% of non-Hispanic whites and 53.5% blacks having stage IV. The distribution of B symptoms shows no racial difference. Overall, 16.2% have extranodal involvement, and the racial difference is significant (p-value < 0.001). Asians/PIs have the highest percentage of extranodal involvement. Most patients did not receive surgery or radiation (59.8%). There is no significant racial difference. The median survival time is 46.0 months. Hispanic whites have the longest median survival (57.0 months), while blacks having the shortest (39.0 months). However, the racial difference is not significant.
Table 1.
MCL patients’ characteristics and clinical-pathologic features for the whole cohort and different racial groups
| Total (n = 2958) | Non-Hispanic white (n = 2620) | Hispanic white (n = 109) | Black (n = 121) | Asian/PI (n = 108) | P | |
|---|---|---|---|---|---|---|
| Gender | 0.043 | |||||
| Male | 1989 (67.2) | 1775 (67.7) | 77 (70.6) | 68 (56.2) | 69 (63.9) | |
| Female | 969 (32.8) | 845 (32.3) | 32 (29.4) | 53 (43.8) | 39 (36.1) | |
| Marital Status | <0.001 | |||||
| Single | 243 (8.7) | 195 (7.9) | 20 (20.8) | 21 (18.8) | 7 (6.8) | |
| Married | 1905 (68.4) | 1721 (69.6) | 59 (61.5) | 48 (42.9) | 77 (74.8) | |
| Separated/divorced/widowed | 636 (22.8) | 557 (22.5) | 17 (17.7) | 43 (38.4) | 19 (18.4) | |
| Age at diagnosis | 67.8 ± 12.3 | 68.2 ± 12.1 | 64.3 ± 12.7 | 62.8 ± 13.7 | 67.0 ± 12.1 | <0.001 |
| Stage | 0.029 | |||||
| Stage I | 396 (14.1) | 338 (13.6) | 20 (20.2) | 18 (15.8) | 20 (18.7) | |
| Stage II | 251 (8.9) | 219 (8.8) | 8 (8.1) | 9 (7.9) | 15 (14.0) | |
| Stage III | 411 (14.7) | 357 (14.4) | 17 (17.2) | 26 (22.8) | 11 (10.3) | |
| Stage IV | 1747 (62.3) | 1571 (63.2) | 54 (54.5) | 61 (53.5) | 61 (57.0) | |
| B symptoms | 0.108 | |||||
| No | 1070 (36.2) | 949 (36.2) | 47 (43.1) | 36 (29.8) | 38 (35.2) | |
| Yes | 596 (20.1) | 513 (19.6) | 23 (21.1) | 35 (28.9) | 25 (23.1) | |
| Unknown | 1292 (43.7) | 1158 (44.2) | 39 (35.8) | 50 (41.3) | 45 (41.7) | |
| Extranodal involvement | <0.001 | |||||
| No | 2478 (83.8) | 2206 (84.2) | 93 (85.3) | 106 (87.6) | 73 (67.6) | |
| Yes | 480 (16.2) | 414 (15.8) | 16 (14.7) | 15 (12.4) | 35 (32.4) | |
| Survival time (month) (Median ± SD) | 46.0 ± 1.8 | 46.0 ± 1.9 | 57.0 ± 13.5 | 39.0 ± 7.9 | 46.0 ± 6.8 | 0.735 |
Cancers diagnosed between 1992 and 2009 in the SEER 9 database. For a continuous variable, mean ± standard deviation, and for a categorical variable, count (percentage).
Incidence
The overall age-adjusted incidence rate is 0.64 per 100,000 person-years (Table 2). Incidence increases with age. The three age groups have incidence rates 0.01, 0.73, and 3.22, respectively. Overall, non-Hispanic whites have the highest incidence rate (0.73, 95% CI 0.71-0.76), significantly higher than those of the other races. For the <40 age group, the incidence rates are low for all races. For the 40–64 and 65+ age groups, non-Hispanic whites have the highest incidence rates, followed by Hispanic whites. Asians/PIs have the lowest rates. Overall, males have a higher incidence rate (0.98, 95% CI 0.94-1.02) than females (0.37, 95% 0.35-0.39). For both male and female, non-Hispanic whites have the highest incidence rates, followed by Hispanic whites and then blacks.
Table 2.
Age-adjusted MCL incidence rates per 100,000 person-years for the whole cohort and different racial groups, stratified by age and gender
| Incidence | Non-Hispanic white | Hispanic white | Black | Asian/ PI | Total | |||||
|---|---|---|---|---|---|---|---|---|---|---|
| n | IR (95% CI) | n | IR (95% CI) | n | IR (95% CI) | n | IR (95% CI) | n | IR (95% CI) | |
| All ages | 3320 | 0.73 (0.71-0.76) | 328 | 0.53 (0.48-0.60) | 180 | 0.32 (0.28-0.38) | 198 | 0.29 (0.26-0.34) | 4073 | 0.64 (0.62-0.66) |
| <40 years | 35 | 0.02 (0.01-0.02) | 11 | 0.01 (0.01-0.02) | 5 | 0.01 (0.00-0.02) | 1 | 0.00 (0.00-0.01) | 53 | 0.01 (0.01-0.02) |
| 40-64 years | 1195 | 0.87 (0.82-0.92) | 138 | 0.57 (0.47-0.67) | 87 | 0.43 (0.34-0.53) | 78 | 0.34 (0.27-0.42) | 1517 | 0.73 (0.69-0.77) |
| 65+ years | 2090 | 3.66 (3.50-3.82) | 179 | 2.80 (2.40-3.24) | 88 | 1.49 (1.19-1.83) | 119 | 1.51 (1.25-1.80) | 2503 | 3.22 (3.09-3.35) |
| Male | 2243 | 1.13 (1.08-1.17) | 234 | 0.85 (0.74-0.98) | 108 | 0.45 (0.37-0.55) | 131 | 0.44 (0.37-0.52) | 2745 | 0.98 (0.94-1.02) |
| Female | 1077 | 0.43 (0.40-0.45) | 94 | 0.29 (0.23-0.35) | 72 | 0.23 (0.18-0.29) | 67 | 0.18 (0.14-0.23) | 1328 | 0.37 (0.35-0.39) |
Diagnoses in the period of 1992–2009 in the SEER 13 database. In each cell, estimate (95% CI). Rates were age-adjusted using the U.S. 2000 Census population.
Survival
For cancers diagnosed in the period of 1992–2004, the five-year relative survival rates are shown in Table 3. When stratified by age, for the <40 years group, Asians/PIs have the best five-year survival rate (100%), whereas blacks having the worst (45.5%). For the 40–64 years group, non-Hispanic whites have the best survival rate (63.1%), while Hispanic whites have the worst (51.4%). For the 65+ years group, non-Hispanic whites have the best survival rate (44.4%), while blacks have the worst (34.9%). The racial differences are not significant in the multivariate analysis (detailed results are shown in Additional file 1: Table S4). When stratified by gender, for male, non-Hispanic whites have the best survival rate, and Hispanic whites have the worst. For female, Asians/PIs have the best survival rate, and Hispanic whites still have the worst. The racial differences are not significant in multivariate analysis. When stratified by stage at diagnosis, for stage I-III, Asians/PIs have the best survival, followed by non-Hispanic whites. Hispanic whites have the worst survival. The racial differences are not significant. Again these results should be taken cautiously because of the small sample sizes. For stage IV, the racial difference is borderline significant in multivariate analysis (p-value = 0.063). In particular, non-Hispanic whites have the best survival rate (49.0%), followed by blacks (45.4%). Figure 1 shows the unadjusted survival rate for five years. In the first year, the differences across races are ignorable. Between year one and year three, there is no dominating racial group. The survival curves are more separated between year four and year five, with Hispanic whites having the worst and non-Hispanic whites having the best survival.
Table 3.
Five-year relative survival rates for different racial groups, stratified by age, gender, and stage at diagnosis
| Total (n = 5438) | Non-Hispanic white (n = 4458) | Hispanic white (n = 446) | Black (n = 241) | Asian/PI (n = 219) | P-value | ||||||
|---|---|---|---|---|---|---|---|---|---|---|---|
| n | Rate (95% CI) | n | Rate (95% CI) | n | Rate (95% CI) | n | Rate (95% CI) | n | Rate (95% CI) | ||
| Age group | |||||||||||
| <40 years | 75 | 78.0 (64.8-86.7) | 48 | 84.7 (69.6-92.7) | 12 | 66.8 (26.5-88.5) | 11 | 45.5 (7.8-78.4) | 3 | 100.0 | 0.7 |
| 40-64 years | 2257 | 61.9 (59.4-64.3) | 1802 | 63.1 (60.3-65.8) | 202 | 51.4 (42.3-59.7) | 126 | 58.0 (46.8-67.6) | 97 | 61.2 (48.8-71.4) | 0.523 |
| 65+ years | 3106 | 43.2 (40.7-45.7) | 2608 | 44.4 (41.7-47.1) | 232 | 35.5 (26.5-44.6) | 104 | 34.9 (22.5-47.5) | 119 | 41.2 (29.7-52.3) | 0.762 |
| Gender | |||||||||||
| Male | 3740 | 51.2 (49.0-53.3) | 3062 | 52.2 (49.8-54.5) | 330 | 43.6 (36.0-50.9) | 152 | 49.5 (39.0-59.2) | 148 | 46.6 (36.4-56.2) | 0.487 |
| Female | 1698 | 53.1 (49.9-56.1) | 1396 | 54.9 (51.9-57.9) | 116 | 44.4 (32.6-55.5) | 89 | 45.4 (31.9-58.0) | 71 | 59.5 (44.2-71.9) | 0.259 |
| Stage at diagnosis | |||||||||||
| Stage I | 633 | 72.6 (67.2-77.2) | 518 | 72.9 (66.9-78.0) | 46 | 64.2 (40.6-80.3) | 27 | 72.1 (41.6-88.5) | 33 | 73.7 (51.2-87.0) | 0.604 |
| Stage II | 447 | 59.0 (52.7-64.8) | 365 | 59.7 (52.6-66.0) | 36 | 42.1 (18.7-64.0) | 17 | 46.0 (14.4-73.2) | 24 | 72.2 (45.3-87.5) | 0.983 |
| Stage III | 780 | 45.6 (40.7-50.2) | 625 | 46.0 (40.6-51.2) | 70 | 39.1 (24.6-53.3) | 50 | 40.4 (23.2-57.0) | 28 | 62.0 (37.1-79.4) | 0.143 |
| Stage IV | 3243 | 47.9 (45.6-50.1) | 2690 | 49.0 (46.5-51.5) | 263 | 39.8 (31.8-47.7) | 131 | 45.4 (34.2-55.9) | 125 | 37.6 (26.6-48.5) | 0.063 |
Cancers diagnosed in the period of 1992–2004 and followed up to 12/31/2009 in the SEER 18 database. In each cell, estimated rate (95% CI). P-values were generated from multivariate Cox models. Details are provided in Additional file 1.
Figure 1.
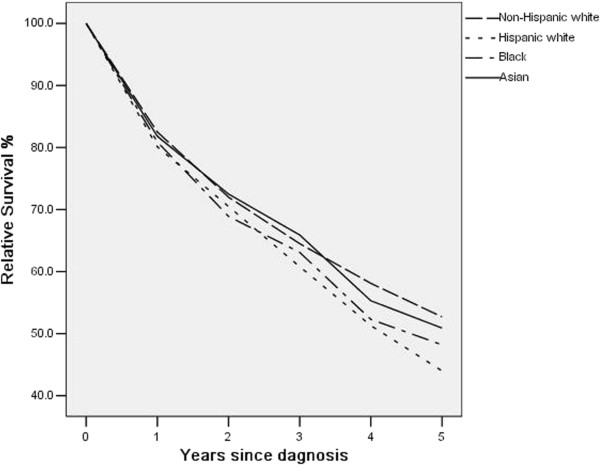
Relative survival up to five years for different racial groups. Cancers diagnosed in the period of 1992–2004 and followed up to 12/31/2009.
For cancers diagnosed in the period of 1999–2004, the survival analysis results are presented in Additional file 1: Tables S5 and Table S6. When stratified by age, the racial difference is significant for the 40–64 years group (p-value = 0.025). Specifically, non-Hispanic whites have the best survival (64.4%), while Hispanic whites have the worst (50.7%). When stratified by gender, the racial difference is borderline significant for female (p-value = 0.093), with non-Hispanic whites having the best survival (54.0%) and Hispanic whites having the worst (42.2%). When stratified by stage at diagnosis, the racial differences are significant for stage III and IV. In particular, for stage III, Asians/PIs have the best survival, while Hispanic whites have the worst. For stage IV, non-Hispanic whites have the best survival (50.5%), followed by blacks (44.7%). Asians/PIs have the worst survival (38.7%).
Discussion
Main findings and possible interpretations
As a mostly aggressive variant of NHL, MCL has been studied in multiple publications. However, most of the existing studies have been focused on pathogenesis, incidence trends, and survival patterns. In some studies, race has been included as a confounding variable. A small number of studies are concerned with racial differences, but in a much less systematic manner. In this study, we have analyzed SEER data, comprehensively compared non-Hispanic whites, Hispanic whites, blacks, and Asians/PIs, and found that for MCL patients in the U.S., racial differences exist in terms of patients’ characteristics, clinical-pathologic features, incidence, and survival. As mentioned in Introduction, racial differences have been examined for other cancer types and other subtypes of NHL. It has been suggested in the literature [22] that MCL differs from other NHL subtypes in many aspects. Thus in this study, we have focused on MCL without attempting to compare with findings on other NHL subtypes.
The observed gender and age distributions are similar to those in the literature. Our analysis suggests that the distributions of gender, marital status, age at diagnosis, stage, and extranodal involvement are different across racial groups. The development of MCL is an extremely complex process. The observed racial differences reflect the complex interactions of genetic makeup, occupational exposures, infectious conditions, development of autoimmune diseases, family history, and socioeconomic status [23, 24]. It is unclear if there is a direct link between marital status and MCL. In the general population, different racial groups have significantly different marital status [25]. Specifically, according to the National Healthy Marriage Resource Center, the percentages of ever married are 72.6% (white men), 56.7% (black men), 66.6 (Asian men), 60.0% (Hispanic men), 79.3% (white women), 58.1% (black women), 74.7% (Asian women), and 70.3% (Hispanic women). Thus the observed significant marital status difference may or may not be relevant to MCL.
In the incidence analysis, the <40 years age group has a small sample size, and the analysis results should be interpreted with extreme caution. Other groups have moderate to large sample sizes, and the results can be more reliable. The observed incidence rate is slightly higher than that reported in the literature. Racial differences in MCL incidence have been studied in a few publications. Zhou and others [4] analyzed data on patients diagnosed between 1992 and 2004, and concluded that the incidence of MCL was higher in men than in women, and higher in Caucasians than in blacks. Aschebrook-Kilfoy and others [26] compared MCL incidence between 1992–1994 and 2005–2009, and found that the increase in incidence was strongest for men and for whites. Our analysis includes more racial groups and also provides detailed results on three age groups. Multiple factors are involved in the development of MCL and NHL overall. However, there is a lack of consensus [1, 22, 24]. Lifestyle risk factors have been suggested as associated with NHL overall, and such associations may differ across races [1]. For example, it has been suggested that certain dietary intake [27] and dietary patterns [28] have race-specific effects on the risk of NHL. A challenge is that although the aforementioned studies include MCL, because of small sample sizes, MCL-specific analysis has not been conducted. Recreational exposure to ultraviolet radiation and occupational exposure to pesticides, solvents, and gasoline also contribute to the incidence of MCL [29, 30]. It has been suggested that the racial differences in MCL is at least partly confounded by occupation [31]. The development of infectious diseases and immune suppression may also contribute to MCL risk in a race-specific way. For example, Koshiol and others [23] showed that blacks had a higher risk of NHL associated with infections than whites and a tendency toward higher risk associated with allergies. The genetic hallmark of MCL is the t(11;14) (q13;q32) translocation. Beyond this translocation, MCL tumor cells may also carry a high number of secondary chromosomal and molecular alterations [24]. For NHL overall, it has been suggested that the associations between genetic variants and risk vary across races [32]. In addition, although it is believed that most MCL cells carry the t(11;14) translocation, a study on Chinese patients showed that only 18.2% carried this translocation [33]. For other genetic variations, the racial differences remain to be explored. Another possible contributing factor of the racial differences in incidence is the racial variation in diagnosis [34].
Racial differences in survival exist for many types of cancers. For NHL overall, there has been progress in reducing disparities in survival between non-Hispanic whites and minorities [34]. MCL survival also depends on multiple factors [22]. In our analysis on cancers diagnosed in the period of 1999–2004, when stratified by age, the numbers of patients in the <40 years and 40–64 years groups are relatively small (Table 3). For the 65+ group, the unadjusted survival rates differ by as much as 9.5% (44.4% for non-Hispanic whites versus 34.9% for Hispanic whites). However, the racial difference is not significant in multivariate analysis. The lack of significant difference is also observed for both male and female. When stratified by stage at diagnosis, the racial difference is borderline significant for stage IV tumors. Such difference may be caused by multiple factors. MIPI, the MCL International Prognostic Index, contains four variables, namely age, ECOG performance status, LDH/ULN (upper limit of normal), and white blood cell counts [9]. In Table 1, we observe significant racial differences in age at diagnosis, which, according to MIPI, may contribute to the observed survival differences. In addition, white blood cell counts also vary across races, for example, blacks tend to have lower white blood cell counts than Caucasians. Other possible prognostic factors include Ki-67, MCL cell types, and Beta-2 microglobulin [35]. However such variables are not available in SEER and cannot be accounted for. As with etiology, genetic changes have also been implicated in prognosis [36, 37]. The existing genetic studies usually have small sample sizes. To the best of our knowledge, race has not been accounted for in these studies. Another possible contributing factor is treatment strategy—different racial groups can have different treatments. More racial differences are observed in the analysis of cancers diagnosed in the period of 1999–2004. In the literature, it has been suggested that the incidence and clinical-pathologic features of MCL vary over time. More importantly, the effect of rituximab and other newer treatments on MCL survival has been noted in multiple published studies.
Limitations
The SEER database is analyzed as it is the largest cancer registry in the U.S. Even so, as can be seen from the tables, sample sizes for certain subsets are still small. In addition, using SEER has the following limitations. With multiple sites, errors may arise in tumor classification and staging. However, we do not expect a series of systematic errors correlated with ethnicity. This study may have also been hindered by the multiple coexisting classification schemes. Patients diagnosed before 2001 may have diagnosis codes from earlier ICD-O versions that need to be converted to the ICD-O-3, which may have resulted in a higher proportion of unclassified cases. Clarke and others [38] compared computer-converted ICD-O-3 codes with ICD-O-3 codes generated directly from diagnostic pathology reports, and found that the classification of MCL might have a reliability problem. Furthermore, data collected in SEER may not be comprehensive enough. Quite a few variables that are potentially associated with etiology and prognosis are not available. Information on treatment is lacking. Newer treatment regimens are not included, and there is no information on chemotherapy. In addition, insurance status, socioeconomic status, and treatment availability, which are relevant to treatment and so survival, are not measured. All patients are from the U.S. In the literature there are studies investigating the characteristics, incidence, and survival of MCL in other countries and regions [39–41]. A cross-region comparison is interesting but beyond our scope. In data analysis, we have followed published studies and simply used 0.05 as the p-value cutoff for significance. In stratified analysis, multiple comparison adjustment may be needed [42], which results in a stricter p-value cutoff.
Conclusion
Analysis of the SEER data shows that racial differences exist among MCL patients in the U.S. in terms of patients’ characteristics, incidence, and survival. Although there are multiple possible explanations, the exact causes of the observed differences remain to be identified. More comprehensive data collection and analysis are needed to fully decipher and interpret the racial differences. Despite several limitations, findings in this study can be informative to cancer epidemiologists, clinicians, and policy-makers.
Electronic supplementary material
Additional file 1: Table S4: Multivariate Cox regression analysis of survival, stratified by stage at diagnosis. Table S5. Five-year relative survival rates for cancers diagnosed in the period of 1999–2004, for different racial groups and stratified by age, gender, and stage at diagnosis. Table S6. Multivariate Cox regression analysis of survival for cancers diagnosed in the period of 1999–2004, stratified by stage at diagnosis. (DOCX 34 KB)
Acknowledgements
We thank the editor and two reviewers for careful review and insightful comments, which have led to a significant improvement of this article. This study was supported by awards CA142774 and CA165923 from NCI/NIH and a Yale Cancer Center pilot grant. The funders had no role in study design, data collection and analysis, or manuscript preparation.
Footnotes
Competing interests
The authors declare that they have no competing interests.
Authors’ contributions
Design of study: YW, SM; Data analysis: YW; Manuscript preparation: YW, SM. Both authors read and approved the final manuscript.
Contributor Information
Yu Wang, Email: abyuer@gmail.com.
Shuangge Ma, Email: shuangge.ma@yale.edu.
References
- 1.Zhang Y, Dai Y, Zheng T, Ma S. Risk factors of non-Hodgkin lymphoma. Expert Opin Med Diagn. 2011;5:539–550. doi: 10.1517/17530059.2011.618185. [DOI] [PMC free article] [PubMed] [Google Scholar]
- 2.Banks PM, Chan J, Cleary ML, Delsol G, De Wolf-Peeters C, Gatter K, Grogan TM, Harris NL, Isaacson PG, Jaffe ES, Mason D, Pileri S, Ralfkiaer E, Stein H, Wanke RA. Mantle cell lymphoma. A proposal for unification of morphologic, immunologic, and molecular data. Am J Surg Pathol. 1992;16:637–640. doi: 10.1097/00000478-199207000-00001. [DOI] [PubMed] [Google Scholar]
- 3.Hankin RC, Hunter SV. Mantle cell lymphoma. Arch Pathol Lab Med. 1999;123(12):1182–1188. doi: 10.5858/1999-123-1182-MCL. [DOI] [PubMed] [Google Scholar]
- 4.Zhou Y, Wang H, Fang W, Romaguer JE, Zhang Y, Delasalle KB, Kwak L, Yi Q, Du XL, Wang M. Incidence trends of mantle cell lymphoma in the United States between 1992 and 2004. Cancer. 2008;113(4):791–798. doi: 10.1002/cncr.23608. [DOI] [PubMed] [Google Scholar]
- 5.Howlader N, Noone AM, Krapcho M, Neyman N, Aminou R, Waldron W, Altekruse SF, Kosary CL, Ruhl J, Tatalovich Z, Cho H, Mariotto A, Eisner MP, Lewis DR, Chen HS, Feuer EJ, Cronin KA. SEER Cancer Statistics Review 1975–2009. Bethesda, MD: National Cancer Institute; 2012. [Google Scholar]
- 6.Jares P, Colomer D, Campo E. Genetic and molecular pathogenesis of mantle cell lymphoma: perspectives for new targeted therapeutics. Nat Rev Cancer. 2007;7:750–762. doi: 10.1038/nrc2230. [DOI] [PubMed] [Google Scholar]
- 7.Witzens-Harig M, Hess G, Atta J, Zaiss M, Lenz G, Scholz C, Repp R, Reiser M, Pott C, Pelz H, La Rosée P, Kirchner H, Kiewe P, Keller U, Buske C, Viardot A, Dreyling M. Current treatment of mantle cell lymphoma: results of a national survey and consensus meeting. Ann Hematol. 2012;91:1765–1772. doi: 10.1007/s00277-012-1534-y. [DOI] [PubMed] [Google Scholar]
- 8.Herrmann A, Hoster E, Zwingers T, Brittinger G, Engelhard M, Meusers P, Reiser M, Forstpointner R, Metzner B, Peter N, Wörmann B, Trümper L, Pfreundschuh M, Einsele H, Hiddemann W, Unterhalt M, Dreyling M. Improvement of overall survival in advanced stage mantle cell lymphoma. J Clin Oncol. 2009;27(4):511–518. doi: 10.1200/JCO.2008.16.8435. [DOI] [PubMed] [Google Scholar]
- 9.Hoster E. Prognostic relevance of clinical risk factors in mantle cell lymphoma. Semin Hematol. 2011;48(3):185–188. doi: 10.1053/j.seminhematol.2011.06.001. [DOI] [PubMed] [Google Scholar]
- 10.Chandran R, Gardiner SK, Simon M, Spurgeon SE. Survival trends in mantle cell lymphoma in the United States over 16 years 1992–2007. Leuk Lymphoma. 2012;53(8):1488–1493. doi: 10.3109/10428194.2012.656628. [DOI] [PubMed] [Google Scholar]
- 11.Shenoy PJ, Malik N, Nooka A, Sinha R, Ward KC, Brawley OW, Lipscomb J, Flowers CR. Racial differences in the presentation and outcomes of diffuse large B-cell lymphoma in the United States. Cancer. 2010;117(11):2530–2540. doi: 10.1002/cncr.25765. [DOI] [PubMed] [Google Scholar]
- 12.Griffiths R, Gleeson M, Knopf K, Danese M. Racial differences in treatment and survival in older patients with diffuse large B-cell lymphoma (DLBCL) BMC Cancer. 2010;10:625. doi: 10.1186/1471-2407-10-625. [DOI] [PMC free article] [PubMed] [Google Scholar]
- 13.Flowers CR, Shenoy PJ, Borate U, Bumpers K, Douglas-Holland T, King N, Brawley OW, Lipscomb J, Lechowicz MJ, Sinha R, Grover RS, Bernal-Mizrachi L, Kowalski J, Donnellan W, The A, Reddy V, Jaye DL, Foran J. Examining racial differences in diffuse large B-cell lymphoma presentation and survival. Leuk Lymphoma. 2013;54:268–276. doi: 10.3109/10428194.2012.708751. [DOI] [PMC free article] [PubMed] [Google Scholar]
- 14.Evens AM, Antillón M, Aschebrook-Kilfoy B, Chiu BC. Racial disparities in Hodgkin’s lymphoma: a comprehensive population-based analysis. Ann Oncol. 2012;23:2128–2137. doi: 10.1093/annonc/mdr578. [DOI] [PubMed] [Google Scholar]
- 15.Nabhan C, Byrtek M, Taylor MD, Friedberg JW, Cerhan JR, Hainsworth JD, Miller TP, Hirata J, Link BK, Flowers CR. Racial differences in presentation and management of follicular non-Hodgkin lymphoma in the United States: report from the national LymphoCare study. Cancer. 2012;118:4842–4850. doi: 10.1002/cncr.27513. [DOI] [PubMed] [Google Scholar]
- 16.Kato I, Booza J, Quarshie WO, Schwartz K. Persistent socioeconomic inequalities in cancer survival in the United States: 1973–2007 surveillance, epidemiology and end results (SEER) data for breast cancer and non-Hodgkin’s lymphoma. J Registry Manag. 2012;39:158–166. [PubMed] [Google Scholar]
- 17.Flowers CR, Fedewa SA, Chen AY, Nastoupil LJ, Lipscomb J, Brawley OW, Ward EM. Disparities in the early adoption of chemoimmunotherapy for diffuse large B-cell lymphoma in the United States. Cancer Epidemiol Biomarkers Prev. 2012;21:1520–1530. doi: 10.1158/1055-9965.EPI-12-0466. [DOI] [PMC free article] [PubMed] [Google Scholar]
- 18.Shenoy PJ, Malik N, Sinha R, Nooka A, Nastoupil LJ, Smith M, Flowers CR. Racial differences in the presentation and outcomes of chronic lymphocytic leukemia and variants in the United States. Clin Lymphoma Myeloma Leuk. 2011;11:498–506. doi: 10.1016/j.clml.2011.07.002. [DOI] [PubMed] [Google Scholar]
- 19.Chim CS, Chan AC, Choo CK, Kwong YL, Lie AK, Liang R. Mantle cell lymphoma in the Chinese: clinicopathological features and treatment outcome. Am J Hematol. 1998;59(4):295–301. doi: 10.1002/(sici)1096-8652(199812)59:4<295::aid-ajh5>3.0.co;2-n. [DOI] [PubMed] [Google Scholar]
- 20.Griffiths R, Mikhael J, Gleeson M, Danese M, Dreyling M. Addition of rituximab to chemotherapy alone as first-line therapy improves overall survival in elderly patients with mantle cell lymphoma. Blood. 2011;118:4808–4816. doi: 10.1182/blood-2011-04-348367. [DOI] [PMC free article] [PubMed] [Google Scholar]
- 21.Ederer F, Axtell LM, Cutler SJ. The relative survival rate: a statistical methodology. NCI Monogr. 1961;6:101–121. [PubMed] [Google Scholar]
- 22.Wang Y, Ma S: Risk factors for etiology and prognosis of mantle cell lymphoma.Expert Rev Hematol In press [DOI] [PMC free article] [PubMed]
- 23.Koshiol J, Lam TK, Gridley G, Check D, Brown LM, Landgren O. Racial differences in chronic immune stimulatory conditions and risk of non-Hodgkin’s lymphoma in veterans from the United States. J Clin Oncol. 2011;29:378–385. doi: 10.1200/JCO.2010.30.1515. [DOI] [PMC free article] [PubMed] [Google Scholar]
- 24.Smedby KE, Hjalgrim H. Epidemiology and etiology of mantle cell lymphoma and other non-Hodgkin lymphoma subtypes. Semin Cancer Biol. 2011;21:293–298. doi: 10.1016/j.semcancer.2011.09.010. [DOI] [PubMed] [Google Scholar]
- 25.Bulanda JR, Brown SL. Race-ethnic differences in marital quality and divorce. Soc Sci Res. 2007;36:945–967. [Google Scholar]
- 26.Aschebrook-Kilfoy B, Caces DB, Ollberding NJ, Smith SM, Chiu BC. An upward trend in the age-specific incidence patterns for mantle cell lymphoma in the USA. Leuk Lymphoma. 2013;54:1677–1683. doi: 10.3109/10428194.2012.760041. [DOI] [PubMed] [Google Scholar]
- 27.Erber E, Maskarinec G, Lim U, Kolonel LN. Dietary vitamin D and risk of non-Hodgkin lymphoma: the multiethnic cohort. Br J Nutr. 2010;103:581–584. doi: 10.1017/S0007114509992029. [DOI] [PMC free article] [PubMed] [Google Scholar]
- 28.Erber E, Maskarinec G, Gill JK, Park SY, Kolonel LN. Dietary patterns and the risk of non-Hodgkin lymphoma: the multiethnic cohort. Leuk Lymphoma. 2009;50:1269–1275. doi: 10.1080/10428190903030841. [DOI] [PMC free article] [PubMed] [Google Scholar]
- 29.Eriksson M, Hardell L, Carlberg M, Akerman M. Pesticide exposure as risk factor for non-Hodgkin lymphoma including histopathological subgroup analysis. Int J Cancer. 2008;123:1657–1663. doi: 10.1002/ijc.23589. [DOI] [PubMed] [Google Scholar]
- 30.Cocco P, t’Mannetje A, Fadda D, Melis M, Becker N, de Sanjose S, Foretova L, Mareckova J, Staines A, Kleefeld S, Maynadié M, Nieters A, Brennan P, Boffetta P. Occupational exposure to solvents and risk of lymphoma subtypes: results from the Epilymph case–control study. Occup Environ Med. 2010;67:341–347. doi: 10.1136/oem.2009.046839. [DOI] [PubMed] [Google Scholar]
- 31.Aminian O, Abedi A, Chavoshi F, Ghasemi M, Najarkolaei FR. Evaluation of occupational risk factors in non-Hodgkin lymphoma and Hodgkin’s disease in Iranian men. Iran J Cancer Prev. 2012;4:189–193. [PMC free article] [PubMed] [Google Scholar]
- 32.Skibola CF, Bracci PM, Nieters A, Brooks-Wilson A, de Sanjosé S, Hughes AM, Cerhan JR, Skibola DR, Purdue M, Kane E, Lan Q, Foretova L, Schenk M, Spinelli JJ, Slager SL, De Roos AJ, Smith MT, Roman E, Cozen W, Boffetta P, Kricker A, Zheng T, Lightfoot T, Cocco P, Benavente Y, Zhang Y, Hartge P, Linet MS, Becker N, Brennan P. Tumor necrosis factor (TNF) and lymphotoxin-alpha (LTA) polymorphisms and risk of non-Hodgkin lymphoma in the InterLymph Consortium. Am J Epidemiol. 2010;171:267–276. doi: 10.1093/aje/kwp383. [DOI] [PMC free article] [PubMed] [Google Scholar]
- 33.Wong KF, Chan JK. Cytogenetic abnormalities in chronic B-cell lymphoproliferative disorders in Chinese patients. Cancer Genet Cytogenet. 1999;111:55–60. doi: 10.1016/s0165-4608(98)00216-7. [DOI] [PubMed] [Google Scholar]
- 34.Pulte D, Redaniel MT, Brenner H, Jeffreys M. Changes in survival by ethnicity of patients with cancer between 1992–1996 and 2002–2006: is the discrepancy decreasing? Ann Oncol. 2012;23(9):2428–2434. doi: 10.1093/annonc/mds023. [DOI] [PubMed] [Google Scholar]
- 35.Katzenberger T, Petzoldt C, Höller S, Mäder U, Kalla J, Adam P, Ott MM, Müller-Hermelink HK, Rosenwald A, Ott G. The Ki67 proliferation index is a quantitative indicator of clinical risk in mantle cell lymphoma. Blood. 2006;107(8):3407. doi: 10.1182/blood-2005-10-4079. [DOI] [PubMed] [Google Scholar]
- 36.Navarro A, Clot G, Royo C, Jares P, Hadzidimitriou A, Agathangelidis A, Bikos V, Darzentas N, Papadaki T, Salaverria I, Pinyol M, Puig X, Palomero J, Vegliante MC, Amador V, Martinez-Trillos A, Stefancikova L, Wiestner A, Wilson W, Pott C, Calasanz MJ, Trim N, Erber W, Sander B, Ott G, Rosenwald A, Colomer D, Giné E, Siebert R, Lopez-Guillermo A. Status and SOX11 expression have distinct biologic and clinical features. Cancer Res. 2012;72(20):5307–5316. doi: 10.1158/0008-5472.CAN-12-1615. [DOI] [PMC free article] [PubMed] [Google Scholar]
- 37.Rosenwald A, Wright G, Wiestner A, Chan WC, Connors JM, Campo E, Gascoyne RD, Grogan TM, Muller-Hermelink HK, Smeland EB, Chiorazzi M, Giltnane JM, Hurt EM, Zhao H, Averett L, Henrickson S, Yang L, Powell J, Wilson WH, Jaffe ES, Simon R, Klausner RD, Montserrat E, Bosch F, Greiner TC, Weisenburger DD, Sanger WG, Dave BJ, Lynch JC, Vose J. The proliferation gene expression signature is a quantitative integrator of oncogenic events that predicts survival in mantle cell lymphoma. Cancer Cell. 2003;3:185–197. doi: 10.1016/s1535-6108(03)00028-x. [DOI] [PubMed] [Google Scholar]
- 38.Clarke CA, Undurraga DM, Harasty PJ, Glaser SL, Morton LM, Holly EA. Changes in cancer registry coding for lymphoma subtypes: reliability over time and relevance for surveillance and study. Cancer Epidemiol Biomarkers Prev. 2006;15:630–638. doi: 10.1158/1055-9965.EPI-05-0549. [DOI] [PubMed] [Google Scholar]
- 39.Leux C, Maynadié M, Troussard X, Cabrera Q, Herry A, Le Guyader-Peyrou S, Le Gouill S, Monnereau A. Mantle cell lymphoma epidemiology: a population-based study in France. Ann Hematol. 2014;93(8):1327–1333. doi: 10.1007/s00277-014-2049-5. [DOI] [PubMed] [Google Scholar]
- 40.Naresh KN, Srinivas V, Soman CS. Distribution of various subtypes of non-Hodgkin’s lymphoma in India: a study of 2773 lymphomas using R.E.A.L. and WHO Classifications. Ann Oncol. 2000;11(Suppl 1):63–67. [PubMed] [Google Scholar]
- 41.Cheah CY, George A, Gine E, Giné E, Chiappella A, Kluin-Nelemans HC, Jurczak W, Krawczyk K, Mocikova H, Klener P, Salek D, Walewski J, Szymczyk M, Smolej L, Auer RL, Ritchie DS, Arcaini L, Williams ME, Dreyling M, Seymour JF, European Mantle Cell Lymphoma Network Central nervous system involvement in mantle cell lymphoma: clinical features, prognostic factors and outcomes from the European Mantle Cell Lymphoma Network. Ann Oncol. 2013;24(8):2119–2123. doi: 10.1093/annonc/mdt139. [DOI] [PubMed] [Google Scholar]
- 42.Greenland S. Multiple comparisons and association selection in general epidemiology. Int J Epidemiol. 2008;37(3):430–434. doi: 10.1093/ije/dyn064. [DOI] [PubMed] [Google Scholar]
Pre-publication history
- The pre-publication history for this paper can be accessed here:http://www.biomedcentral.com/1471-2407/14/764/prepub
Associated Data
This section collects any data citations, data availability statements, or supplementary materials included in this article.
Supplementary Materials
Additional file 1: Table S4: Multivariate Cox regression analysis of survival, stratified by stage at diagnosis. Table S5. Five-year relative survival rates for cancers diagnosed in the period of 1999–2004, for different racial groups and stratified by age, gender, and stage at diagnosis. Table S6. Multivariate Cox regression analysis of survival for cancers diagnosed in the period of 1999–2004, stratified by stage at diagnosis. (DOCX 34 KB)