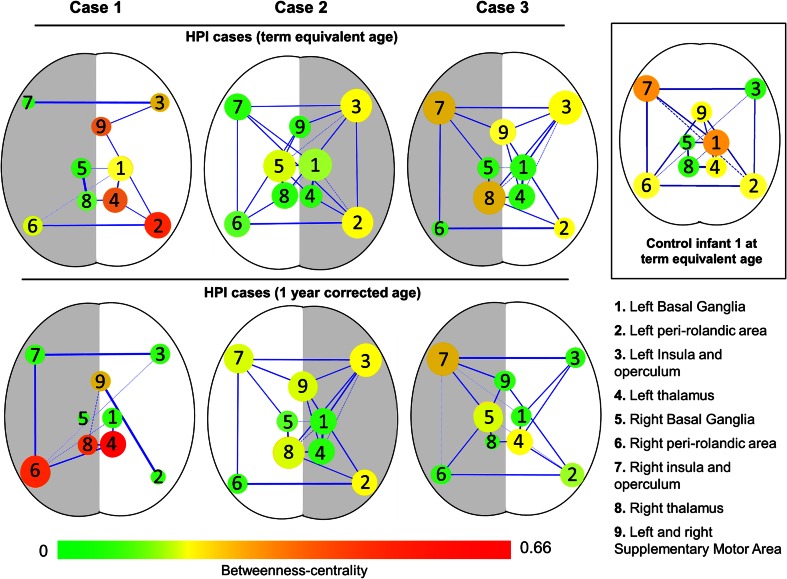
Fig. 4.
Functional connectivity in the sensori-motor network. In an example control infant (inset box), a clear pattern of functional connectivity can be seen between one brain region and its homotopic counterpart in the opposite hemisphere. In case infants, functional connectivity between the lesional (grey) and non-lesional hemisphere (white) is largely preserved even in the presence of focal brain pathology. The exception is case 1 at 1 year of age, who has lost inter-hemispheric connectivity between the perirolandic regions and has functionally ‘disconnected’ ipsilesional basal ganglia. Intra-hemispheric connectivity between the perirolandic regions and the supplementary motor area (SMA) is absent in the lesional hemisphere in all cases at term equivalent age and the majority at 1 year of age. Node sizes are scaled by degree (the number of connected edges), node colour is scaled by betweeness centrality (a measure of the amount of control that a node exerts over the interactions of other nodes in the network), and edge thickness is scaled by the pairwise Pearson’s partial correlation coefficient. Only edges which survived a false discovery rate correction (FDR) correction of p < 0.05 are shown

