. 2014 Oct 2;3:e02862. doi: 10.7554/eLife.02862

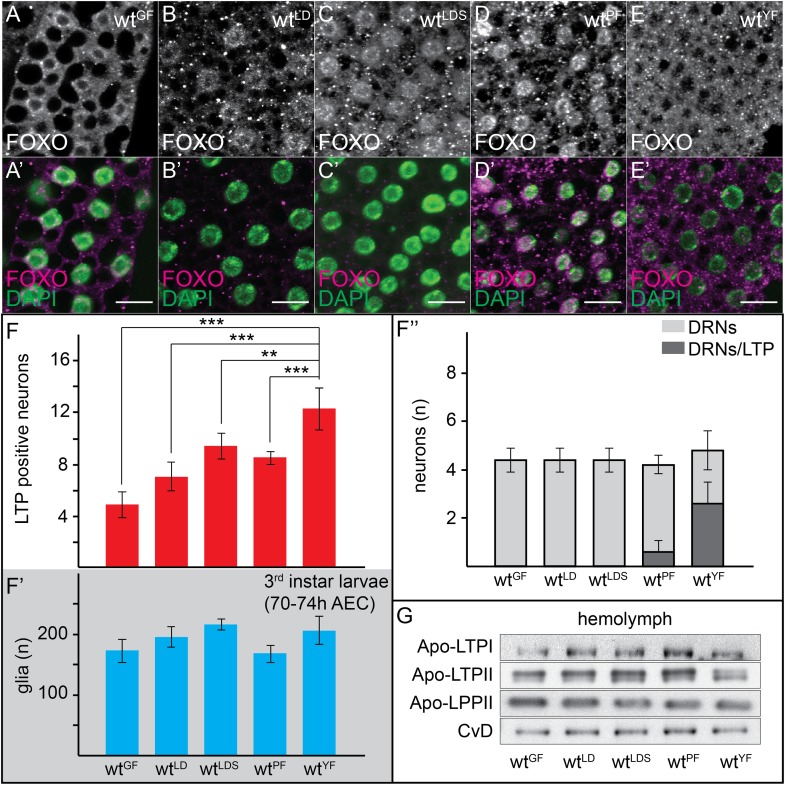
Figure 3. Neuronal LTP accumulation is diet-dependent.

(AE′) Confocal stack projections of fat bodies from early third instar larvae raised on GF (A and A′), LDF (B and B′), LDSF (C and C′), PF (D and D′) and YF (E and E′) probed for FOXO (AE and AE′ magenta) and DAPI (A′E′, green). Scale bars = 20 μm. (FF′″) average number of LTP-positive neurons/brain lobe (F), glial cells/brain (F′) and LTP-positive DRNs (F″) in brains of larvae transferred from YF to indicated diets in the late second instar. Error bars indicate standard deviation. T-test significance: **p < 0.01, ***p < 0.001. (G) Equal hemolymph volumes from wt larvae raised on indicated food sources Western blotted and probed for the indicated Apolipoproteins.

DOI: http://dx.doi.org/10.7554/eLife.02862.016

Figure 3.

Figure 3—figure supplement 1. Only yeast food promotes LTP enrichments on DRNs.

Figure 3—figure supplement 1.

Panel shows numbers (see also Figure 3F–F’’) of LTP positive neurons/brain hemisphere (red) and Repo positive glia/brain (blue), and DRNs/brain (light grey) or LTP positive DRNs/brain (dark grey) from wt larvae reared on YF till late 2nd instar and transferred for 16hr on GF, LD, LDS, PF or YF. p-values (Students t’test) are indicated, superscript numbers = standard deviation.

Figure 3—figure supplement 2. LTP enrichments on DRNs are reversible.

Figure 3—figure supplement 2.

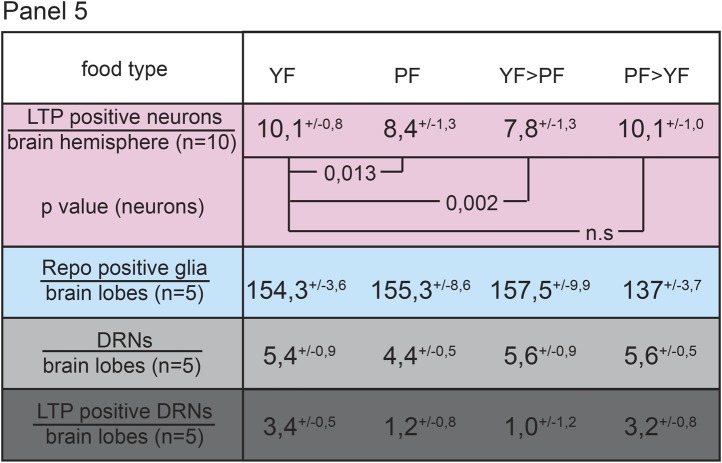
Panel shows numbers (see also Figure 1—figure supplement 3A,A′,C) of LTP positive neurons/brain hemisphere (red) and Repo positive glia/brain (blue), and DRNs/brain (light grey) or LTP positive DRNs/brain (dark grey) from larvae reared on YF, PF, larva reared on PF till late 2nd instar and transferred on YF and larva reared till late 2nd instar on YF and transferred on PF. p-values (Students t’test) are indicated, superscript numbers = standard deviation.