

Abstract
The title compound, which differs from the powerful O-GlcNAcase (OGA) inhibitor GlcNAc-thiazoline only at the chalcogen atom (Se for S), is a much weaker inhibitor in a direct OGA assay. In human cells, however, the selenazoline shows comparable ability to induce hyper-O-GlcNAc-ylation, and the two show similar reduction of insulin-stimulated translocation of glucose transporter 4 in differentiated 3T3 adipocytes.
Keywords: Woollins reagent, Post-translational modification, Lipophilicity, Hyperglycemia, N-Acetylhexosaminidase, Transcription factor, Transition state
1. Introduction
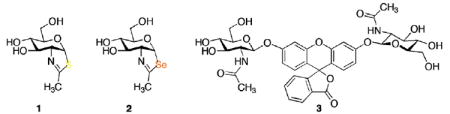
The dynamic post-translational modification of cytoplasmic and nuclear proteins by O-linked 2-acetamido-2-deoxy-β-d-glucopyranosyl (O-GlcNAc) residues is an important signaling mechanism with analogies to phosphorylation.1 The diverse cellular functions that are affected include nutrient sensing,2 regulation of gene expression,3 target protein activity modification4 and protein degradation. 5 Disregulation of O-GlcNAc modification has been implicated in insulin resistance6 and Alzheimer’s disease.7 The recent discovery that transcription factor Forkhead Box Fox01 is regulated by this O-GlcNAc modification provides a potential mechanism by which hyperglycemia promotes gluconeogenesis and worsening of glucose intolerance.8 O-GlcNAc metabolism is regulated by two key enzymes: O-GlcNAc transferase (OGT) and O-GlcNAcase (OGA). OGT catalyzes the transfer of O-GlcNAc from a UDP-GlcNAc donor to the various target proteins, and OGA catalyzes O-GlcNAc hydrolytic removal.9 A number of mechanistic and inhibition studies10,11 have demonstrated that two aspartic acids (Asp174 and 175) in the OGA active site of the N-terminal domain are key catalytic residues that enable a substrate-assisted mechanism. The inhibitor GlcNAc-thiazoline (1) and its relatives bind in enzyme active sites in the pseudo-chair (4C1) conformation. Based on the correlation of free energy of activation calculated from enzymatic substrate hydrolysis relative to ΔG≠ for inhibitor binding, Vocadlo and co-workers concluded that 1 and its analogues behave specifically as OGA transition state mimics.11 In this paper, we evaluate comparative OGA inhibition by the GlcNAc-selenazoline (2), a close analogue of 1, but with greater lipophilicity and longer carbon–chalcogen bonds.
OGA uses a double displacement mechanism (Fig. 1) that features substrate-assisted catalysis: the substrate A binds in the 1S3 twist boat conformation with co-linear orientation of the leaving aglycon oxygen and the approaching amide carbonyl oxygen. Bond rupture at the anomeric carbon (C-1) is accompanied by participation of the amide carbonyl from the opposite face. During the intramolecular “SN2-like” reaction, the pyranose ring flattens about C-1, and then inverts toward a bicyclic oxazolinium intermediate C through transition state B. On the basis of studies that include linear free energy correlations, X-ray crystallographic analyses, and computational modeling, Vocadlo and co-workers suggest that the thiazoline 1 in the chair conformation is closer to the trigonal bipyramidal “SN2” transition state B (Fig. 1) rather than the oxazolinium intermediate C.11 The highly structurally analogous α-Glc-NAc-selenazoline 2 might be anticipated to inhibit OGA analogously.
Figure 1.
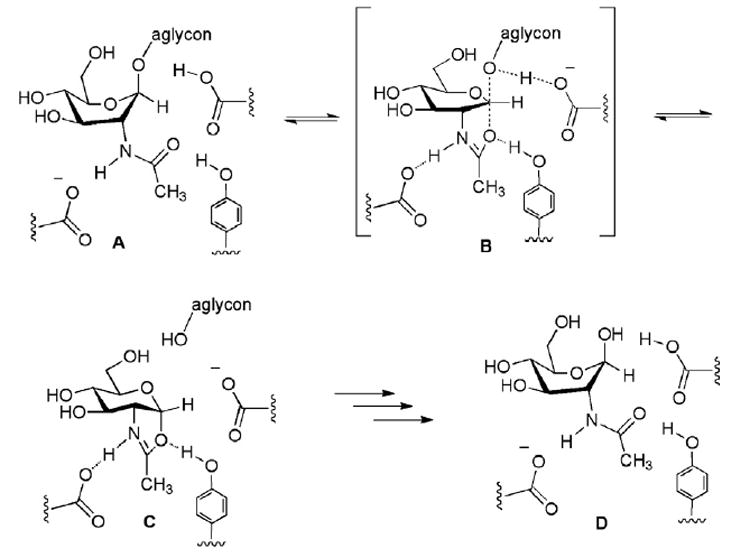
Substrate-assisted catalytic hydrolysis mechanism used by OGA (A → [B]‡ → C → D).
2. Results and discussion
2.1. Synthesis of GlcNAc-selenazoline
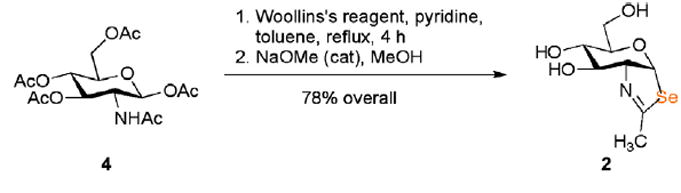
We have prepared 2 (Scheme 1) by treating β-d-glucosamine penta-acetate 4 with the Woollins reagent, [PhP(=Se)Se]2,12 followed by O-deacetylation. The purpose of the pyridine in the selenonation reaction is to neutralize the acid that accumulates during the cyclization. Without the added base, the acetic acid liberated by product formation is converted13 by the Woollins reagent to the (more acidic) selenoacetic acid, which causes counterproductive O-cyclization of 4 to an oxazoline.
Scheme 1.
2.2. OGA inhibition by GlcNAc-selenazoline
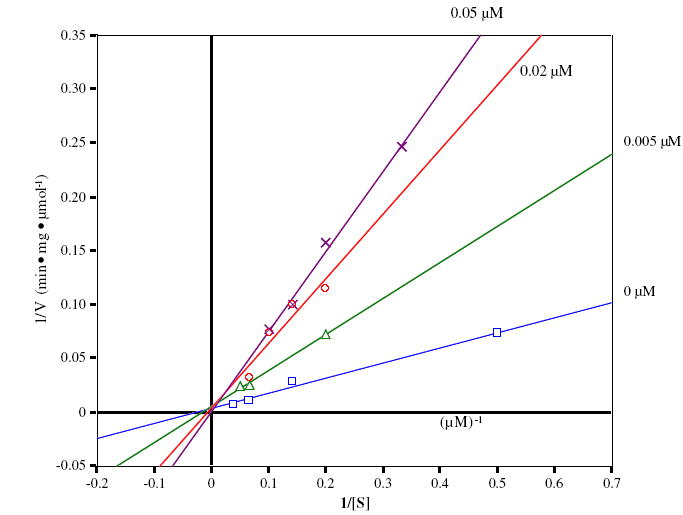
Evaluation of OGA inhibition by 2 was carried out by using FDGlcNAc (3)14 as the OGA substrate. A Lineweaver–Burk plot of the initial velocity at various concentrations of 2 shows that 2 competitively inhibits OGA with a Ki of 0.7 μM (Fig. 2). Compared with 1 (Ki = 0.01 μM), 2 is obviously a much less potent competitive inhibitor (about 70-fold; see Fig. 3). For comparison, competitive inhibition Ki’s for 1 and 2 against a hexosaminidase from the bacterium Streptomyces plicatus (with p-nitrophenyl β-d-N-acetylglucosaminide as the substrate)15 are 20 and 170 μM, respectively, an eightfold difference. The disparity between 1 and 2 as inhibitors might be attributable to, among other factors, the longer carbon–chalcogen bond distance in 2, and the poorer ability of the divalent selenium atom (relative to sulfur) to act as a hydrogen bond acceptor in the active site. Among N-acetylhexosaminidases, OGA is known to be relatively tolerant of small steric differences in the neighborhood of the substrate acetamido methyl group,11,16 but in this instance is responding dramatically to changes at the anomeric participating heteroatom.
Figure 2.
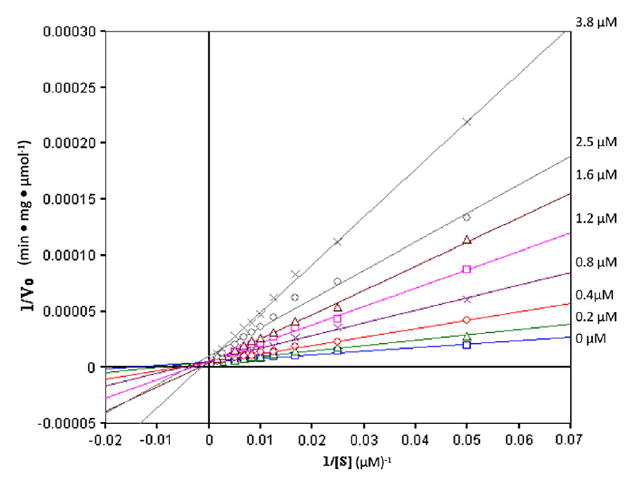
Lineweaver–Burk analysis of OGA inhibition in the absence and the presence of increasing concentrations of 2 with FDGlcNAc 3 as substrate.
Figure 3.
Lineweaver–Burk analysis of OGA inhibition in the absence and the presence of increasing concentrations of 1 with FDGlcNAc 3 as substrate.
The 4C1 chair conformation of 2 (shown) is calculated to be the most stable, according to ab initio calculations17 (B3LYP/6-31G*), which also estimate respective C–Se bond lengths of 2.03 (to C-1) and 1.94 Å. Two other conformations, 0S2 and 1S3, are energetically accessible and may also contribute in solution. By comparison, small molecule crystallographic data for the 4C1 conformation of a 6-O-acylated derivative of 1 indicate respective C-S distances of 1.85 (to C-1) and 1.76 Å, and the corresponding calculated (B3LYP/6-31G*) distances are 1.89 and 1.80 Å, respectively.17 The respective carbon–chalcogen–carbon bond angles of 1 and 2 are calculated to be 87.8° and 83.2° (4C1 conformations), whereas the crystallographic C–S–C angle is 88.8°. The calculated 4C1 conformations of the GlcNAc-oxazoline, -thiazoline (1), and - selenazoline (2) are displayed in Figure 4, overlapped at C-1 and C-2 so as to emphasize the differences around the chalcogen and anomeric carbon.
Figure 4.
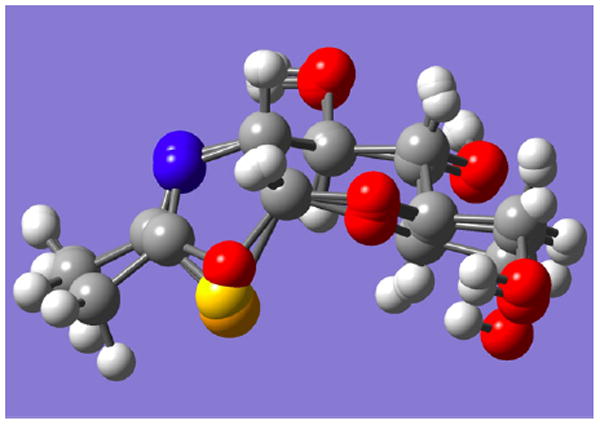
Calculated 4C1 structures of oxazoline intermediate C, thiazoline 1, and selenazoline 2 overlapped at C-1 and C-2 (carbohydrate numbering), showing the respective chalcogens protruding at center bottom. Atom colors: red (oxygen), blue (nitrogen), yellow (sulfur), and orange (selenium).
A sequence aligning diagram (Section 3.6 and Fig. 8) allows comparison of the amino acid residues of human OGA, particularly those in the active site, with the corresponding residues of a bacterial OGA whose structure has been crystallographically determined.18
Figure 8.
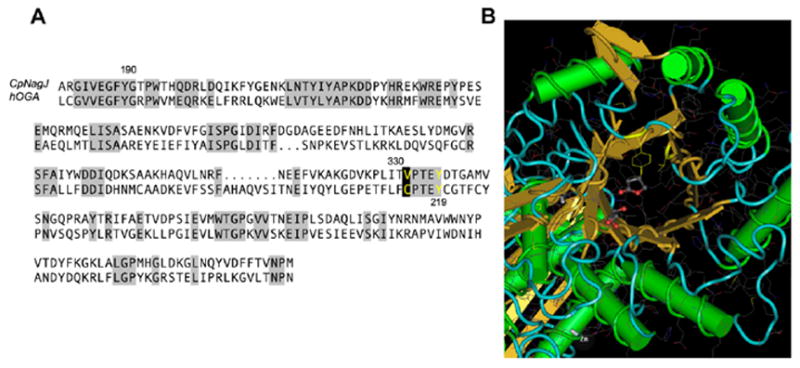
(A) Sequence alignment of hOGA with CpNAgJ. Areas of high sequence similarity are shaded gray. Catalytically important residues such as Tyr335 (corresponding to hOGA Tyr219) are highlighted in yellow. (B) The crystal structure of CpNAgJ, with the catalytically important Tyr335 and the site of the predicted Cys215 in hOGA (here, Val331) highlighted in yellow. PugNAc (5) is shown bound to the active site of CpNAgJ in this structure.
The selenium atom protrudes into the space occupied in OGA by Tyr219, a residue that is thought to act as a hydrogen bond donor to the substrate amide carbonyl oxygen, and thereby steer it into place beneath and close to C-1 (see threading diagram, Section 3.6). Furthermore, the selenium atom of 2 can be expected to accept a hydrogen bond from this residue much more weakly than O or S in the comparable position.19
2.3. Effect of 1 and 2 on global GlcNAc-ylation
In order to see whether 2 is able to induce hyper-O-GlcNAc-ylation in human cell lines, HT-29 and HeLa cells were incubated, respectively, in the absence and the presence of inhibitors (1 and 2) for 48 h. As shown in Figure 5, incubation of cells with 1 resulted in a significant increase in the globally O-GlcNAc-modified protein level, and the increase in the O-GlcNAc level by 2 was only marginally less than the O-GlcNAc level in the cells treated with 1. Internalization of 1 and 2 into the cells can be considered as a factor in this OGA inhibition experiment. Inhibitor 2 can be assumed to be somewhat more lipophilic than 1. For example, 2 has a higher chromatographic Rf than 1.20 The greater lipophilicity of 2 relative to 1 (a much stronger inhibitor) may account for the fact that their cellular activities are similar.21
Figure 5.
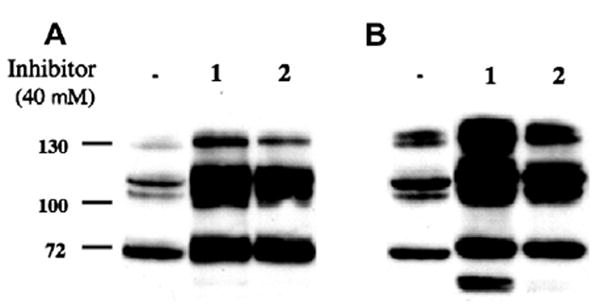
An increase in O-GlcNAc level by the treatment of cells with inhibitors 1 and 2. HT-29 (A) and HeLa (B) cells were incubated in the absence and the presence of the inhibitor for 48 h.
2.4. Effect of 1 and 2 on the level of GLUT4 translocation
We have further examined the effect of 1 and 2, as well as PUGNAc (5), which has also been commonly used for the study of O-GlcNAcase inhibition,10,11 on the insulin-stimulated translocation of glucose transporter 4 (GLUT4). GLUT4 is an isoform of glucose transporters that mediate glucose uptake in mammalian cells.22 It is selectively expressed in adipocytes and muscle,23 and continually recycles between the plasma membrane and intracellular storage sites.24 In the absence of insulin or other stimuli, approximately 90% of GLUT4 is localized in the intracellular storage sites.24 Upon insulin stimulation, net translocation of GLUT4 is induced from the intracellular storage sites to the plasma membrane and glucose uptake is stimulated.25 As described above, defects in O-GlcNAc cycling are known to be associated with diabetic insulin resistance. Elevated intracellular O-GlcNAc modification of certain kinds of proteins involved in the insulin signaling pathway is suspected to suppress GLUT4 translocation, leading to insulin resistance.26 Semiquantitative analysis of the translocation of GLUT4 in 3T3-L1 adipocytes can be performed by labeling GLUT4 on the plasma membrane with a cell-impermeant biotinylated bis(mannose) photolabeling agent, Bio-ATB-BMPA.27
We treated cells with the inhibitors 1, 2, and 5, measured GLUT4 on the plasma membrane by using the Bio-ATB-BMPA labeling agent, and compared the relative amounts of cell-surface GLUT4 in the inhibitor-treated cells to that in untreated cells. Briefly, differentiated 3T3 adipocytes cells incubated without and with each OGA inhibitor were stimulated with insulin, and then treated with Bio-ATB-BMPA. Following UV-irradiation-induced cross-linking of the biotinylated photolabels to the adipocytes, cells were lysed and biotinylated. GLUT4 proteins on the cell surface were isolated using streptavidin beads from the same amounts of whole cell lysates. Then, isolated GLUT4 was analyzed by using conventional GLUT4 Western blots normalized to GAPDH (see Section 3.5 for the detailed experimental procedure). In each case, the levels of O-GlcNAc in the treated cells were monitored by RL-2 immunoblotting in parallel to confirm inhibition of O-GlcNAcase. As shown in Figure 6, cells stimulated with insulin (1st lane) showed an increase in the amount of GLUT4 translocated to the plasma membrane compared with unstimulated cells (2nd lane). However, treatment of cells with 1, 2 or 5 variably reduced the insulin-stimulated translocation of GLUT4 to the plasma membrane (43%, 16.3%, and 35.6%, respectively), indicating that each of these inhibitors has an effect on the glucose uptake in cells through the change in the level of GLUT4 exposed on the cell surface. The inhibitors also reduced the activation of PDK1 and AKT (data not shown). The inhibitors had no effect on total cellular GLUT4 levels (data not shown).
Figure 6.
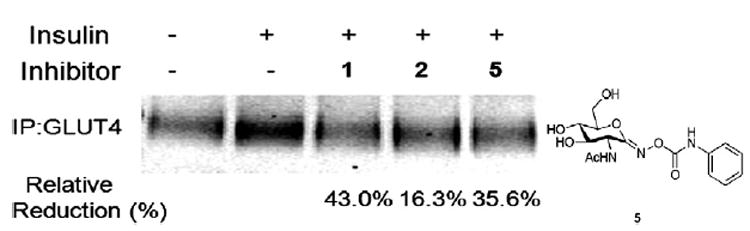
Treatment of cells with OGA inhibitors (1, 2, or 5) results in a reduction of insulin-stimulated GLUT4 translocation.
Recently, Vocadlo reported28 that an increase in the level of O-GlcNAc in 3T3-L1 adipocytes treated with NButGT (1,2-dideoxy-2′-propyl-α-d-glucopyranoso-[2,1-D]-Δ2′-thiazoline), a selective inhibitor for OGA but not the functionally similar lysosomal hexosaminidases (1:1200 selectivity), does not by itself cause insulin resistance. This is a surprising observation inasmuch as the growing body of evidence accumulated by studying inhibition by PUGNAc 5 (a non-selective inhibitor of both OGA and lysosomal hexosaminidases), as well as by genetic studies, suggests that elevated O-GlcNAc levels can either cause insulin resistance29 or result in perturbed glucohomeostasis.30 Like 5, 1 and 2 can inhibit lysosomal hexosaminidases A and B (Fig. 7). Therefore, the effect of those compounds on the reduction of insulin-stimulated GLUT4 translocation to the plasma membrane in 3T3-L1 adipocytes may not be caused by the inhibition of OGA and the increased O-GlcNAc levels. In order to clarify this further, and to get a better understanding of the effects of global increases of O-GlcNAc levels, future investigations should be performed using the array of selective OGA inhibitors now available.
Figure 7.
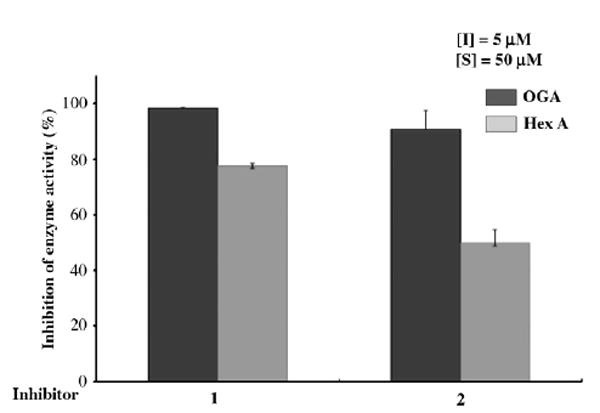
Analysis of inhibition of OGA and Hex A and B by GlcNAc-thiazoline (1) and GlcNAc-selenazoline (2).
3. Experimental
3.1. (3aR,5R,6S,7R,7aR)-5-(Hydroxymethyl)-2-methyl-5,6,7,7atetrahydro-3aH-pyrano[3,2-d]selenazole-6,7-diol (2)
A mixture of 500 mg (1.30 mmol) of glucosamine penta-acetate 5, 1.00 g (1.90 mmol) of the Woollins reagent, 0.416 μL (5.12 mmol) of pyridine, and 6 mL of toluene was heated at reflux for 4 h. The resulting solution was allowed to cool to 23 °C, concentrated under reduced pressure, and then chromatographed on silica gel with 3:7 ethyl acetate/dichloromethane as the eluant to give 414 mg (82%) of the GlcNAc-selenazoline triacetate as a colorless oil, Rf = 0.4, 2:3 ethyl acetate/dichloromethane: 1H NMR (400 MHz, CDCl3) δ 6.78 (d, 1H, J = 6.8 Hz), 5.60 (app t, 1H, J = 4.0, 3.2 Hz), 5.01 (dd, 1H, J = 9.6, 3.2 Hz), 4.42–4.52 (m, 1H), 4.18 (dd, 1H, J = 12.4, 5.6 Hz), 4.14 (dd, 1H, J = 12.4, 3.2 Hz), 3.65 (ddd, 1H, J = 9.6, 5.6, 3.2 Hz), 2.48 (d, 3H, J = 2.0 Hz), 2.15, 2.10, 2.09 (3s, 3H each); 13C NMR (100 MHz, CDCl3) δ 170.9, 169.9, 169.7, 169.7, 90.7, 76.8, 71.0, 70.4, 69.1, 63.1, 24.7, 21.3, 21.2, 21.1; ESI-MS m/z 414 MNa+.
A solution of the GlcNAc-selenazoline triacetate (40 mg, 0.102 mmol) in 1 mL of methanol was treated at 0 °C with sodium methoxide (0.010 μL of a 1 M solution in methanol). After 1 h at 0 °C, the solution was concentrated under vacuum and chromatographed on silica gel with 1:19 methanol/dichloromethane as the eluant to give 26 mg (95%) of triol 2 as a colorless oil, Rf 0.2, 1:19 methanol/dichloromethane: 1H NMR (500 MHz, CD3OD) δ 6.90 (d, 1H, J = 6.0 Hz), 4.24 (ddd, 1H, J = 7.0, 6.5, 1.0 Hz), 3.87–3.91 (m, 3H), 3.77 (d, 1H, J = 12.0, 6.5 Hz), 3.73 (d, 1H, J = 12.0, 4.5 Hz), 2.31 (d, 1H, J = 1.0 Hz); 13C NMR (125 MHz, CD3OD) δ 170.4, 93.6, 77.3, 75.9, 71.1, 67.5, 61.0, 24.6.; ESI-MS m/z 298 MNa+.
3.2. Determination of Ki’s for inhibition of OGA by 1 and 2
For inhibition studies of OGA by GlcNAc-thiazoline (1) and Glc-NAc-selenazoline (2), FDGlcNAc (3) was used as a fluorogenic substrate. The production of fluorescence was linear with time for the incubation period used, and less than 10% of the available substrate was hydrolyzed. Experiments were performed in duplicate. Human OGA was expressed and purified as previously described.14 Purified OGA was spin concentrated to 54 μg/mL, and 2 μL of the enzyme solution was used. Determination of the inhibition constants of each inhibitor for OGA was performed assuming steady-state kinetics in the presence of different concentrations of the inhibitors (0, 0.005, 0.02, and 0.05 μM for 1; and 0.2, 0.4, 0.8, 1.2, 1.6, 2.5, and 3.8 μM for 2 over a range of concentration (20–600 μM) of the substrate 3 in a final volume of 100 μL of the assay buffer (100 mM citrate/phosphate buffer, pH 6.5). The reaction was initiated by adding enzyme to the solution containing both 3 and the inhibitor at 37 °C, and was stopped by adding 900 μL of aq Na2CO3 after a 5 min incubation period. The mode of inhibition was visually verified by Lineweaver–Burk plot (see Fig. 2 in Section 2.2 for 2; see Fig. 3 for 1), and the Ki was determined by fitting all initial reaction velocities to the standard equation for competitive type inhibition by using Enzyme Kinetics Pro software.
3.3. Analyses of inhibition of OGA and Hex A and Hex B by 1 and 2
An extract from Escherichia coli over-expressing OGA (2 μL; 0.02 nM) was added to a solution containing 50 μM of FDGlcNAc (Km = 85 μM) (3) as a substrate in the absence and the presence of 5 μM of the inhibitor (1 or 2) in 100 mM citrate/phosphate buffer, pH 6.5, containing 1 mM GalNAc in a final volume of 100 μL at the start of the incubation at 37 °C. The assay was terminated after 30 min incubation by adding 900 mL of a 0.5 M aq Na2CO3 solution. The assay solution (200 μL) was transferred into a 96-well plate and fluorescence was measured at the excitation wavelength of 485 nm and at the emission wavelength of 535 nm. Percent of inhibition was calculated by comparing enzyme activity in the absence of the inhibitor with the activity in the presence of the inhibitor. Human placental lysosomal hexosaminidase (Hex A, Sigma) assays were performed in the same manner as the O-GlcNAcase assays described except that 1 mM of GalNAc was not present in the assays (Fig. 7, Section 2.4).
3.4. Analyses by western blot of the cellular O-GlcNAc levels in HT-29 and HeLa cells treated without and with the inhibitors 1 and 2
HeLa cells were seeded in a six well culture flask at a density of 1.0 × 10⁵ cells in a 2 mL well and cultured in DMEM (Invitrogen) supplemented with 10% FBS (Invitrogen) in the absence and the presence of 40 μM of each inhibitor (1 or 2) at 37 °C for 2 days. Cultured cells were washed with PBS at pH 7.2, transferred to Eppendorf tubes, and then centrifuged at 2500g for 10 min. The pellets were lysed in 0.1 mL of MPER protein extraction reagent (Pierce) according to the manufacturer’s protocol. HT-29 cells were seeded in a six well culture flask at a density of 1.0 × 10⁵ cells in a 2 mL well and cultured in McCoy’s 5a medium (ATCC) supplemented with 10% FBS (Invitrogen) in the absence and the presence of 40 μM of each inhibitor (1 or 2) at 37 °C for 2 days. Cultured HT-29 cells were washed with PBS at pH 7.2, transferred to Eppendorf tubes, and then centrifuged at 2500g for 10 min. The pellets were suspended in 0.1 mL of lysis buffer containing 20 mM of Tris–HCl buffer, pH 8.0, 1 mM of DTT, 0.1% of Triton X-100, and EDTA-free protease inhibitor cocktail (1 tablet/10 mL). The suspension was incubated at room temperature for 5 min and then was sonicated on ice (4 × 10 s, setting 3, Misonix Ultrasonic Processor). The supernatant obtained after centrifugation at 20,000g for 15 min was stored at −20 °C. The Pierce BCA protein assay reagent was used to estimate protein concentration, with bovine serum albumin as the standard protein. Identical amounts of proteins (20 μg) were transferred to Eppendorf tubes in a volume of 22.5 μL, and then 7.5 μL of 4× NuPAGE® LDS sample buffer (Invitrogen) was added. The protein samples were heated at 80 °C for a 10 min period, loaded onto a 10% NuPAGE pre-cast gel (Invitrogen), subjected to electrophoresis, and then transferred to a nitrocellulose membrane for Western blot analysis. The blot was probed with O-GlcNAc specific antibody RL2 (mouse IgG1, Affinity Bioreagents, Inc.) at 1:1000 dilution and with IR-dye (800 nm)-conjugated goat anti-mouse secondary antibody (Odyssey) at 1:10,000. The blot was imaged according to the manufacturer’s instructions by using the Odyssey Infrared Imaging System (LICOR Biosciences, Lincoln, NE); see Figure 5, Section 2.3).
3.5. Labeling of cell surface GLUT4 in 3T3 adipocytes with biotin by using Bio-ATB-BMPA and semi-quantitative analysis of cell surface GLUT4
3T3-L1 fibroblasts were grown to confluency in a six well culture flask in DMEM–10% FBS, and were differentiated into adipocytes31 with minor modifications. Briefly, two days after confluency (day 0), cells were stimulated with an induction medium of DMEM–10% FBS containing 1 μM of dexamethasone (Sigma), 0.5 mM of isobutylmethylxanthine, and insulin (1 μg/mL, Sigma) for 2 days. Then (day 2), the induction medium was changed to an insulin medium for an additional two days. Two days later (day 4), the medium was changed to 10% FBS/DMEM. Cells were fed with 10% FBS/DMEM every 2 days. Adipocytes were used for experiments 8 days after addition of differentiation factors. 3T3-L1 adipocytes were cultured for 16 h in DMEM containing 4 mM glucose in the absence of serum and containing corresponding 40 μM of inhibitor [1, 2, or 5 (=PUGNAc)] or no inhibitor. After 16 h, cells were re-fed in 10% FBS/DMEM solution; cells were then stimulated with insulin (30 nM) for 20 min except cells in one well that were not stimulated with insulin. The cells were washed with PBS, and then 400 μL of a 250 μM solution of 4,4′-O-[2-[2-[2-[2-[2-(biotinylamino)ethoxy] ethoxy]ethoxy]-4-(1-azi-2,2,2,-trifluoroethyl)benzoyl]amino-1,3-propanediyl]bis-d-mannose [Bio-ATB-BMPA, Toronto Research Chemicals, Inc.] in PBS were added to each well of the culture flask. Cells were irradiated for 30 s five times in a Rayonet photochemical reactor, using 300 nm lamps. Following irradiation, the cells were washed with ice-cold PBS three times, suspended in a homogenization PBS buffer containing 1% Triton X-100 and an EDTA-free protease inhibitor cocktail (1 tablet/10 mL), and then sonicated on ice (4 × 10 s, setting 3, Misonix Ultrasonic Processor). The supernatant was obtained after centrifugation at 20,000g for 30 min. The Pierce BCA protein assay reagent was used to estimate protein concentration by using bovine serum albumin as a standard protein. Identical amounts of proteins (600 μg) were transferred to Eppendorf tubes, and 40 μg of Streptavidin agarose beads was added to isolate biotin-tagged plasma membrane GLUT4. Sample mixtures were incubated with mixing at 4 °C overnight, and then were centrifuged at 3000g for 5 min. The supernatants were discarded and the beads were washed successively with PBS–0.1%SDS and with PBS. The washing buffer was removed, and 20 μL of SDS–PAGE (Invitrogen) sample buffer was added. The final resin samples were heated at 95 °C for 5 min, loaded onto a 10% NuPAGE pre-cast gel (Invitrogen), subjected to electrophoresis, and then transferred to a nitrocellulose membrane for Western blot analysis. The blot was probed with mouse anti-GLUT4 antibody (2 μg/mL, Sigma–Aldrich) and with IR-dye (800 nm)-conjugated goat anti-mouse secondary antibody (Odyssey) at 1:10,000. The blot was imaged by using the Odyssey Infrared Imaging System (LICOR Biosciences, Lincoln, NE) according to the manufacturer’s instruction (see Fig. 6, Section 2.4). In parallel, blots were probed with anti-GAPDH for normalization of integrated values.
3.6. Threaded sequence and structural alignment of human O-GlcNAcase and bacterial OGA
Based on the report of van Aalten and co-workers (Ref. 18), the sequence of human O-GlcNAcase (hOGA) was aligned with that of the family 84-fold member CpNAgJ from Clostridium perfrengens by using both the Align algorithm and adjustment of gap lengths by inspection (Fig. 8).
4. Conclusion
GlcNAc-selenazoline (2) is a close structural analogue of the potent OGA inhibitor GlcNAc-thiazoline (1), differing only in the identity of the respective chalcogen (Se vs S). Despite this similarity, 2 is a weaker inhibitor, with Ki about 70-fold worse. This difference can be attributed to steric demands in the vicinity of the participating substrate carbonyl oxygen in the OGA active site (i.e., the Se containing inhibitor is a poorer fit). Alternatively, a key hydrogen bond between the Tyr219 hydroxyl and the inhibitor may be weaker where the Se atom of 2 is the H-bond acceptor, compared with the S atom of 1. Interestingly, studies on human cell lines indicate that 1 and 2 have similar effects on global Glc-NAc-ylation, a result that can be rationalized by postulating that 2 (the weaker OGA inhibitor) is internalized into cells more easily than 1.
Supplementary Material
Acknowledgments
We are grateful to NIH (SK, AI055760) and the Henry Dreyfus Teacher-Scholar Awards Program (P.R.R.) for partial financial support, UNCF-Merck for a graduate fellowship to E.D., the Canadian Institutes for Health Research and the Natural Science and Engineering Research Council (S.G.W. and B.R.), the Intramural Research Program of the National Institute of Diabetes and Digestive and Kidney Diseases, NIH (J.A.H.), and the National Research Foundation of Korea (EJK, 20090065).
Abbreviations
- O-GlcNAcase
β-N-acetylglucosaminidase
- UDP-GlcNAc
uridine diphosphate N-acetylglucosamine
- Bio-ATB-BMPA
4,4′-O-[2-[2-[2-[2-[2-(biotinylamino)ethoxy]ethoxy]ethoxy]-4-(1-azi-2,2,2,-trifluoroethyl)benzoyl]amino-1,3-propanediyl]bis-d-mannose
- DMEM
Dulbecco’s modified Eagle’s medium
- PBS
phosphate buffered saline
- FBS
fetal bovine serum
- PUGNAc
O-(2-acetamido-2-deoxy-d-glucopyranosylidene)amino-N-phenylcarbamate
Footnotes
Supplementary data Supplementary data (scanned spectra for 2 and coordinates for the calculated structures in Figure 4) associated with this article can be found, in the online version, at doi:10.1016/ j.bmc.2010.08.010.
References and notes
- 1.Love DC, Hanover JA. Science STKE. 2005;312:1. doi: 10.1126/stke.3122005re13. [DOI] [PubMed] [Google Scholar]
- 2.Hanover JA. FASEB J. 2001;15:1865. doi: 10.1096/fj.01-0094rev. [DOI] [PubMed] [Google Scholar]
- 3.Yang X, Zhang F, Kudlow JE. Cell. 2002;110:69. doi: 10.1016/s0092-8674(02)00810-3. [DOI] [PubMed] [Google Scholar]
- 4.Du XL, Edelstein D, Dimmeler S, Ju Q, Sui C, Brownlee MJM. Clin Invest. 2001;108:1341. doi: 10.1172/JCI11235. [DOI] [PMC free article] [PubMed] [Google Scholar]
- 5.Zhang F, Su K, Yang X, Bowe DB, Paterson AJ, Kudlow JE. Cell. 2003;115:715. doi: 10.1016/s0092-8674(03)00974-7. [DOI] [PubMed] [Google Scholar]
- 6.McClain DA, Crook ED. Diabetes. 1997;45:1003. doi: 10.2337/diab.45.8.1003. [DOI] [PubMed] [Google Scholar]
- 7.Griffith FI, Schmitz B. Biochem Biophys Res Commun. 1995;213:424. doi: 10.1006/bbrc.1995.2149. [DOI] [PubMed] [Google Scholar]
- (a) Kuo M, Zilberfarb V, Gangneux N, Christeff N, Issad T. FEBS Lett. 2008;582:829. doi: 10.1016/j.febslet.2008.02.010. [DOI] [PubMed] [Google Scholar]; (b) Kuo M, Zilberfarb V, Gangneux N, Christeff N, Issad T. Biochimie. 2008;90:679. doi: 10.1016/j.biochi.2008.03.005. [DOI] [PubMed] [Google Scholar]; (c) Housley MP, Rodgers JT, Udershi ND, Kelly TJ, Shabanowitz J, Hunt DF, Puigserver P, Hart GW. J Biol Chem. 2008;283:16283. doi: 10.1074/jbc.M802240200. [DOI] [PMC free article] [PubMed] [Google Scholar]
- 9.Reviews: Hanover JA, Krause MW, Love DC. Biochim Biophys Acta. 2010;1800:80. doi: 10.1016/j.bbagen.2009.07.017.Butkinaree C, Park K, Hart GW. Biochim Biophys Acta. 2010;1800:96. doi: 10.1016/j.bbagen.2009.07.018.
- (a) Macauley MS, Whitworth GE, Debowski AW, Chen D, Vocadlo DJ. J Biol Chem. 2005;280:25313. doi: 10.1074/jbc.M413819200. [DOI] [PubMed] [Google Scholar]; (b) Toleman C, Paterson AJ, Kudlow JE. Biochim Biophys Acta. 2006;1760:829. doi: 10.1016/j.bbagen.2006.01.017. [DOI] [PubMed] [Google Scholar]; (c) Kim EJ, Amorelli B, Abdo M, Thomas CJ, Love DC, Knapp S, Hanover JA. J Am Chem Soc. 2007;129:14854. doi: 10.1021/ja076038u. [DOI] [PubMed] [Google Scholar]; (d) Kim EJ, Perreira M, Thomas CJ, Hanover JA. J Am Chem Soc. 2006;128:4234. doi: 10.1021/ja0582915. [DOI] [PubMed] [Google Scholar]; (e) Langley DB, Harty DWS, Jacques NA, Hunter N, Guss JM, Collyer CA. J Mol Biol. 2008;377:104. doi: 10.1016/j.jmb.2007.09.028. [DOI] [PubMed] [Google Scholar]
- (a) Whitworth GE, Macauley MS, Stubbs KA, Dennis RJ, Taylor EJ, Davies GJ, Greig IR, Vocadlo DJ. J Am Chem Soc. 2007;129:635. doi: 10.1021/ja065697o. [DOI] [PubMed] [Google Scholar]; (b) Greig IR, Macauley MS, Williams IH, Vocadlo DJ. J Am Chem Soc. 2009;131:13415. doi: 10.1021/ja904506u. [DOI] [PubMed] [Google Scholar]; (c) He Y, Macauley MS, Stubbs KA, Vocadlo DJ, Davies GJ. J Am Chem Soc. 2010;132:1807. doi: 10.1021/ja9086769. [DOI] [PubMed] [Google Scholar]
- (a) Fitzmaurice JC, Williams DJ, Wood PT, Woollins JD. J Chem Soc Chem Commun. 1988;741 [Google Scholar]; (b) Grossman G, Ohms G, Krüger K, Karaghiosoff K, Eskstein H, Hahn J, Hopp A, Malkina OL, Hrobarik P. Zeitschr Anorg Allg Chem. 2001;627:1269. [Google Scholar]
- 13.Knapp S, Darout E. Org Lett. 2005;7:203. doi: 10.1021/ol047889z. [DOI] [PubMed] [Google Scholar]
- 14.Kim EJ, Kang DO, Love DC, Hanover JA. Carbohydr Res. 2006;341:971. doi: 10.1016/j.carres.2006.03.004. [DOI] [PMC free article] [PubMed] [Google Scholar]
- 15.Amorelli B, Yang C, Rempel B, Withers SG, Knapp S. Bioorg Med Chem Lett. 2008;18:2944. doi: 10.1016/j.bmcl.2008.03.067. [DOI] [PubMed] [Google Scholar]
- 16.Knapp S, Abdo M, Ajayi K, Huhn RA, Emge TJ, Kim EJ, Hanover JA. Org Lett. 2007;9:2321. doi: 10.1021/ol0706814. [DOI] [PubMed] [Google Scholar]
- 17.Knapp S, Fash D, Abdo M, Emge TJ, Rablen PR. Bioorg Med Chem. 2009;17:1831. doi: 10.1016/j.bmc.2009.01.066. [DOI] [PubMed] [Google Scholar]
- 18.Rao FV, Dorfmueller HC, Villa F, Allwood M, Eggleston IM, van Aalten DMF. EMBO J. 2006;25:1569. doi: 10.1038/sj.emboj.7601026. [DOI] [PMC free article] [PubMed] [Google Scholar]; Dennis RJ, Taylor EJ, Macauley MS, Stubbs KA, Turkenburg JP, Hart SJ, Black GN, Vocadlo DJ, Davies GJ. Nat Struct Mol Biol. 2006;13:365. doi: 10.1038/nsmb1079. [DOI] [PubMed] [Google Scholar]
- 19.Moroder L. J Peptide Sci. 2005;11:187. doi: 10.1002/psc.654. [DOI] [PubMed] [Google Scholar]
- 20.Respective Rf’s for 1 and 2 are 0.29 and 0.35 (silica, 4:1 dichloromethane/methanol).
- 21.Substitution of Se for S in a bioactive heterocycle can enhance efficacy in cells: Mugesh G, du Mont W-W, Sies H. Chem Rev. 2001;101:2125. doi: 10.1021/cr000426w.Goudgaon NM, Naguib FNM, el Kouni MH, Schinazi RF. J Med Chem. 1993;36:4250. doi: 10.1021/jm00078a015.Gharehbaghi K, Sreenath A, Hao Z, Paull KD, Szekeres T, Cooney DA, Krohn K, Jayaram HN. Biochem Pharmacol. 1994;48:1413. doi: 10.1016/0006-2952(94)90565-7.Franchetti P, Cappellacci L, Sheika GA, Jayaram HN, Gurudutt VV, Sint S, Schneider BP, Jones WD, Goldstein BM, Perra G, De Montis A, Loi AG, La Colla P, Grifantini M. J Med Chem. 1997;40:1731. doi: 10.1021/jm960864o.Desai D, Madhunapantula SV, Gowdahalli K, Sharma A, Chandagaludoreswamy R, El-Bayoumy K, Robertson GP, Amin S. Bioorg Med Chem Lett. 2010;20:2038. doi: 10.1016/j.bmcl.2009.09.071. See also Emmert SW, Desai D, Amin S, Richie JP., Jr Bioorg Med Chem Lett. 2010;20:2675. doi: 10.1016/j.bmcl.2010.01.044.
- 22.Mueckler M. Eur J Biochem. 1994;219:713. doi: 10.1111/j.1432-1033.1994.tb18550.x. [DOI] [PubMed] [Google Scholar]
- 23.Bryant NJ, Govers R, James DE. Nat Rev Mol Cell Biol. 2002;3:267. doi: 10.1038/nrm782. [DOI] [PubMed] [Google Scholar]
- 24.Cushman SW, Wardzala LJ. J Biol Chem. 1980;255:4758. [PubMed] [Google Scholar]
- 25.Lee W, Ryu J, Spangler RA, Jung CY. Biochemistry. 2000;39:9358. doi: 10.1021/bi0007021. [DOI] [PubMed] [Google Scholar]
- 26.Park SY, Ryu J, Lee W. Exp Mol Med. 2005;37:220. doi: 10.1038/emm.2005.30. [DOI] [PubMed] [Google Scholar]
- 27.Koumanov F, Yang J, Jones AE, Hatanaka Y, Holman GD. Biochem J. 1998;330:1209. doi: 10.1042/bj3301209. [DOI] [PMC free article] [PubMed] [Google Scholar]
- 28.Macauley MS, Bubb AK, Martinez-Fleites C, Davies GJ, Vocadlo DJ. J Biol Chem. 2008;283:34687. doi: 10.1074/jbc.M804525200. [DOI] [PMC free article] [PubMed] [Google Scholar]
- 29.McClain DA, Lubas WA, Cooksey RC, Hazel M, Parker GJ, Love DC, Hanover JA. Proc Natl Acad Sci USA. 2002;99:10695. doi: 10.1073/pnas.152346899. [DOI] [PMC free article] [PubMed] [Google Scholar]
- 30.Yang X, Ongusaha PP, Miles PD, Havstad JC, Zhang F, So WV, Kudlow JE, Michell RH, Olefsky JM, Field SJ, Evans RM. Nature. 2008;451:964. doi: 10.1038/nature06668. [DOI] [PubMed] [Google Scholar]; Dentin R, Hedrick S, Xie J, Yates J, III, Montiminy M. Science. 2008;319:1402. doi: 10.1126/science.1151363. [DOI] [PubMed] [Google Scholar]
- 31.Student AK, Hsu RY, Lane MD. J Biol Chem. 1980;255:4745. [PubMed] [Google Scholar]
Associated Data
This section collects any data citations, data availability statements, or supplementary materials included in this article.