

Abstract
Objective:
The present study aimed to investigate the probable differences in cell proliferation index of odontogenic cysts and tumors by means of a comparative silver stained nucleolar organizing region (AgNOR) quantification.
Study Design:
This descriptive cross-sectional study was done on archival paraffin blocks (n = 62), consisting of 10 odontogenic keratocysts, 10 dentigerous cysts, 10 radicular cysts, 10 conventional ameloblastomas, 10 adenomatoid odontogenic tumors, 10 calcifying epithelial odontogenic tumors and 2 ameloblasic carcinomas.
Results:
The mean AgNOR count of odontogenic cysts was 1.709 and the benign odontogenic tumors was 1.862. Highest AgNOR count was recorded in odontogenic keratocyst and lowest was seen in radicular cyst. Statistically significant difference in AgNOR counts of ameloblastoma and adenomatoid odontogenic tumor, amelobalastoma and calcifying epithelial odontogenic tumor, benign odontogenic tumors and ameloblastic carcinoma were seen. AgNORs in ameloblastic carcinoma were more in number and more widely spread.
Conclusion:
AgNOR technique may be considered a good indicator of cell proliferation in odontogenic cysts and tumors.
Keywords: Odontogenic cysts, odontogenic tumors, silver stained nucleolar organizing region
INTRODUCTION
Odontogenic cysts and tumors are diverse groups of lesions derived from odontogenic tissues.[1] Clinical behavior of these lesions varies widely, ranging from benign to malignant with differences in recurrence rate and growth pattern.
Interest has been focused on seeking reliable guide for prognosis, by measuring cell proliferation and correlating this data with the potential for metastasis and recurrence. One of the methods of measuring the proliferation rate of a given cell is silver stained nucleolar organizing region (AgNOR) technique, which demonstrates the nucleolar organizer region (NOR) associated proteins.
Nucleolar organizer regions are loops of DNA that codify the ribosomal RNA and are considered important for protein synthesis.[2] The transcriptional activity of the NORs is associated with non-histonic proteins, which are selectively marked by silver ions. The technique used to visualize the NORs is simple and can be performed in samples processed by routine methods. The NORs stained by silver are named argyrophilic nucleolar organizer regions–AgNORs. It has been consistently shown that AgNOR quantification represents a valuable parameter of cell kinetics and therefore cell proliferation.[3]
The aim of our study was to investigate the probable differences in the cell proliferation index in odontogenic cysts and tumors by means of a comparative AgNOR quantification.
MATERIALS AND METHODS
A retrospective study of 62 cases of odontogenic cysts and tumors (10 cases of each variety as outlined in Table 1 and two cases of ameloblatic carcinoma) was carried out in the Department of Oral Pathology and Microbiology. All cases had been fixed in 10% formalin, routinely processed and embedded in paraffin wax. Using hematoxylin and eosin-stained sections, the histopathological diagnosis of each case was reviewed and the quality of the material was checked [Figures 1 and 2].
Table 1.
Mean AgNOR count in odontogenic cysts and tumors

Figure 1.

Photomicrograph showing odontogenic tumor cells arranged in follicles with peripheral tall columnar cells (H&E ×10)
Figure 2.
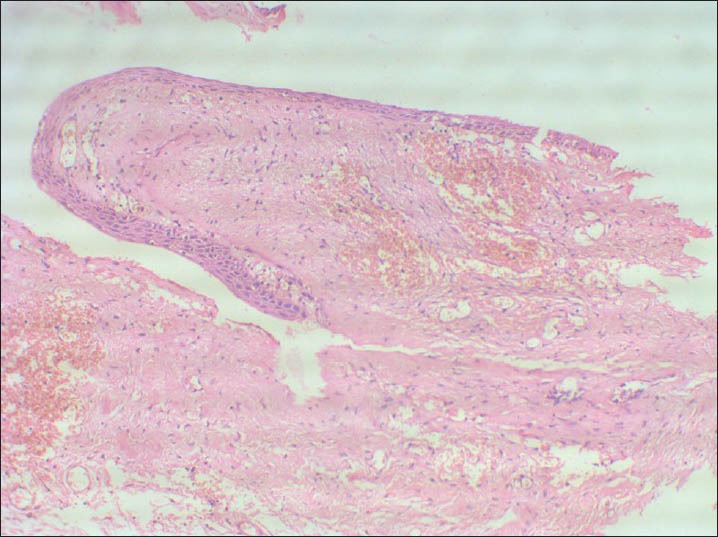
Photomicrograph showing odontogenic cystic lining with a supporting connective tissue wall (Dentigerous cyst, H&E, ×10)
AgNORs histochemical technique
Another section of each block was stained with AgNOR technique according to Ploton et al.[4] The working solution was prepared as follows: 50% silver nitrate solution –2 parts and gelatin solution (gelatin 2 g, formic acid 1ml, distilled water 100 ml) –1 part. The two solutions were mixed before use. The dewaxed sections were hydrated and rinsed in distilled water. The slides were then incubated in freshly prepared working solution for 45 minutes at room temperature, followed by rinsing in distilled water for one minute, dehydrated, cleared and mounted in DPX.
AgNOR's were evaluated under × 100 oil immersion. A green chromatin filter was used to cut down the visualization of background staining. AgNOR dot appeared as brownish black dots within the brown stained nucleus on a pale yellow back ground. Closely aggregated dots were counted and recorded as separate dots. The AgNOR count in 100 cells was done to get the mean number of NORs per nucleus [Figures 3 and 4].
Figure 3.

Photomicrograph showing AgNor positivity in the nucleus of Ameloblastoma (IHC ×200)
Figure 4.

Photomicrograph showing AgNor positivity in the nucleus of Dentigerous cyst (IHC ×100)
Statistical analysis
All the analysis was done using Statistical Package for the Social Sciences software (SPSS version 14.0). A P < 0.05 was considered statistically significant. Student's t test was used to compare the mean AgNOR between the groups.
RESULTS
The mean AgNOR count of odontogenic cysts was 1.709 and for benign odontogenic tumors was 1.8628. Mean AgNOR count of odontogenic keratocyst was highest among the cysts studied (1.905 ± 0.2892) followed by dentigerous cyst (1.565 ± 0.0919) and radicular cyst (1.51 ± 0.1044). No significant difference was found between developmental odontogenic cyst and inflammatory odontogenic cyst (P > 0.05) [Table 2]. No significant difference was found between the benign odontogenic tumors and odontogenic cysts, though the mean AgNOR count of odontogenic tumors was slightly higher (P > 0.05) [Table 3]. Significant difference was found between the malignant odontogenic tumor (ameloblastic carcinoma) and other benign odontogenic tumors (P < 0.01) indicating a highly significant value [Table 4]. Ameloblastoma when compared with AOT and CEOT, showed a highly significant difference between these two tumors (P < 0.01) [Table 5].
Table 2.
Comparision of AgNOR count between inflammatory odontogenic cysts and developmental odontogenic cysts

Table 3.
Mean AgNOR count, standard deviation and ‘P’ value of odontogenic cysts and benign odontogenic tumors

Table 4.
Mean AgNOR count, standard deviation ‘t’ and ‘P’ values between malignant and benign odontogenic tumors

Table 5.
Mean AgNOR count, standard deviation, ‘P’ and ‘t’ values between ameloblastomas, calcifying epithelial odontogenic tumor and adenomatoid odontogenic tumor

DISCUSSION
Quantitative and qualitative changes of NORs can imply the degree of cell nucleolar activity in hyperplastic and neoplastic conditions.[5] Actively proliferating cells have impaired nucleolar association and, therefore, exhibit a higher AgNOR count, regardless of the ploidy state of the cell.[6] Recent histopathologic studies of NORs have resulted in successful diagnosis, categorization and prognostication of various benign and malignant lesions.[7,8,9,10,11] Counting, is the most widely used method for evaluating AgNORs because of technique simplicity and reproducibility.[12]
The mean AgNOR count of the odontogenic cysts is 1.709 and of benign odontogenic tumors is 1.862. Though no statistical significant difference is noted, higher AgNOR counts were seen in odontogenic tumors. It can be speculated that rise in AgNOR material denotes a rise in protein synthesis and this activity in odontogenic tumors would contribute in part to the growth pattern of this neoplasm.
Previous studies showed significant differences in the number of AgNORs between dentigerous and residual cysts;[13] dentigerous and radicular cyst;[5] and odontogenic keratocyst and radicular cyst.[5] In the present study, highest AgNOR count was recorded in odontogenic keratocyst and lowest in radicular cyst. Correlating the previous studies and the findings of the present study, the proliferative index of developmental odontogenic keratocyst is related to its aggressive clinical behavior. Inflammation in the radicular cysts destroys the epithelial cells leading to the lower AgNOR counts.
Do Carmo and Silva[14] found a significant difference in the number of AgNORs between adenomatoid odontogenic tumor and follicular ameloblastoma, adenomatoid odontogenic tumor and primary ameloblastoma with recurrence. Adenomatoid odontogenic tumor showed no significant difference in the number of NORs in a comparison with acanthomatous ameloblastoma, plexiform ameloblastoma, primary ameloblastoma without recurrence and recurrent ameloblastoma. Their results discounted a relationship between the clinical behavior of adenomatoid odontogenic tumor and ameloblastoma and their cell proliferation indices. However, in the present study, we found a significant difference in AgNOR counts of ameloblastoma and adenomatoid odontogenic tumor, reinforcing the known aggressive behavior of ameloblastoma. This disagreement with the previous study could be explained, as we did not attempt to classify conventional ameloblastoma into its histological subtypes.
Comparision of AgNOR counts in ameloblastoma and calcifying epithelial odontogenic tumor was not previously reported in the literature. In the present study, we found statistically significant difference in the mean AgNOR count of these two tumors. These findings suggest that the proliferative and neoplastic characteristic features are higher in ameloblastoma when compared with calcifying epithelial odontogenic tumor.
Rosa et al.[15] found higher number of AgNORs in basal cell carcinoma than in ameloblastoma. AgNORs in basal cell carcinoma were smaller, more numerous and more widespread than in ameloblastoma, which could be anticipated considering the higher degree of cellular proliferation in basal cell carcinoma. In the present study, we found significant difference in the AgNOR counts in benign odontogenic tumors and ameloblastic carcinoma. AgNORs in almeloblastic carcinoma were more in number and more widely spread.
In conclusion, the different clinical behaviors between these lesions with regard to their infiltrative ability are probably related to the proliferative index of their tumor cells. AgNOR technique may be considered a good indicator of cell proliferation, but should not be regarded as a definitive or unique method.
Footnotes
Source of Support: Nil.
Conflict of Interest: None declared.
REFERENCES
- 1.Neville BW, Damm DD, Allen CM, Bouquot JE. Mucosal squamous cell carcinoma. In: Bywaters Lisa C., editor. Oral and Maxillofacial Pathology. 2nd ed. Philadelphia, pennsylvania: Saunders company Ltd; 2005. [Google Scholar]
- 2.Comai L. The nucleolus: A paradigm for cell proliferation and aging. Braz J Med Biol Res. 1999;32:1473–8. doi: 10.1590/s0100-879x1999001200004. [DOI] [PubMed] [Google Scholar]
- 3.Sirri V, Roussel P, Hernandez-Verdun D. The AgNOR proteins: Qualitative and quantitative changes during the cell cycle. Micron. 2000;31:121–6. doi: 10.1016/s0968-4328(99)00068-2. [DOI] [PubMed] [Google Scholar]
- 4.Ploton D, Menager M, Jeannesson P, Himber G, Piegeon F, Adnet JJ. Improvement in the staining and visualization of the argyrophilic proteins of the nucleolar organizer regions at the optical level. Histochem J. 1986;18:5–14. doi: 10.1007/BF01676192. [DOI] [PubMed] [Google Scholar]
- 5.Allison RT, Spencer S. Nucleolar organizer regions in odontogenic cysts and ameloblastomas. Br J Biomed Sci. 1993;50:309–12. [PubMed] [Google Scholar]
- 6.Giri DD, Nottingham JF, Lawry J, Dundas SA, Underwood JC. Silver-binding nucleolar organizer regions (AgNORs) in benign and malignant breast lesions: Correlation with ploidy and growth phase by DNA flow cytometry. J Pathol. 1989;157:307–13. doi: 10.1002/path.1711570407. [DOI] [PubMed] [Google Scholar]
- 7.Cabrini RL, Schwint AE, Mendez A, Femopase F, Lanfranchi H, Itoiz ME. Morphometric study of nucleolar organizer regions in human normal oral mucosa, papilloma and squamous cell carcinoma. J Oral Pathol Med. 1992;21:275–9. doi: 10.1111/j.1600-0714.1992.tb01010.x. [DOI] [PubMed] [Google Scholar]
- 8.Chomette GP, Auriol MM, Labrousse F, Vaillant JM. Mucoepidermoidtumours of salivary glands: Histopathologic view of NORs stained with AgNOR technique. J Oral Pathol Med. 1991;20:130–2. doi: 10.1111/j.1600-0714.1991.tb00906.x. [DOI] [PubMed] [Google Scholar]
- 9.van Heerden WF, Raubenheimer EJ. Evaluation of the nucleolar region associated proteins in minor salivary gland tumours. J Oral Pathol Med. 1991;20:291–5. doi: 10.1111/j.1600-0714.1991.tb00930.x. [DOI] [PubMed] [Google Scholar]
- 10.Khanna AK, Ansari MA, Kumar M, Khanna A. Correlation between AgNOR count and subjective AgNOR pattern assessment score in cytology and histology of breast lumps. Anal Quant Cytol Histol. 2001;23:388–94. [PubMed] [Google Scholar]
- 11.Tuccari G, Abbona GC, Guiffre G, Papotti M, Gasparri G, Barresi G, et al. AgNOR quantity as a prognostic tool in hyperplastic and neoplastic parathyroid glands. Virchows Arch. 2000;437:298–303. doi: 10.1007/s004280000228. [DOI] [PubMed] [Google Scholar]
- 12.Sano K, Takahashi H, Fujita S, Inokuchi T, Pe MB, Okabe H, et al. Prognostic implication of silver-binding nucleolar organizer regions (AgNORs) in oral squamous cell carcinoma. J Oral Pathol Med. 1991;20:53–6. doi: 10.1111/j.1600-0714.1991.tb00889.x. [DOI] [PubMed] [Google Scholar]
- 13.Coleman HG, Altini M, Groeneveld HT. Nucleolar organizer regions (AgNORs) in odontogenic cysts and ameloblastomas. J Oral Pathol Med. 1996;25:436–40. doi: 10.1111/j.1600-0714.1996.tb00293.x. [DOI] [PubMed] [Google Scholar]
- 14.Do Carmo MA, Silva EC. Argyrophilic nucleolar organizer regions in ameloblastomas and adenomatoid odontogenic tumour (AOTs) J Oral Pathol Med. 1998;27:153–6. doi: 10.1111/j.1600-0714.1998.tb01932.x. [DOI] [PubMed] [Google Scholar]
- 15.Rosa LE, Jaeger MM, Jaeger RG. Morphometric study of nucleolar organizer regions in ameloblastoma and basal cell carcinoma. Oral Oncol. 1997;33:209–14. doi: 10.1016/s0964-1955(96)00070-x. [DOI] [PubMed] [Google Scholar]