

Abstract
Influenza virus infections represent a serious public health problem worldwide, due to the rapid emergence of drug resistance. One strategy to improve treatment efficacy is to combine drugs that act synergistically. Potentially useful drug combinations are typically identified through empirical testing using in vitro and animal models, but the complexity of the clinical situation warrants the use of more careful analysis and sophisticated approaches. To explore new approaches, we constructed a mechanistic model representing the interaction of antiviral drugs with the viral replication pathway and human immune responses. Simulation of combination therapy using oseltamivir and amantadine predicted significant therapeutic synergy only when immune response was included, in agreement with previous in vitro and in vivo studies using amantadine-resistant strains. Our model can be used to predict the optimal doses for combination therapy, and also raises questions about current drug evaluation methods that do not account for immune system interactions.
Influenza is a highly contagious respiratory disease caused by influenza virus infection. Each year, seasonal influenza virus results in an estimated 500,000 deaths worldwide,1 with 36,000 in the United States alone.2 Currently, there are two classes of anti-influenza drugs approved for the treatment of influenza, the M2 channel inhibitors (aminoadamantanes: amantadine and rimantadine) and the neuraminidase inhibitors (oseltamivir and zanamivir). Mechanistically, these drugs target different steps in the virus life cycle within the host. Aminoadamantanes inhibit M2-mediated H+ transfer into the virion interior, which is necessary for the dissociation and nuclear translocation of the viral ribonucleo-protein complex for viral replication.3 Neuraminidase inhibitors block neuraminidase-mediated cleavage of the link between hemagglutinin and sialic acid on the surface of the host cell, which is essential for releasing new viral particles.4 When used to treat susceptible influenza strains, these drugs are effective in reducing symptoms and controlling virus replication and shedding.5,6 However, the effectiveness of these drugs as monotherapies has been greatly compromised by the rapid emergence of resistant virus strains. In 2009, the Centers for Disease Control and Prevention reported that 100% of the seasonal H3N2 virus isolated were resistant to the adamantanes, and 99.6% of the seasonal H1N1 viruses tested were resistant to oseltamivir.7 Moreover, in severely immune-compromised patients, double resistant strains (resistant to both M2 inhibitors and neuraminidase inhibitors) have been isolated.8
One way to improve the therapeutic management of resistant viruses is to use drug combinations. Previous experience in treating human immunodeficiency virus has shown that the multidrug approach of highly active antiretroviral therapy is much more effective than monotherapy.9 The fact that aminoadamantanes and neuraminidase inhibitors target different steps of the viral life cycle suggests they may have synergistic effects, which could allow a desired effect to be achieved with a lower total dose.10 A number of studies have been conducted to test this idea in vitro7,11 or in animals.12 However, these studies either do not consider the complex systemic immune response to viral infection, or are confounded by significant differences between human and animals immune systems.13 In humans, aside from few studies in immune-compromised patients (NCT00979251; NCT00867139), no clinical trials have been successfully completed to study the degree of synergy between these two classes of antiviral drugs in the general population, probably due to the high cost of clinical trials, ethical and safety concerns, and the rapid rate of virus mutation.
Mathematical models and computer simulations have long proven to be useful tools in studying viral infections and evaluating therapeutic options, for example, in predicting drug combination effects for hepatitis C virus.14 Influenza virus infection has been extensively modeled, but most of the models ignore the immune responses that occur in the intact human system.15 These models are called “target-cell depletion” or “target-cell limited” models, because in these systems influenza virus infection is limited by the availability of susceptible target cells, and the viral titer will decrease only after nearly all target cells are depleted (infected). In reality, the extent of viral infection is impacted by responses of both the innate and adaptive immune systems. Innate immune responses are triggered shortly after influenza virus infection and provide the first line of defense by secreting various cytokines such as interferons (IFNs), particularly of type I (IFN-α/β); adaptive immune responses develop more slowly but provide virus-specific cytotoxic T cells and neutralizing antibodies. Although a limited number of computational models have attempted to incorporate these important in vivo mechanisms, they use nonhuman systems as a template,1,16,17 or only incorporate theoretical human immune responses without experimental validation.18 To our best knowledge, no simulations have been published that integrate data on antiviral drug action with experimentally validated human immune responses to study disease progression and drug effects in human.
Here, we developed a comprehensive computer model that incorporates the life cycle of influenza A virus (IAV) and immune responses in humans. The model was developed using a modular approach. Pharmacokinetic (PK) modules were generated and linked to a mechanistic model of the pathways involved in the IAV life cycle and immune responses in humans to evaluate the therapeutic effects of amantadine (AMT) and oseltamivir phosphate (OP) alone and in combination. The simulation of AMT and OP administered as a drug combination in this model indicates a significant synergism against wild-type IAV and resistant strains only in the presence of immune response, consistent with previous in vitro and in vivo studies. These results support the importance of considering immune responses when evaluating antiviral drug effects in both in vitro cell culture systems and in silico target-cell depletion models and suggest failing to do so might miss or underestimate possible treatment synergies.
Results
Model architecture
The goal of the study was to develop a mechanistic computer model of antiviral drug action that incorporated drug pharmacokinetics and distribution, drug pharmacology and disease mechanisms, including immune response. To manage the complexity of model development, the full-system model was decomposed into smaller, more manageable subsystems, or modules, each representing a distinct biological or pharmacological process. This approach allowed us to populate and parameterize each individual module efficiently and, more importantly, to test the performance and importance of each subsystem by detaching the corresponding module from the whole model. The modular structure of the complete model is shown in Figure 1. The two PK modules describe the pharmacokinetics of AMT and OP taken orally; the virus life cycle module simulates the infection and replication of IAV in different subpopulations of lung epithelial cells; and the two immune response modules recapitulate the innate and adaptive immune responses in the lung and lymphatic compartments. The entire system is described by a series of delay differential equations (Supplementary Tables S1–S3 online).
Figure 1.

Modular structure of the full mechanistic model. The full model is comprised of five individual modules (in italics). Only the details of the virus life cycle module are shown. AMT, amantadine; APC, antigen presenting cells; E1, healthy uninfected epithelial cells; E2, refractory epithelial cells; E3, epithelial cells with influenza A virus (IAV) particles; E4, epithelial cells with replicated IAV; IFNA1, interferon-α1; IM, immune response module; OC, oseltamivir carboxylate; OP, oseltamivir phosphate; M2, M2 channel; NA, neuraminidase. Where possible, reaction arrows are labeled with parameters as found in Supplementary Tables S1 and S2 online.
Pharmacokinetic modules
The absorption, distribution, metabolism, and elimination of OP19,20,21 and AMT22,23,24 have been well characterized. Similar to previously published models, a simple one-compartment model with first-order absorption/conversion/elimination was used for the OP prodrug and the OP metabolites. Model parameters were calibrated based on multiple studies in diverse age and ethnic groups and whenever possible represent the biological and pharmacological processes for an “average” person (Figure 2). The OP PK module is connected to the system model through an inhibitory link to the release step of the viral life module, while the AMT PK module is linked through the replication step (Figure 1). Since no pharmacokinetic drug–drug interactions have been observed between the two drugs,25 there is no direct interaction between the two PK modules.
Figure 2.

Fitting of the pharmacokinetics (PK) modules for oseltamivir phosphate (OP) and amantadine (AMT). The PK modules for OP (a) and AMT (b) were parameterized based on a series of PK studies with single or multiple doses. In all plots, solid lines are best fits of the model and circles are measurements. (a) Left: Plasma OP and oseltamivir carboxylate (OC) concentrations of the oseltamivir loading (OL) group (150 + 75 mg) of a multidose study in Thai subjects20; right: a 150-mg single-dose study in Japanese and Caucasian subjects.48 (b) Left: AMT plasma concentrations in the 100-mg once-daily group of a multidose study5; right: plasma concentration averaged between young and elderly subjects in a 200-mg single-dose study.49
Immune responses in the lung and lymphatic compartment
As a key factor in innate immunity, IFN-α (IFNA1) is rapidly induced after IAV infection26 and acts to not only eliminate infected cells through natural killer cell activation,27,28 but also to induce an antiviral state in surrounding cells.29 In the model, we assumed the infected cell-killing activity by natural killer cells and other factors is proportional to the level of IFN-α, and use inhibitory links between IFNA1 and infected epithelial cells (Figure 1, E3 and E4) to represent this immune response (Figure 1). The ability of IFN to protect uninfected cells is represented by a link inducing refractory state from healthy epithelial cells (Figure 1, E1 and E2).
The virus-specific adaptive immune response is initiated shortly after IAV infection30 but may take up to 5 days to have an effect.31,32 As shown in the model structure, virus infection of antigen presenting cells (APC) in the lung compartment activates APCs, which then carry the virus-specific antigen to the lymphatic compartment to turn naive CD8+ T cells into virus-specific cytotoxic T lymphocytes. Cytotoxic T lymphocytes then migrate back to the lung compartment and kill infected epithelial cells (Figure 1). It should be noted that certain aspects of the adaptive immune responses are not explicitly included in the model. For instance, APCs, mainly dendritic cells in the case of IAV infection,33 can also activate naive CD4+ T cells and B cells in the lymphatic compartment, which then, among other functions, initiate antibody generation. However, IAV-specific antibody titers do not reach a significant level until at least 10 days postinfection,16 while in a typical infection shedding virus can only be detected during the first 7 days,15 which is the time frame of interest for this simulation. For the same reason, cellular regeneration of the epithelium, which takes up to 1 month and has proven to have little effect on modeling outputs,18 is not included. In addition, APCs migrated from the lung to the lymphatic compartment can transfer viral antigens to local resident dendritic cells, which are responsible for activating CD8+ T cells at later time points postinfection.30 These complex processes are implicitly subsumed underneath equation describing APC maturation in the lymphatic compartment in the model (Supplementary Table S1 online).
To fit the immune modules, data were used from a human study in which nasal lavage fluid viral titers and cytokines levels were measured simultaneously.26 The simulated time courses of viral titers and IFN-α fit the experimental data well (Figure 3a,b). The IFN-α (IFNA1) profile has a rapid major peak at around 48 h postinfection, followed by a minor elevation at around 100 h. When plotted together (Figure 3c), the first major peak of IFN-α is superimposed perfectly with that of infected APCs, the known primary source of type I IFNs after IAV infection in human34,35; while the second, small elevation of IFN-α coincides with the migration of cytotoxic T lymphocytes from the lymphatic to the lung compartment, consistent with the findings that activated T cells promote the release of IFN-α from APCs.36 This suggests that the current model, even though it is in some respects a simplification of the complex in vivo system, captures the essential interplay between the immune systems and viral life cycle.
Figure 3.

Model simulation of the immune responses after infection. (a) Best fits of viral titers (upper panel) and interferon (IFN)-α (IFNA1) changes (bottom panel) after infection. Solid lines are model best fits while circles are experimental values.26 (b) Model simulation describes the dynamics of innate and adaptive immune responses. The population of infected antigen presenting cells (APCs) (dashed line) reach the highest point 48 h postinfection. Because infected APCs are the major source of secreted IFN-α in the beginning, the dashed curve is superimposed perfectly with the first peak of the solid curve (IFN-α/IFNA1). The second, minor peak of IFN-α (IFNA1) coincides with the migration of cytotoxic T cells (dash-dotted curve) to lung. TCID50, 50% tissue culture infection dose.
Simulation of monotherapy
The model was calibrated by fitting its output to two published clinical trials using OP6 and AMT.37 Because models without immune systems (target-cell depletion models) are still widely used to study the process of IAV infection,15 a side-by-side comparison was made between the full model (+IM model) and a version that lacked the immune system modules (−IM model). As shown in Figure 4, both +IM and −IM models fit the dose-dependent decline of viral titers after oral treatment of OP (a) or AMT (b) equally well. However, a key difference emerges when the mechanisms of the drug effects are plotted. The −IM model is a typical target-cell depletion model: the virus titer keeps climbing until the vast majority of target cells have been infected and nearly no healthy cells remain, as depicted by the fraction of uninfected epithelial cells in Figure 4c (left panel, dashed line). While nearly 100% infection rate is achievable in vitro,7 numerous studies using different species including ferrets,38 horses,1 and humans39 indicate that only a tiny fraction of epithelial cells are infected by IAV while the vast majority of target cells are intact throughout the virus life cycle in vivo. The +IM model is able to recapitulate this phenomenon (Figure 4c, right panel, dashed line), suggesting that this model, in comparison to widely used models without immune systems, is one step closer to describing the in vivo progress of diseases.
Figure 4.

Comparison of model simulations of monotherapy with or without immune modules. Side-by-side comparison of the model without (−IM) and with (+IM) immune modules. Circles are experimental measurements (E) while solid lines are best fits (S) (S). (a) Best fits of viral titers after treatment6 with placebo, OP 75 mg twice daily, and OP 150 mg twice daily. (b) Best fits of viral titers after treatment37 with placebo or AMT 150 mg twice daily. (c) Simulated time course of viral titers (solid lines) or fraction of uninfected target cells (dashed lines) after influenza A infection. Note that the y-axes for viral titers are on the left while the y-axes for the uninfected fraction are on the right side of the plots. AMT, amantadine; OP, oseltamivir phosphate; TCID50, 50% tissue culture infection dose.
Simulation of combination therapy
The calibrated monotherapy model was then used to simulate the effects of administering OP and AMT together and the results were compared after either including (+IM model) or ignoring (−IM model) immune systems responses. For each drug, 10 different dosing regimens were used with twice daily dosing from 0 (placebo) to 100 mg (close to the normal clinical dose). Double combinations from these regimens gave a total of 100 drug combination scenarios. For each of the 100 dose combinations, a synergy (S) value was calculated by subtracting the theoretical additive inhibition from the simulated inhibition (see Methods for details). The degree of synergy is defined by an S value greater than (synergistic), close to (additive), or less than (antagonistic) zero. The relationship between S value and dose combination is shown as contour plots (Figure 5a). The −IM model predicts that OP and AMT have certain degree of synergy across multiple dose combinations, consistent with experimental findings from in vitro cell cultures.11 In contrast, the +IM model predicted a much stronger synergy across a wider range of dose combinations, probably due to the presence of additional feedback loops between the target steps of the two drugs via the immune system.
Figure 5.

Comparison of model prediction of drug synergy with or without immune systems. Side-by-side comparison of the predicted synergy (S) between oseltamivir phosphate (OP) and amantadine (AMT) by models without (−IM) or with (+IM) immune systems. x-Axis is the dose of OP used in the combination; y-axis is the dose of AMT used. For each dose combinations, S is predicted and its value is color coded. The color map is shown to the right. Four types of influenza A virus (IAV) strains are simulated: wild type (a), AMT resistant (b), OP resistant (c), and double resistant (d). For all IAV strains, the +IM model predicts a greater degree of synergy across most dose combinations compared to the −IM model.
The models were then used to determine whether the drug combination would have synergistic effects against a mutant virus resistant to one or both of the two drugs. Drug-resistant IAV was modeled by increasing the in vivo IC50 values for each drug and expanding the dose range to maximum 400 mg, given that higher doses may be needed under these conditions.40 As shown in Figure 5b–d, drug combinations demonstrated diminished synergy against resistant virus strains, in line with in vitro experiments.7 However, the +IM model still predicted a significant synergy between OP and AMT at high doses, even against the virus strain that is resistant to both drugs when used alone. Interestingly, an AMT-resistant strain 2009 A/H1N1 (A/California/04/09) had been used to probe the synergy between AMT and OP in both in vitro and in vivo studies. While the in vitro assay reported no synergy between the two drugs,7 the in vivo mouse study showed some degree of synergy:41 reanalyzing the mouse data, we calculated an S value of 30 and 3.22 respectively, using either the mortality or maximum weight loss as a metric. Even though the difference in species (ours is a human model) and selection of metric (we used viral titer decrease) prohibits direct comparison of synergy quantitatively, the mouse data is in line with our prediction that AMT/OP combination has synergy against AMT-resistant viruses (Figure 5b). Notably, in all cases, the synergy predicted by +IM model is significantly higher than the −IM model. This not only argues for a multidrug approach for influenza, but also raises a possibility that current methods for evaluating drug combination effects, either in silico −IM models or in vitro cell culture assays, may have underestimated the potential synergy of anti-influenza drugs by failing to consider the contribution of immune response.
Discussion
A mechanistic model incorporating both innate and adaptive immune responses in humans has been developed and used to predict potential therapeutic benefits of using antiviral drugs in combination. To organize and simplify model development and enable reuse, a modular approach was adopted to decompose the whole system into smaller modules. This approach greatly facilitates constructing and navigating the full system level model. More importantly, the individual modules can be reconnected to form model variants or reused in new models, making this an attractive strategy for systems pharmacology modeling.
Equally important is the estimation of parameters for these relatively large-scale systems. To estimate the typical set of parameters for an “average” subject, and to integrate various mechanistic details into a network, such models usually need to be calibrated based on a diverse set of studies. This and the size of the models make parameter fitting a daunting job. Traditional parameter estimation methods (e.g., nonlinear regression) were found to be inadequate for determining the best fit. Others have reported that even for a much simpler target-cell depletion model, traditional parameter estimation methods suffer from local optimum and are too sensitive to initial guesses.18 A computational method GAPSM (see Methods) was therefore developed specifically for parameter estimation in relatively large-scale systems, which is more efficient to find a global best fit while constraining the parameters within physiologically plausible ranges. Using this method, our models were fitted reasonably well to the various experimental measurements.
Two versions of the model were built: a full version (+IM) with all the modules including immune responses, and a simpler version (−IM) leaving out immune responses in the lung and lymphatic compartment. The +IM model uses IFN-α as a surrogate to represent the innate immunity, and considers only the cell-mediated adaptive immunity. Many details of the immune responses, such as the effects of other cytokines, antigen cross-presentation, humoral immune responses, interplay between IFN-α and cytotoxic T lymphocytes, and immune memory were either ignored or implicitly contained within some lumped parameters. However, this simplified immune system seems to be able to faithfully describe some of the key immune responses, including the timing of antigen presentation, and the dynamics and major sources of IFN-α. The −IM model is essentially a target-cell depletion model, which is widely used to simulate virus infection including IAV.15 After fitting to clinical trial data,6,37 both the +IM and −IM models appear to be able to recapitulate the dose-dependent decline of viral titers after AMT or OP treatment. However, in terms of pathological changes, only the +IM model is able to describe the well-known phenomenon that only a tiny fraction of susceptible cells are affected even during severe IAV infection in vivo.39 The −IM model, as expected, reported a loss of nearly all epithelial cells, consistent with some in vitro studies.7 This difference may have significant implication in terms of evaluating drug combinatory effects, because all drugs in a combination therapy have to target a subpopulation of susceptible cells. Without immunity (in vitro or in silico), the susceptible cells are quickly depleted, leaving little room for the combination effects to emerge.
Indeed, when combination therapy was simulated using the two models against different virus strains, the −IM model consistently reported a lower synergy between AMT and OP compared to the +IM model. While no human trial data are available for validating the +IM model predictions, the +IM model predictions are consistent with a mouse study41 where the AMT/OP combination shows a certain degree of synergy against wild-type or drug-resistant influenza viruses. The −IM model predictions are consistent with in vitro studies reporting zero to low synergy against resistant IAV strains.7 Given these previous experimental data, and the more realistic representation of in vivo processes by the +IM model, it is reasonable to speculate that the stronger synergy predicted by this model, rather than the weak/zero synergy predicted by the −IM model, is probably closer to the real drug combinatory effect one would see in patients. If that is true, this result raises a possibility that the current method of evaluating drug synergy in vitro, as well as the widely used target-cell depletion models, may systematically underestimate the true synergy between some antiviral drugs. Notably, the +IM model predicts a certain degree of synergy even against a simulated double resistant strain, albeit only at high doses. Although the potential side effects of such high-dose combinations are yet to be cautiously explored, at least for OP, up to 675 mg oral dose was well tolerated by healthy subjects.20 Besides, studies have shown that drugs that exhibit synergy for a specific effect are usually not synergistic for side effects.42,43 Importantly, a potential fatal infection, such as by double resistant strains, calls for a dosing strategy that produces maximum effects as quickly as possible, even at the expense of increased toxicity.40 The current model may be used to guide the dose selection against resistant IAV infections, to achieve the highest possible efficacy with lowest possible doses in combination.
The model described in this paper has several limitations. As stated above, the immune system as represented in the model is an oversimplification; but even with this restricted level of molecular detail, the model is over fitted due to a lack of experimental data to support parameterization. Much richer experimental data sets would be needed to produce more precise parameter estimates. Although experimental measurements of many immune response outputs are available for animals and have been used in modeling,16 the relationship between these animal data and human ones are unknown. Another caveat is that, at this stage, the model adopts a “typical” value for each parameter, without considering intersubject variability. Intersubject variability is very important in applying the model to actual clinical situations to predict the outcome of a population, for example, a clinical trial, rather than a single “average” patient. Much work is needed to fill the gaps in our knowledge and further adjustment is necessary before this model can be generally used to make a clinical decision. Nonetheless, as shown here, the current model may be useful for providing mechanistic insights into the complex interaction between IAV infection and immune responses, and in shedding some light on dose selection in severe infections by resistant IAV.
Methods
Model construction.
The model is mathematically represented by a series of delay differential equations (see Supplementary Files online for details). The majority of reactions are assumed to be first order for simplicity. Graphical representation and module management of the model is done by Cytoscape,44 with plugins developed in-house. The initial values for various species are listed in Supplementary Table S3 online. Note that the initial virus titers are individually fitted for each different simulation as in other modeling studies.1,16,17,18 The equations are numerically solved by the R package deSolve (http://desolve.r-forge.r-project.org/).
For parameter estimation, we developed a computational method Genetic Algorithm-based Parameterization for Systems Modeling specifically tailored to relatively large systems biology/pharmacology modeling. The details of this method are discussed in Supplementary Methods online. Briefly, instead of providing an initial guess as in traditional local searching algorithms, we define a biologically/pharmacologically plausible range for each parameter. The ranges are based on literature reports or general domain knowledge and their sizes can vary dramatically, depending on whether or not a parameter is readily measurable by experiments or not. An objective function is defined as the weighted sum of the squared errors between model values and experimental measurements, with the weights adjusted according to fitting. A genetic algorithm, modified to overcome some specific pitfalls in solving ordinary differential equations, is then used to search for the global optimum that minimizes the objective function within parameter ranges. The algorithm is run using in-house developed R (http://www.R-project.org) scripts, taking advantage of the parallel computing functions in Snow package (http://cran.r-project.org/web/packages/snow/index.html) in a computer cluster hosted by Scientific Computing Laboratory of CDRH, US Food and Drug Administration.
Simulation of immune responses and therapeutic effects.
Inactivated APCs in the lung compartment are assumed to be maintained at a balance level of 1 × 10⁵, accounting for the fact that dendritic cells are constantly recruited from the blood into the lung.45 Similarly, the activation of T cells in the lymphatic compartment is solely dependent on the number of activated APCs present, because the number of naive circulating T-cell precursors available to enter the lymph node is virtually unlimited.30 The time delay between activated APCs in the lung and lymphatic compartment is 24 h, while the CD8+ T-cell count in the lung compartment was assumed to be 15% of that in the lymphatic compartment with a time delay of 12 h.16
To simulate therapies, certain amount of drug (according to the dose) is fed into the model sometime after the initial virus exposure. Because in clinical studies the exact timing of initial virus exposure is unknown, we assumed the first dose is administered 96 h after the initial infection, allowing 2 days for symptoms to occur and another 2 days for hospital visits and diagnosis. Other lag times were also tried and while the estimated parameters may change, the overall simulation patterns remain the same in different lag time settings (data not shown).
To simulate resistant virus strains, we increased the in vivo IC50 (inverse of K17 for AMT and K22 for OC respectively) by 10-fold. Note that a resistant virus strain may appear to have an in vitro IC50 increased hundreds or even thousands of times compared to wild type,7 but these cell culture assays are known to overestimate the variability and change of IC50 due to nonoptimal cell surface receptors.46 So, we chose to use a more moderate increase of 10-fold.
Calculation of synergy.
Synergy was calculated based on Prichard and Shipman method.47 Briefly, a theoretical additive effect (Z) between two drugs, which have an effect of X and Y respectively when used alone, can be described as:
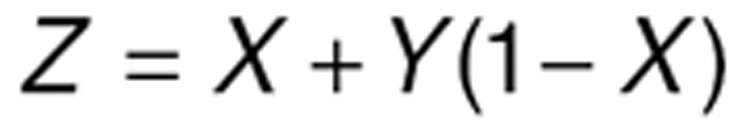 |
Here the drug effects X, Y, and Z are represented by percentage inhibition of viral titers compared to control (placebo). Assuming a drug combination study reports an actual combinatory effect of E, then the difference (S) between this measured (through experiments or simulation) effect, and the theoretical effect Z indicates the degree of synergy between the two drugs. Simply, S = E−Z. The more S is above (below) zero, the greater degree of synergy (antagonism) the drug pair has. Notably, all these effects (X, Y, Z, and E) are dependent on not only the drug used but also the dose in the combination. So, a series of dose combinations need to be explored to find the regime that manifests the strongest synergy. To simulate drug combination therapy, an arbitrarily fixed initial viral titer of 10 is used, and all the effects (X, Y, Z, and E) are calculated as the percent inhibition of viral titers 24 h after the first dose compared to control (no drug) at the same time point.
Author Contributions
Z.L. and T.C. wrote the manuscript. Z.L. and T.C. designed the research. Z.L. performed the research. Z.L. analyzed the data. Z.L., H.Z., Y.L., and T.C. contributed new reagents/analytical tools.
Conflict of interest
The authors declared no conflict of interest.
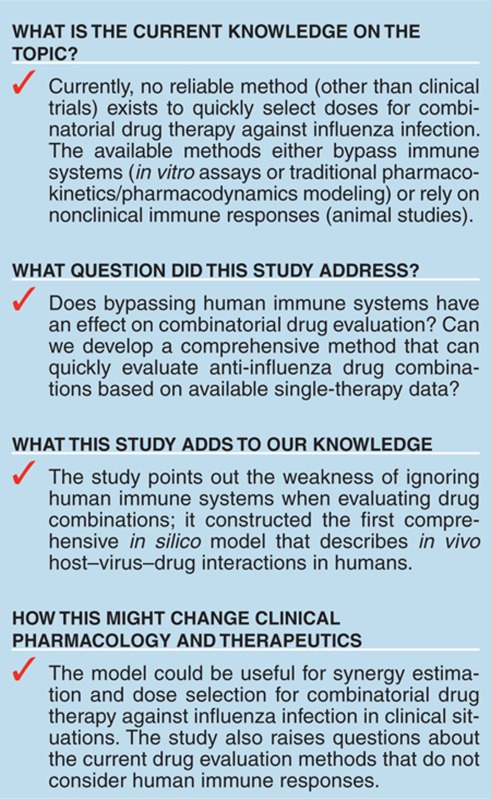
Study Highlights
Supplementary Material
References
- Saenz R.A., et al. Dynamics of influenza virus infection and pathology. J. Virol. 2010;84:3974–3983. doi: 10.1128/JVI.02078-09. [DOI] [PMC free article] [PubMed] [Google Scholar]
- Simonsen L., Clarke M.J., Williamson G.D., Stroup D.F., Arden N.H., Schonberger L.B. The impact of influenza epidemics on mortality: introducing a severity index. Am. J. Public Health. 1997;87:1944–1950. doi: 10.2105/ajph.87.12.1944. [DOI] [PMC free article] [PubMed] [Google Scholar]
- Chizhmakov I.V., Geraghty F.M., Ogden D.C., Hayhurst A., Antoniou M., Hay A.J. Selective proton permeability and pH regulation of the influenza virus M2 channel expressed in mouse erythroleukaemia cells. J. Physiol. 1996;494 (Pt 2):329–336. doi: 10.1113/jphysiol.1996.sp021495. [DOI] [PMC free article] [PubMed] [Google Scholar]
- Garman E., Laver G. Controlling influenza by inhibiting the virus's neuraminidase. Curr. Drug Targets. 2004;5:119–136. doi: 10.2174/1389450043490604. [DOI] [PubMed] [Google Scholar]
- Reuman P.D., Bernstein D.I., Keefer M.C., Young E.C., Sherwood J.R., Schiff G.M. Efficacy and safety of low dosage amantadine hydrochloride as prophylaxis for influenza A. Antiviral Res. 1989;11:27–40. doi: 10.1016/0166-3542(89)90018-1. [DOI] [PubMed] [Google Scholar]
- Treanor J.J., et al. Efficacy and safety of the oral neuraminidase inhibitor oseltamivir in treating acute influenza: a randomized controlled trial. US Oral Neuraminidase Study Group. JAMA. 2000;283:1016–1024. doi: 10.1001/jama.283.8.1016. [DOI] [PubMed] [Google Scholar]
- Nguyen J.T., et al. Triple combination of amantadine, ribavirin, and oseltamivir is highly active and synergistic against drug resistant influenza virus strains in vitro. PLoS One. 2010;5:e9332. doi: 10.1371/journal.pone.0009332. [DOI] [PMC free article] [PubMed] [Google Scholar]
- van der Vries E., van den Berg B., Schutten M. Fatal oseltamivir-resistant influenza virus infection. N. Engl. J. Med. 2008;359:1074–1076. doi: 10.1056/NEJMc0803120. [DOI] [PubMed] [Google Scholar]
- Gulick R.M., et al. Simultaneous vs sequential initiation of therapy with indinavir, zidovudine, and lamivudine for HIV-1 infection: 100-week follow-up. JAMA. 1998;280:35–41. doi: 10.1001/jama.280.1.35. [DOI] [PubMed] [Google Scholar]
- Greco W.R., Bravo G., Parsons J.C. The search for synergy: a critical review from a response surface perspective. Pharmacol. Rev. 1995;47:331–385. [PubMed] [Google Scholar]
- Nguyen J.T., et al. Triple combination of oseltamivir, amantadine, and ribavirin displays synergistic activity against multiple influenza virus strains in vitro. Antimicrob. Agents Chemother. 2009;53:4115–4126. doi: 10.1128/AAC.00476-09. [DOI] [PMC free article] [PubMed] [Google Scholar]
- Ilyushina N.A., Hoffmann E., Salomon R., Webster R.G., Govorkova E.A. Amantadine-oseltamivir combination therapy for H5N1 influenza virus infection in mice. Antivir. Ther. 2007;12:363–370. [PubMed] [Google Scholar]
- Mestas J., Hughes C.C. Of mice and not men: differences between mouse and human immunology. J. Immunol. 2004;172:2731–2738. doi: 10.4049/jimmunol.172.5.2731. [DOI] [PubMed] [Google Scholar]
- Dixit N.M., Layden-Almer J.E., Layden T.J., Perelson A.S. Modelling how ribavirin improves interferon response rates in hepatitis C virus infection. Nature. 2004;432:922–924. doi: 10.1038/nature03153. [DOI] [PubMed] [Google Scholar]
- Beauchemin C.A., Handel A. A review of mathematical models of influenza A infections within a host or cell culture: lessons learned and challenges ahead. BMC Public Health. 2011;11 suppl. 1:S7. doi: 10.1186/1471-2458-11-S1-S7. [DOI] [PMC free article] [PubMed] [Google Scholar]
- Lee H.Y., et al. Simulation and prediction of the adaptive immune response to influenza A virus infection. J. Virol. 2009;83:7151–7165. doi: 10.1128/JVI.00098-09. [DOI] [PMC free article] [PubMed] [Google Scholar]
- Pawelek K.A., Huynh G.T., Quinlivan M., Cullinane A., Rong L., Perelson A.S. Modeling within-host dynamics of influenza virus infection including immune responses. PLoS Comput. Biol. 2012;8:e1002588. doi: 10.1371/journal.pcbi.1002588. [DOI] [PMC free article] [PubMed] [Google Scholar]
- Baccam P., Beauchemin C., Macken C.A., Hayden F.G., Perelson A.S. Kinetics of influenza A virus infection in humans. J. Virol. 2006;80:7590–7599. doi: 10.1128/JVI.01623-05. [DOI] [PMC free article] [PubMed] [Google Scholar]
- Davies B.E. Pharmacokinetics of oseltamivir: an oral antiviral for the treatment and prophylaxis of influenza in diverse populations. J. Antimicrob. Chemother. 2010;65 suppl. 2:ii5–ii10. doi: 10.1093/jac/dkq015. [DOI] [PMC free article] [PubMed] [Google Scholar]
- Wattanagoon Y., et al. Pharmacokinetics of high-dose oseltamivir in healthy volunteers. Antimicrob. Agents Chemother. 2009;53:945–952. doi: 10.1128/AAC.00588-08. [DOI] [PMC free article] [PubMed] [Google Scholar]
- Morimoto K., et al. Effect of milk on the pharmacokinetics of oseltamivir in healthy volunteers. J. Pharm. Sci. 2011;100:3854–3861. doi: 10.1002/jps.22627. [DOI] [PubMed] [Google Scholar]
- Aoki F.Y., Sitar D.S. Clinical pharmacokinetics of amantadine hydrochloride. Clin. Pharmacokinet. 1988;14:35–51. doi: 10.2165/00003088-198814010-00003. [DOI] [PubMed] [Google Scholar]
- Bleidner W.E., Harmon J.B., Hewes W.E., Lynes T.E., Hermann E.C. Absorption, distribution and excretion of amantadine hydrochloride. J. Pharmacol. Exp. Ther. 1965;150:484–490. [PubMed] [Google Scholar]
- Horadam V.W., et al. Pharmacokinetics of amantadine hydrochloride in subjects with normal and impaired renal function. Ann. Intern. Med. 1981;94:454–458. doi: 10.7326/0003-4819-94-4-454. [DOI] [PubMed] [Google Scholar]
- Morrison D., et al. A randomized, crossover study to evaluate the pharmacokinetics of amantadine and oseltamivir administered alone and in combination. PLoS One. 2007;2:e1305. doi: 10.1371/journal.pone.0001305. [DOI] [PMC free article] [PubMed] [Google Scholar]
- Hayden F.G., Fritz R., Lobo M.C., Alvord W., Strober W., Straus S.E. Local and systemic cytokine responses during experimental human influenza A virus infection. Relation to symptom formation and host defense. J. Clin. Invest. 1998;101:643–649. doi: 10.1172/JCI1355. [DOI] [PMC free article] [PubMed] [Google Scholar]
- Gazit R., et al. Lethal influenza infection in the absence of the natural killer cell receptor gene Ncr1. Nat. Immunol. 2006;7:517–523. doi: 10.1038/ni1322. [DOI] [PubMed] [Google Scholar]
- Grundy J.E., Trapman J., Allan J.E., Shellam G.R., Melief C.J. Evidence for a protective role of interferon in resistance to murine cytomegalovirus and its control by non-H-2-linked genes. Infect. Immun. 1982;37:143–150. doi: 10.1128/iai.37.1.143-150.1982. [DOI] [PMC free article] [PubMed] [Google Scholar]
- Stark G.R., Kerr I.M., Williams B.R., Silverman R.H., Schreiber R.D. How cells respond to interferons. Annu. Rev. Biochem. 1998;67:227–264. doi: 10.1146/annurev.biochem.67.1.227. [DOI] [PubMed] [Google Scholar]
- Yoon H., Legge K.L., Sung S.S., Braciale T.J. Sequential activation of CD8+ T cells in the draining lymph nodes in response to pulmonary virus infection. J. Immunol. 2007;179:391–399. doi: 10.4049/jimmunol.179.1.391. [DOI] [PubMed] [Google Scholar]
- Miao H., et al. Quantifying the early immune response and adaptive immune response kinetics in mice infected with influenza A virus. J. Virol. 2010;84:6687–6698. doi: 10.1128/JVI.00266-10. [DOI] [PMC free article] [PubMed] [Google Scholar]
- Polakos N.K., et al. Early intrahepatic accumulation of CD8+ T cells provides a source of effectors for nonhepatic immune responses. J. Immunol. 2007;179:201–210. doi: 10.4049/jimmunol.179.1.201. [DOI] [PubMed] [Google Scholar]
- Hamilton-Easton A., Eichelberger M. Virus-specific antigen presentation by different subsets of cells from lung and mediastinal lymph node tissues of influenza virus-infected mice. J. Virol. 1995;69:6359–6366. doi: 10.1128/jvi.69.10.6359-6366.1995. [DOI] [PMC free article] [PubMed] [Google Scholar]
- Siegal F.P., et al. The nature of the principal type 1 interferon-producing cells in human blood. Science. 1999;284:1835–1837. doi: 10.1126/science.284.5421.1835. [DOI] [PubMed] [Google Scholar]
- Smed-Sörensen A., et al. Influenza A virus infection of human primary dendritic cells impairs their ability to cross-present antigen to CD8 T cells. PLoS Pathog. 2012;8:e1002572. doi: 10.1371/journal.ppat.1002572. [DOI] [PMC free article] [PubMed] [Google Scholar]
- Foster G.R., Germain C., Jones M., Lechler R.I., Lombardi G. Human T cells elicit IFN-alpha secretion from dendritic cells following cell to cell interactions. Eur. J. Immunol. 2000;30:3228–3235. doi: 10.1002/1521-4141(200011)30:11<3228::AID-IMMU3228>3.0.CO;2-B. [DOI] [PubMed] [Google Scholar]
- Knight V., Fedson D., Baldini J., Douglas R.G., Couch R.B. Amantadine therapy of epidemic influenza a(2) (Hong Kong) Infect. Immun. 1970;1:200–204. doi: 10.1128/iai.1.2.200-204.1970. [DOI] [PMC free article] [PubMed] [Google Scholar]
- van den Brand J.M., et al. Comparison of temporal and spatial dynamics of seasonal H3N2, pandemic H1N1 and highly pathogenic avian influenza H5N1 virus infections in ferrets. PLoS One. 2012;7:e42343. doi: 10.1371/journal.pone.0042343. [DOI] [PMC free article] [PubMed] [Google Scholar]
- Guarner J., et al. Immunohistochemical and in situ hybridization studies of influenza A virus infection in human lungs. Am. J. Clin. Pathol. 2000;114:227–233. doi: 10.1309/HV74-N24T-2K2C-3E8Q. [DOI] [PubMed] [Google Scholar]
- White N.J., Webster R.G., Govorkova E.A., Uyeki T.M. What is the optimal therapy for patients with H5N1 influenza. PLoS Med. 2009;6:e1000091. doi: 10.1371/journal.pmed.1000091. [DOI] [PMC free article] [PubMed] [Google Scholar]
- Nguyen J.T., et al. Efficacy of combined therapy with amantadine, oseltamivir, and ribavirin in vivo against susceptible and amantadine-resistant influenza A viruses. PLoS One. 2012;7:e31006. doi: 10.1371/journal.pone.0031006. [DOI] [PMC free article] [PubMed] [Google Scholar]
- Jia J., et al. Mechanisms of drug combinations: interaction and network perspectives. Nat. Rev. Drug Discov. 2009;8:111–128. doi: 10.1038/nrd2683. [DOI] [PubMed] [Google Scholar]
- Owens C.M., et al. Chemical combinations elucidate pathway interactions and regulation relevant to Hepatitis C replication. Mol. Syst. Biol. 2010;6:375. doi: 10.1038/msb.2010.32. [DOI] [PMC free article] [PubMed] [Google Scholar]
- Saito R., et al. A travel guide to Cytoscape plugins. Nat. Methods. 2012;9:1069–1076. doi: 10.1038/nmeth.2212. [DOI] [PMC free article] [PubMed] [Google Scholar]
- Vermaelen K., Pauwels R. Pulmonary dendritic cells. Am. J. Respir. Crit. Care Med. 2005;172:530–551. doi: 10.1164/rccm.200410-1384SO. [DOI] [PubMed] [Google Scholar]
- Zambon M., Hayden F.G. Global Neuraminidase Inhibitor Susceptibility Network Position statement: global neuraminidase inhibitor susceptibility network. Antiviral Res. 2001;49:147–156. doi: 10.1016/s0166-3542(01)00124-3. [DOI] [PubMed] [Google Scholar]
- Prichard M.N., Shipman C., Jr. A three-dimensional model to analyze drug-drug interactions. Antiviral Res. 1990;14:181–205. doi: 10.1016/0166-3542(90)90001-n. [DOI] [PubMed] [Google Scholar]
- Jhee S.S., et al. Low penetration of oseltamivir and its carboxylate into cerebrospinal fluid in healthy Japanese and Caucasian volunteers. Antimicrob. Agents Chemother. 2008;52:3687–3693. doi: 10.1128/AAC.00327-08. [DOI] [PMC free article] [PubMed] [Google Scholar]
- Hayden F.G., Minocha A., Spyker D.A., Hoffman H.E. Comparative single-dose pharmacokinetics of amantadine hydrochloride and rimantadine hydrochloride in young and elderly adults. Antimicrob. Agents Chemother. 1985;28:216–221. doi: 10.1128/aac.28.2.216. [DOI] [PMC free article] [PubMed] [Google Scholar]
Associated Data
This section collects any data citations, data availability statements, or supplementary materials included in this article.