Abstract
We present results from all-atom molecular dynamics simulations of large-scale hydrophobic plates solvated in NaCl and NaI salt solutions. As observed in studies of ions at the air-water interface, the density of iodide near the water-plate interface is significantly enhanced relative to chloride and in the bulk. This allows for the partial hydration of iodide while chloride remains more fully hydrated. In 1M solutions, iodide directly pushes the hydrophobes together (contributing −2.51 kcal/mol) to the PMF. Chloride, however, strengthens the water-induced contribution to the PMF by ~ −2.84 kcal/mol. These observations are enhanced in 3M solutions, consistent with the increased ion density in the vicinity of the hydrophobes. The different salt solutions influence changes in the critical hydrophobe separation distance and characteristic wetting/dewetting transitions. These differences are largely influenced by the ion-specific expulsion of iodide from bulk water. Results of this study are of general interest to the study of ions at interfaces and may lend insight to the mechanisms underlying the Hofmeister series.
1 Introduction
The assembly and aggregation of hydrophobes is inherent in a wide variety of fundamental and industrial processes1-7. Controlling assembly (either preventing it or exploiting it to create extended structures) often requires the addition of solubilizing intermediates. In the case of single-walled nanotubes (SWNT), recent experimental and theoretical/modeling efforts have focused on introducing surfactants or surfactant-like species to prevent the assembly/aggregation of SWNT’s in solution1,2,8,9. A recent study has begun to explore the effects of mono-valent, inorganic ions on SWNT’s in solution1. In particular, Frolov et al1 study the nature of interactions between different ions and SWNT’s using molecular simulations in order to explore specific ion effects in the context of these industrially relevant systems. In a biological context, specific ion effects such as those observed by Hofmeister10-16 relating to the “salting-in” and “salting-out” of proteins in aqueous electrolyte solutions of varying ionic species and concentrations have been pursued from theoretical, modeling, and experimental approaches for decades; studies continue to probe the fundamental phenomenology of this effect11-13,16-38.
Despite the considerable amount of work that has gone into studies investigating the origins of specific ion effects in relation to the Hofmeister series, the specific mechanism through which Hofmeister series ions influence “salting-in” and “salting-out” behavior remains unresolved. Early attempts to explain the position of specific ions in the Hofmeister series relied on the classification of these ions as either kosmotropes (water structure-makers) or chaotropes (water structure-breakers). However, recent experimental and simulation studies suggest limited influence of these ions on the structure and dynamics of bulk water.25,39,40 Using femtosecond pump-probe spectroscopy, Omta et al. concluded that ions do not influence the rotational dynamics of water outside the first solvation shell or significantly alter the hydrogen bond network of liquid water; this obervation held for both chaotropes () and kosmotropes ().40 Analyzing the effect of model ions of varying charge density on structural metrics for water (radial distribution functions and average number of hydrogen bonds), Zangi concluded that ions classified as chaotropes induced a more ordered solvent than those classified as kosmotropes–the opposite of what their names imply.39 While emphasizing the limited or contradictory connection between ion classification and bulk water structure, these studies39,40 note the importance of the strength of interactions between ions and water in their first hydration shell.
In place of the chaotropes/kosmotrope paradigm, the direct or indirect binding of ions to hydrophobic solutes or patches of proteins (and the associated disruption to structure of water solvating these species) has emerged as a possible explanation of the Hofmeister mechanism.23-26 Zhang et al. examined the influence of 11 sodium salts on the stability of poly(N-isopropylacrylamide).25,26 Kosmotropic anions were shown to polarize the water molecules hydrating the macromolecule, whereas the chaotropic anions directly interact with the macromolecule. The former of these mechanisms resulted in salting-out of the macromolecule, whereas the latter influenced salting-in.25,26 Similar results were observed from molecular dynamics simulations of model systems. Zangi et al. have performed simulations of the effect of model salts on the strength of hydrophobic association for two large plates.23 They observed that ions with a high charge density preferably resided away from the hydrophobe surface; these ions were shown to decrease the free energy associated with plate association (relative to pure water). Conversely, ions with low charge density show significant density enhancement at the water-hydrophobe interface and increase the free energy for plate association.
Indeed, the effects of different ions on the energetics and kinetics of hydrophobe assembly are necessarily mediated through the interfacial region between hydrophobe and solvent. Thus, understanding the solvent-hydrophobe interfacial structure and dynamics in pure solvent (water) and aqueous electrolyte solutions is of fundamental relevance to a broad spectrum of applications ranging from protein stability 25,41–46 to atmospheric chemistry35,47,48.
In this work, we study the behavior of ions at the water-hydrophobe interface, and their influence on the energetics of assembly of large-scale hydrophobes. In particular, we attempt to propose a mechanism through which different ions may influence the energetics of assembly in an ion-specific manner. By partitioning the free energetics of association, as represented in the potential of mean force between two large hydrophobes, into the individual contributions from solvent, cation, anion, and hydrophobe, we hope to glean more fundamental insights. We build upon our previous studies of the free energetics of large hydrophobe assembly in polarizable solvents in order to systematically understand the molecular-level interpretations of changes in association energetics. We apply simple, model systems in order to determine a baseline from which to consider effects related to systems of more complex dynamics and greater surface heterogeneity in terms of chemistries with variable solvent affinities. Though simple (polarizable solvent and non-polarizable inorganic ions), the combination of water and ion force field models are well-balanced in terms of capturing the relative hydration free energetics of the ions studied49. The present models also qualitatively capture major specific ion effects at the liquid-vapor interface (via-a-vis, larger iodide enhancement at the aqueous solution liquid-vapor interface relative to chloride and fluoride). We thus believe our models sufficiently recapitulate numerous recent experimental observations. Our intent in this paper is to explore a mechanistic view for the effects of inorganic ions of different size and polarizability. We investigate concentration dependence by comparing results at two different salt concentrations. In Section 2 we discuss the force fields and computational methodology. Our results are presented in Section 3 and are organized into four topics. First we examine and compare the density of ions at the water-hydrophobe interface in Section 3.1. Next, in Section 3.2 we consider the hydration structure of the anions in different environments (bulk, water-hydrophobe interface, water-air interface) through radial angular distributions and additional metrics of anisotropy. In Section 3.3 we investigate potential of mean force for hydrophobe association and the contributions from the hydrophobe, water, and ions. A final analysis focuses on ion selectivity in the hydrophobically confined region between the two hydrophobes and the influence of the salts on wetting/dewetting transitions. We conclude our study in Section 4 with a summary of our findings and general discussion.
2 Methods
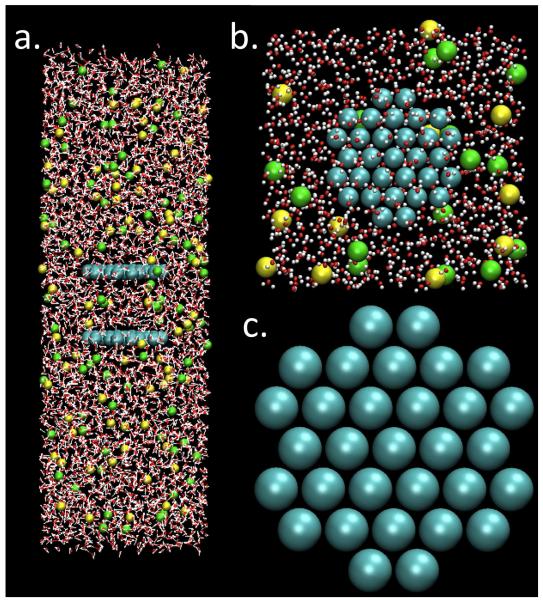
We performed molecular dynamics simulations in the canonical ensemble (NVT, T = 300 K) using CHARMM50. Constant temperature for the nuclear degrees of freedom (water molecules that are allowed to move freely) was maintained using the Nosé-Hoover thermostat with a mass of 50 kcal/mol · ps2 for the thermostat degree of freedom. Since a small number of total system atoms are held fixed, thus possibly influencing the dynamics of water molecules in the immediate vicinity of the plate atoms, we considered two factors to assess the validity of the use of the Nosé-Hoover thermostat in this particular system. In Supplementary Information, we compute the distributions of the x, y, and z-components of the oxygen atoms of water molecules in bulk region and in the first solvation layer of the plates. We also calculate the temperature of the water molecules in bulk and in the first solvation layer of the plates to make certain that the system in equilibrium does not violate equipartition of kinetic energy. All systems were of rectangular shape with dimensions of Lx = 36 Å, Ly = 36 Å, and Lz=200 Å, respectively. The longer z-dimension accommodates a vapor space above the bulk liquid; thus our system contains a liquid-vapor interface that is included in order to probe the relative propensities of different anions and cations between the free liquid-vapor interface and the liquid-hydrophobe interface. This simulation scheme is a standard protocol36,51,52. The hydrophobic surfaces consisted of two parallel plates, each comprised of 31 atoms arranged in a triangular lattice with bond length of 3.2 Å (Figure 1); both plates were solvated with TIP4P-FQ water molecules53. The Lennard-Jones (LJ) parameters of the plate atoms were ε = 0.1195 kcal/mol, Rmin = 4.4898 Å, which are adopted from previous studies23,54,55; however, interactions among atoms on the same plate were excluded. The water-plate interactions were fixed to be εij = 0.1362 kcal/mol, Rmin = 4.022 Å.55. Although the addition of a water hydrogen-plate LJ interaction may influence the structure of water near the plates, the inclusion of this term seems arbitrary as the water model used in this study and many other commonly used water models (such as SPC/E as used in References23,54,56,57) do not include LJ interactions. The orientation and structure of water approaching the plates was previously investigated in our previous work55 and has been shown to agree among commonly used water models. As mentioned in the introduction, the hydrophobes used in our study represent a model system. While this system does not directly correspond to a specific physical system (i.e., a graphene sheet or self-assembled monolayer), the interaction between water and the plate system used results in a water density near the plates that is consistent with that observed for water near a hydrocarbon monolayer. 23,58 Furthermore, based on the criteria presented in the fluctuation analysis of water wetting/dewetting between hydrophobic plates by Eun et al56, the water-plate interaction selected for this work can be categorized as hydrophobic. The water structure we observe (in this study and in our previous study) is equivalent to earlier published results (both in terms of the orientation of water molecules at the hydrophobe-water interface and water density near the hydrophobe. In fact, the qualitative behavior of water in our study is not different from the consensus behavior observed in myriad previous studies investigating the hydrophobic assembly free energetics via potentials of mean force.54,56,57
Fig. 1.
Representative snapshots of the 1M NaCl system used in this study; plate-plate separation is 14.4 Å. Atom types can be distinguished by the following color code: O (red), H (white), Cl− (green), Na+ (yellow), plate atoms (blue). (a) Side profile showing the relative solvation of the plates in the normal and lateral directions. Solvent occupies a significant volume, with at least 25 Å between plate-water and water-air interfaces. (b) Top profile of a solvated plate. For clarity only particles occupying 0 < z < 12Å are shown; the size of water molecule representations was also reduced. Distance between plates and their lateral periodic image is sufficient to allow access to several layers of water and ions. (c) Unsolvated plate, depicting the fixed geometry of 31 uncharged plate atoms.
We have adopted a common approach23,54,56,59,60 to treat the plates/graphite carbon atoms as uncharged. Thus, water will not have Coulombic interactions with the plates. A previous study by Werder et al59 compared multiple interaction models between water and plate; from their study, there does not seem to be any compelling reason to include Coulombic interactions between water and plate. In fact, Werder et al, based on their metric of microscopic contact angle, suggest that the model that best satisfies their criteria is one without Coulombic interactions between water and plate. Treating plates as uncharged will also remove the Coulombic interaction between ions and the plate. While effects of inserting charged “particles” in plate systems have been investigated in previous studies and can alter the structure of solvent61-63 such consideration is unnecessary for the hydrophobic particles we are studying here.
While the size of the system will influence the absolute magnitude of the potential of mean force and perhaps the properties of confined water, the size of the plate system we are using is above the small molecule limit. Considering a recent study of the length scales for hydrophobic interactions,57 our system would lie on the horizontal region (enthalpy driven) of the −ΔG/ΔSESA vs. −ΔSESA profile, where ΔG is the change in free energy for hydrophobic association and ΔSESA is the change in the solvent-excluded surface area. As a result, we do not expect to see qualitatively dissimilar results in the PMF (the important property in this study) upon extending to larger surfaces. Again, we acknowledge that for smaller surfaces (smaller hydrophobes) we certainly may observe differences in the absolute depth of the potential of mean force; but we are not interested in hydrophobic solute sizes within the entropy-driven regime in the present study.
In the system of pure water there were 4538 TIP4P-FQ water molecules53. In order to generate 1M salt solutions, 160 water molecules were replaced at random by 80 pairs of cations and anions (yielding a final system of 4378 TIP4P-FQ molecules, 80 anions, 80 cations). The 3M solutions were generated in a similar manner, resulting in a system of 4058 water molecules, 240 anions, and 240 cations. The molar concentrations used throughout this work are only approximate concentrations since they depend on the actual physical volume of the solution, which fluctuates throughout the course of the simulation since there is a liquid-vapor interface. The molar concentrations (moles of ion/mass of water) of both the 1M and 3M solutions are 1.014 and 3.283 mol/kg, respectively; we retain the approximate molar concentrations as a convenient means of distinguishing each solution. The positions of all plate atoms were fixed throughout the simulation, using the same geometry in previous work.23,55 The interplate distance varied from 3.6 to 14.4 Å in the z-direction, with about 30 distances sampled. Each distance was sampled for at least 5 ns. Sampling was increased to 10 ns for separation distances d = 10.1 − 10.8 Å (d = 10.1 − 11.4 Å for 3M NaI). In this region (referred to hereafter as the critical region), the hydrophobically confined region oscillates between water-filled (wet) and unfilled states.
Water polarizability was treated explicitly using the charge equilibration (CHEQ) formalism. The electrostatic energy of a N-atom molecule is
| (1) |
where χi and ηi represent the atomic electronegativity and hardness, respectively. The Jij term is the interatomic hardness given by the Coulomb overlap integral as discussed by Rick et al in the original parameterization53. The last term is the charge neutrality constraint. We treat the ions as non-polarizable throughout the simulations; their electrostatic interactions were exclusively Coulombic. The non-bond interactions were treated via the standard Lennard-Jones “12-6” potential
| (2) |
The LJ parameters are summarized in Table 1. Water parameters were based on those of the TIP4P-FQ force field 53. Ion parameters are based on the work of Lamoureux and Roux64 which have been shown to reproduce experimental hydration free energies in TIP4P-FQ reasonably well49 and have been characterized in terms of bulk and interfacial properties.65,66 The interactions of the plate atoms are based on the work of Zangi and Berne.54 The parameters of ion-plate and ion-water interactions were given by the combination rules:
| (3) |
Table 1.
Parameters used in the simulation.
| Rmin (Å) | ε (kcal/mol) | q(e) | |
|---|---|---|---|
| Oa | 3.5458 | 0.2862 | −0.888 |
| Na+ | 2.8998 | 0.03151 | 1 |
| Cl− | 4.9198 | 0.07658 | −1 |
| I− | 5.5198 | 0.1591 | −1 |
| Plateb | 4.4898 | 0.1195 | 0 |
Charge presented here was on the M-site of TIP4P-FQ water molecule in the gas phase.
The LJ parameters for oxygen-plate interaction are fixed to be εij = 0.1362 kcal/mol, Rmin = 4.022 Å.
Lennard-Jones interactions were switched off at interparticle distance of 12 Å, with a gradual switching between 11Å and 12Å using the switching function:
| (4) |
Long-range interactions were treated using Particle Mesh Ewald (PME)67 with 40, 40, 180 grid points in x, y, z dimension (FFT grid spacing). The screening parameter κ = 0.330. SHAKE68 was used to maintain the rigid geometry of each water molecule. For TIP4P-FQ water, the fictitious charge degrees of freedom were assigned masses of 0.000069 . The Nosé-Hoover69 method was implemented to couple the charge degrees of freedom to a thermostat at 1 K; this thermostat had a mass of 0.005 (kcal/mol)/(ps2). The classical equations of motions were propagated using the Velocity-Verlet integrator with time steps of 0.5 fs under 3D periodic boundary conditions.
To investigate the dependence of anion solvation structures in different environments, we carried out an additional set of simulations in which a single ion was constrained within bulk water, liquid-vapor (LV) interface, and water-hydrophobic interface environments. For the simulations of the bulk water and LV environments, a simulation cell of dimensions 36 Å × 36 Å × 200 Å containing 2000 TIP4P-FQ water molecules and a single ion pair (Cl− or I− paired with Na+) was utilized. A similar system was used to investigate solvation of ions at the water-hydrophobe interface, however, two plates were included at a separation distance of 14.4 Å. Simulations were performed in the NVT ensemble with other simulation details consistent with those previously listed. We imposed constraints on the ions to ensure they remained in the appropriate environment. Outside a spherical volume (with radius = rrestraint) a harmonic potential of form V = (k/2)(r−rrestraint)2 was activated, where r is the distance between the ion and its constrained position. A force constant of 100.0 (kcal/mol)/Å2 was used for all environments; the radius of the sphere was rrestraint = 5 Å for the bulk environment and rrestraint = 8 Å for the interfacial environments. For the bulk environment, the anion was constrained within a sphere centered about < 0Å, 0Å, 11Å >, while the cation was constrained within a sphere centered about < 0Å, 0Å, −11Å >. This ensured that the solvation of the ion was not influenced by the counterion or presence of the LV interfaces (which are located at positions of zGDS ≈ ±22 Å). To study the anion solvation in the LV-interface, the anion was constrained within a sphere centered about < 0Å, 0Å, 22Å > which corresponds to the z-position of the Gibbs Dividing Surface; the cation was constrained within a sphere in the bulk region (<0 Å, 0Å, −11Å>). For the water-hydrophobe interface, an anion was constrained within a sphere centered about the center of a plate at < 0Å, 0Å, 7.2Å >. With the radius of the constraining sphere comparable to the radius of the plate, the anion was effectively constrained within a hemisphere above the plate directed towards bulk water (in the negative z-direction). The cation was initially positioned in the negative z region of the simulation cell. In all cases, we monitored the distance between the anion and cation to ensure they remain separated by at least 10 Å; thus, solvation structure of the anion will not be significantly perturbed by the cation. All systems were sampled for 10 ns.
3 Results
3.1 Density Profile
We considered density profiles along the z-coordinate, normal to the hydrophobe/water interface. We restricted sampling for these profiles to a cylinder of radius r = 8.0 Å about the center of the plate in order to limit our analysis to molecules near the plates.55 This radius, although slightly reduced from the true plate radius, was chosen in order to avoid artifacts arising from the edge of the plates.
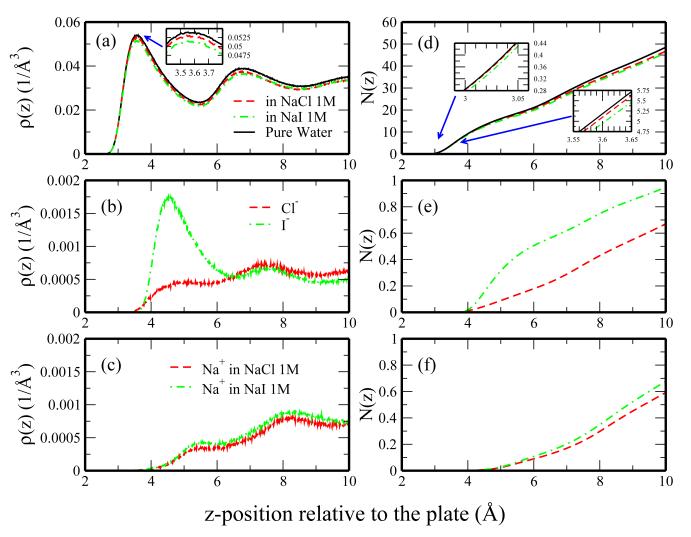
Figure 2a-c shows the density profiles of the water oxygen atom and ions as functions of the z-position relative to the z-component of the plate center of mass for pure water and 1M salt solutions. As an additional metric for comparison, we consider the corresponding numbers of water molecules and ions near the plates as determined through integration of the density profiles:
| (5) |
where ρi represents the number density of a given species i, 0 corresponds to the center of mass of the plates, and z is the distance normal to the plate-water interface. Results of this analysis are shown in Figure 2d-f for the integrated number of water, anions, and cations, respectively.
Fig. 2.
Number density and number profiles for different species in pure water, 1M NaCl, and 1M NaI solutions as a function of distance from the plate (approaching the bulk region). Density profiles for (a) water, (b) anions, and (c) cations. Corresponding integrated profiles are shown in panels d-f, respectively. The inset of panel a shows a focused view of the first density peak. The insets of panel B demonstrate the initial deviation in the NaI profile from the NaCl and pure water (left) and the deviation of the NaCl from water at larger distances (right).
Considering the water density profile in Figure 2a, water shows qualitatively similar behaviors in the vicinity of hydrophobic surface in pure water and the salt solutions. Water density is enhanced near the plates in all cases as observed and discussed by Bauer et al.55 The density enhancement arises due to the local ordering of water (to optimize hydrogen bonding). The enhanced water density and subsequent rarefaction show interesting differences among the salt solutions studied. Relative to pure water, the height of the first peak in the water density profile is reduced in the 1M NaI solution; the peak in the 1M NaCl solution is also reduced to a lesser extent. In both salt solutions the first minimum is reduced relative to the water profile. These features manifest in the integrated profile (panel d). The integrated number profile for water near the plates in NaI solution deviates from the profile of pure water earlier than does that of the NaCl solution. These differences are largely influenced by ion density. Iodide shows significant enhancement in the vicinity of the plate-water interface (Figure 2b); this increased iodide density displaces water near the plates and results in the reduced water density in the 1M NaI solution. Chloride ion is not as enhanced near the plate at low z-distances, thus explaining the similarity between the integrated (Figure 2d, red and black curves) and raw water number (Figure 2a, red and black curves) density profiles in pure water and 1M NaCl solution. It is not surprising that these ions show such significant differences near these surfaces. Numerous studies of alkali-halides at the liquid-vapor interface demonstrate the tendency for large ions such as iodide to be expelled from bulk water to the interface/surface while smaller ions remain fully hydrated.28,36,66The ion-water force field implemented in this study is the same as used in a previous study of ions at the water-air interface by Warren and Patel.66 Comparing the density profiles of these ions at the plate-water interface to those at the liquid-vapor interface in that work, we observe similar density profiles for chloride anion, but the iodide density is significantly enhanced near the plate-water interface. While the iodide is expelled from the bulk in both systems, the increased water density at the plate-water interface accommodates more expelled iodide through direct interactions (dispersion and electrostatic) between the iodide and water. Although the same cation is used in both salt solutions, the sodium density is noticeably higher near the plates in the 1M NaI solutions (Figure 2c). We attribute this to sodium ion’s attraction to the accumulated negative charge associated with the increased anion density in the 1M NaI solution. Ottosson et al. observed a similar enhancement of sodium density in NaI solutions (relative to those of NaCl solutions) in their study of ions at the air-water interface 70 and attributed this difference to the need for cation density to balance the adsorbed anion density.
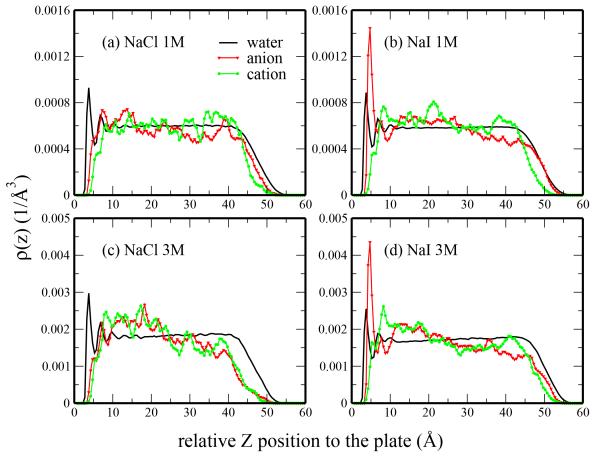
The systems used in this study also include water-air interfaces. When we consider the density profiles extended to the water-air interface, we note that ions preferably reside near the water-plate interface (ion density is low at the water-air interface). This comparison is shown in Figure 3. Iodide anion in both 1M and 3M NaI solutions shows a dramatic shift from the liquid-vapor interface in a pure liquid solution to the plate-water interface in the system with hydrophobe (Figure 3b and d). The fact that the iodide anion is weakly solvated (vis-a-vis the less favorable hydration free energy of the ion) coupled to the dispersion interactions between anion and plate explain the shift of the location of iodide density enhancement between the pure system and that with the hydrophobic solute. Chloride anion is relatively unaffected by the presence of the hydrophobes (Figure 3a and c).
Fig. 3.
Density profiles for (a) NaCl 1M, (b) NaI 1M, (c) NaCl 3M, (d) NaI 3M at hydrophobe-water and liquid-vapor interface. The interplate distance is 10.6 Å in all cases. The density of water has been rescaled with the ratio of the number of anion and the number of water.
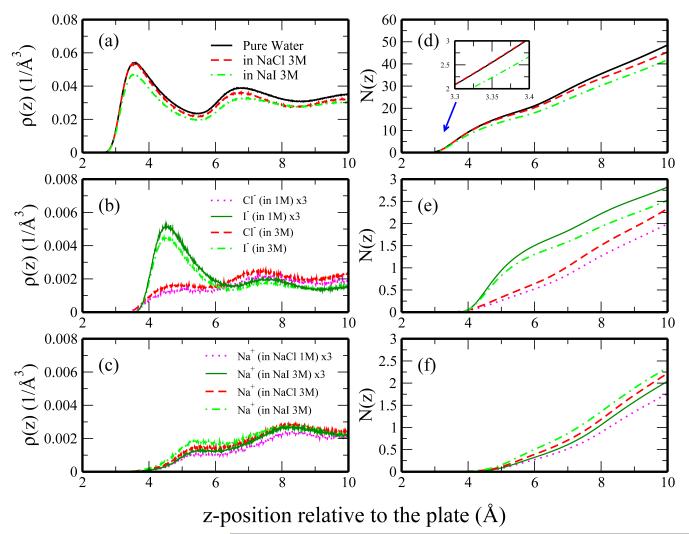
The density profiles for the 3M solutions (Figure 4) show enhanced, albeit similar, features compared to those for the 1M solutions. The water density in 3M NaCl follows the pure water profile at low distances (z < 3.4Å), but deviates at larger distances. As is observed in the water density for 1M NaI solution, the water density in 3M NaI is significantly reduced relative to pure water both at the first peak and first minimum. The anion densities are qualitatively similar to those of the 1M solutions. We can characterize the differences between the 1M and 3M anion density profiles through a comparison of the 3M density profile and a predicted density based on the 1M profile scaled by a factor of 3. The 3M anion density profiles deviate slightly from the scaled 1M profiles with 3M chloride slightly higher than the predicted profile and 3M iodide smaller than the predicted profile. Deviation of the iodide density from the predicted value may be attributed to saturation of the plate surface due to the limited surface area of the plate and the volume associated with the iodide ions and their hydration shell.
Fig. 4.
Density profiles for (a) water, (b) anions, and (c) cations in pure water, 3M NaCl, 3M NaI solutions. Corresponding integrated number density profiles are shown in panels d-f, respectively. For ion profiles, we show prediction from 3 times the 1M profiles (dotted profiles).
3.2 Solvation Structure of Ions
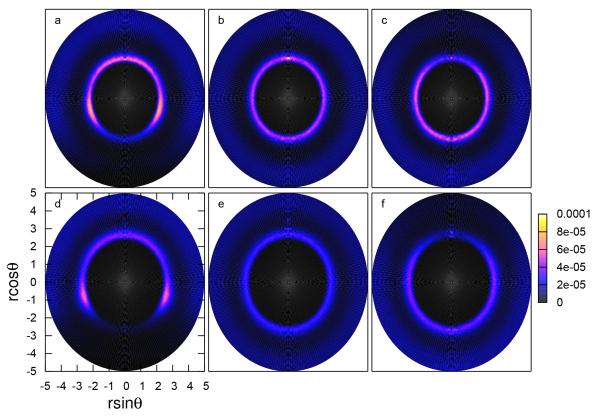
We next characterize the solvation structure around single ions in different environments via the radial angular distribution function (RADF) of water around anions at the hydrophobe-water interface, in bulk, and near the liquid-vapor (LV) interface (Figure 5). Data are represented in polar coordinates where r represents the distance between anion and water hydrogen, and θ represents the angle between the anion-hydrogen vector and z-axis. Thus defined, an anion-hydrogen angle of θ = 180° (r cosθ = −r) indicates that hydrogen is directly below the anion, whereas θ = 0° indicates hydrogen is directly above the anion.
Fig. 5.
Radial-angular distribution function (RADF) between anions with the water hydrogen atoms (a)(d) near the hydrophobe-water surface, (b)(e) bulk, and (c)(f) the liquid-vapor interface. The angle (θ) is defined between the anion-hydrogen vector and the positive z-axis.
For the RADF of I− near the plates, significant disruption of the solvation structure occurs at large angles (the lower region of the bottom left panel of Figure 5). Both the first and second solvation shells (represented by the inner and outer rings, respectively) are disrupted. We conclude that it is unlikely for hydrogen atoms to reside between the ion and the plate and that the I− is partially dehydrated at the water-hydrophobe interface.
Conversely, hydrogen atoms can be found in the first solvation shell of Cl− between this anion and the plate, although the probability of finding hydrogen in the first solvation shell is reduced in the region between the ion and the plate relative to the bulk-like region. This indicates that the water molecules prevent direct interaction between Cl− and the plates; chloride retains at least one hydration layer near the plate. These two anions have significantly different hydration free energies ( = −78.93 ± 0.08 kcal/mol and = −63.15 ± 0.15 kcal/mol in TIP4P-FQ solvent49), and a result, we anticipate I− anion’s propensity for partial desolvation. The more favorable hydration of Cl− is reflected in the intensity of the RADF in the first solvation shell (relative to I−), which suggests the strong interactions between Cl− and water. This observation can be generalized for the plate-water, bulk, and liquid-vapor environments.
The solvation structure of anions at the liquid-vapor interface is also perturbed relative to bulk water. Significant dehydration is observed for iodide in its second, and to a lesser extent, first solvation shells. Chloride maintains bulk-like hydration at the LV interface, with minor perturbation directly between the ion and the interface. The different degree of disruption in the two anions’ hydration shells is expected based on the propensity of each ion for the LV interface. Chloride remains further in the bulk than iodide66 allowing Cl− to have at least one layer of water separating the ion from the interface. Iodide, which penetrates closer to vapor, is less likely to maintain water layers that would separate it from the surface.
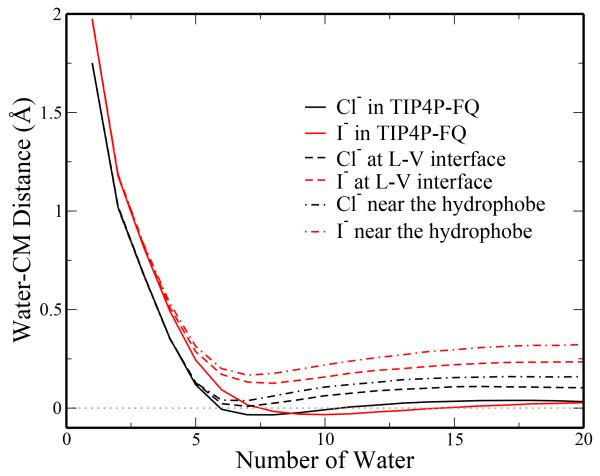
Both anions show expected isotropic structure in the bulk. As a more quantitative analysis of the isotropy/anisotropy of each anion’s solvation in different environments, we implement the approach of averaging the distance between the anion and the center of mass (COM) of the nearest n water molecules71-73. To summarize this approach, all waters are rotated into a local coordinate frame by setting the vector of anion to the closest water’s COM as the x-axis. Using the vector from the anion to the second closest water’s COM, the second water is constrained to lie in the x − y plane with positive y. The projection of third water’s COM is then made a positive value by reflection about the z-axis. The projection of all COMs along the < 1, 1, 1 > direction is determined, resulting in one-dimensional plots of distance versus the number of water. The projected values are positive when water molecules tend to accumulate in the direction of the three closest waters and negative for the opposite direction. Values of zero indicate that the center of mass of the n hydrating waters coincides with the position of the anion; that is, there is isotropic distribution of water molecules around the anion. The results are shown in figure 6 for each anion in each environment. In all environments, the hydration is strongly anisotropic when n is less than the coordination number for each anion. For the bulk profiles, the projected distances first reach zero at n = 6 for Cl− and n = 7 for I−, which are the most probable coordination numbers of the corresponding anions in the bulk (data not shown). Although these profiles take on non-zero values for larger n, the low water COM-anion distances suggest near isotropic solvation in the bulk when a sufficient number of water molecules is considered (enough to fill the first solvation shell). At the interfaces, I− exhibits a greater degree of anisotropic hydration than Cl− (evidenced by larger separation of the anion position and hydrating waters’ center of mass).
Fig. 6.
Analysis of anisotropy of ion hydration in bulk TIP4P-FQ, water-plate interface, and liquid-vapor interface. The projection of the center of mass of the closest n water molecules in a local coordinate frame is shown as a function of n. Non-zero values for this projection suggest anisotropic hydration of the ion, while values of zero indicate isotropic ion hydration.
This recapitulates I−’s partial hydration relative to Cl−. The hydration of these anions is more anisotropic near the plate-water interface than at the liquid vapor interface. This is a consequence of a more defined water structure near the hydrophobe and restricted access of water between the ion and interface. The results of this analysis are consistent with those of the radial angular distributions. We note that both nonpolarizable anions in this study show isotropic behavior in the bulk. However, only I− shows density enhancement at the interfaces. This indicates that the preference of I− for the interface can be driven by its intrinsic hydration properties, not necessarily solely by ion or water polarizability. 38,74
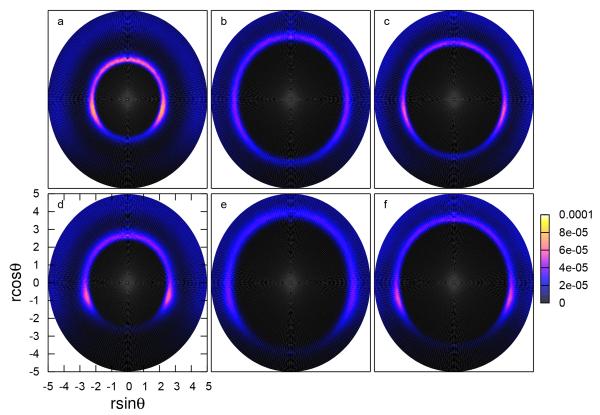
To further elucidate the solvation structure of anions near the plates, we consider the radial angular distributions for the closest water hydrogen to the anion, the water oxygen to the anion, and further water hydrogen to the anion. As shown in figure 7, the RADFs of I− are disrupted at large angles, suggesting it is unlikely to find water in the region directly between I− and the plate.
Fig. 7.
Radial angular distribution function (RADF) of anions with (a)(d) the closest hydrogen atom of neighboring, (b)(e) the water oxygen atom, and (c)(f) the farthest hydrogen atom in neighboring water.
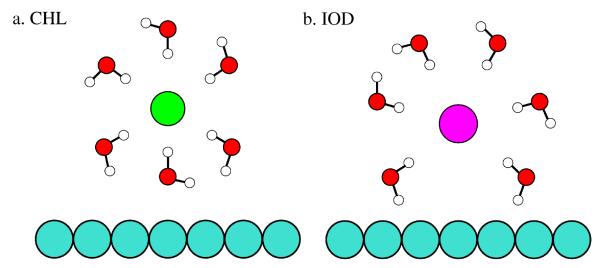
However, Cl− shows complete “rings” for any constituent water atom, implying that even though Cl− is constrained to be near the hydrophobe, we can still find intact water (not only hydrogen atoms) between Cl− and the plate. With the observations from the density profiles and these radial angular profiles, we deduce the schematic in Figure 8. Since Cl− does not reach the plates as closely as I−, water in the Cl− system (particularly the water oxygen) can get between the plate and the ion, preventing direct contact between the chloride and plate. Conversely, I− preferentially makes direct contact with the plate, restricting water from getting between the plate and ion.
Fig. 8.
Schematic of hydration structure of (a) chloride and (b) iodide near the plate. Iodide is able to more closely approach the plates than the chloride, which maintains more of its solvation shell.
3.3 Potential of Mean Force
The effect of inorganic ions on the free energetics of hydrophobe association is considered next. The potential of mean force (PMF) for hydrophobe association was calculated directly from the forces acting on a plate:
| (6) |
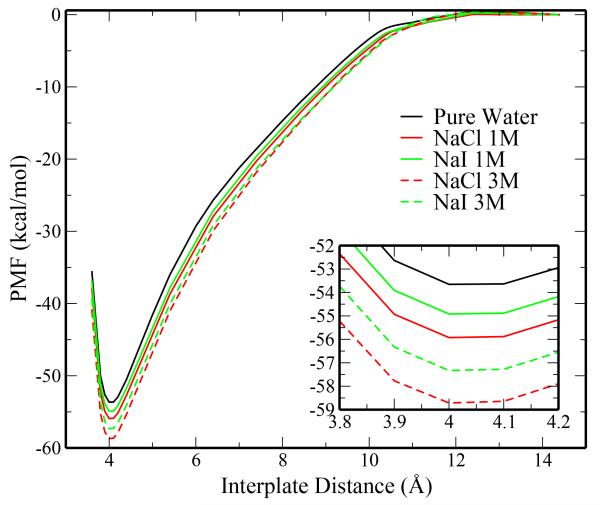
where ξ is the reaction coordinate taken as the separation distance between the two plates. We consider the average of forces ≤F (ξ)≥ acting on each plate over the sampled configurations at each separation distance; the average force used in the integration is the average of the values for the two plates after negating the forces acting on the plate located in the negative z-direction. All profiles of the PMF are shifted such that W (ξd) = 0 kcal/mol. We show the PMFs for pure TIP4P-FQ in 1M and 3M salt solutions in Figure 9. Numerical results are summarized in Table 2 and denote the difference in PMF from dissociated state to the global minimum:
| (7) |
where ξc ≈ 4.0 Å (position of plate contact minimum) and ξd = 14.4 Å (dissociated distance).
Fig. 9.
Potential of mean force for plate association in pure TIP4P-FQ, 1M NaCl, 1M NaI, 3M NaCl, and 3M NaI solutions. Inset shows the minimum region of the profiles.
Table 2.
Decomposition of potential of mean force into contributions from water, plates, anions, and cations. All values for ΔW are calculated using Equation 7 and are expressed in kcal/mol.
| System | Δ W plate | Δ W water | Δ W an | Δ W cat | Δ W tot |
|---|---|---|---|---|---|
| Pure water | −14.89 | −38.24 | 0.00 | 0.00 | −53.13 |
| NaCl 1M | −14.83 | −41.08 | −0.14 | 0.13 | −55.92 |
| NaI 1M | −14.87 | −37.67 | −2.51 | 0.13 | −54.92 |
| NaCl 3M | −14.87 | −43.44 | −0.77 | 0.37 | −58.72 |
| NaI 3M | −14.87 | −37.25 | −5.61 | 0.40 | −57.33 |
All salt solutions show a reduced PMF for plate association relative to pure TIP4P-FQ water, with NaCl solutions showing a more negative PMF than the NaI solutions (−55.92 compared to −54.92 kcal/mol). Minima are further reduced in the 3M solutions with ΔW =−58.72 kcal/mol for 3M NaCl and ΔW =−57.33 kcal/mol for 3M NaI. We emphasize here that our concern in this paper is the description of the mechanisms leading to the relative differences in the association strengths of hydrophobes in different salts. Thus, we do not consider the shift of the pmfs to lower values relative to water as detracting from the validity of the following discussion. Furthermore, the stronger hydrophobe association in the salt solutions, allowing that ion interfacial propensity contributes to stronger hydrophobe association relative to that in pure water, is connected to the fact that the ion models used in this study in conjunction with the TIP4P-FQ water model have stronger (more negative) hydration free energies than experiment.
We next explore the origins of the differences in the potential of mean force profiles by considering the contributions from each solution component to the PMF:
| (8) |
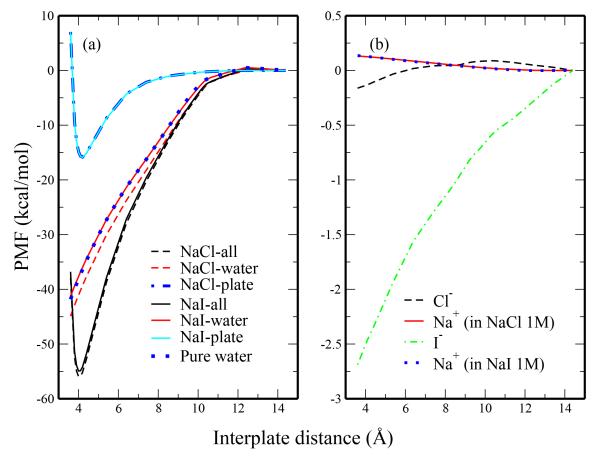
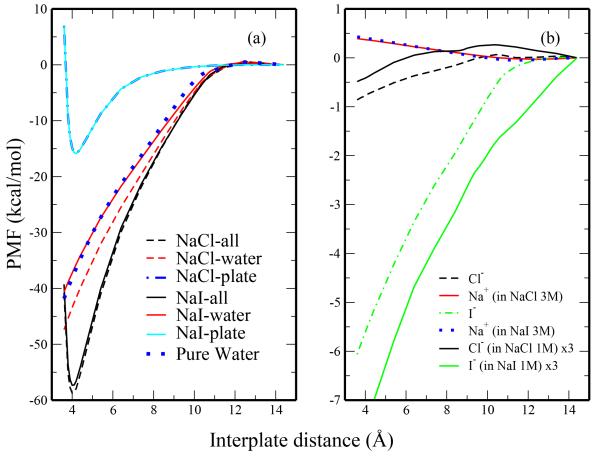
where each contribution is calculated from the forces on the plates arising from each component and X− = Cl−,I−. Results are shown in Figure 10 and Figure 11 for the 1M and 3M solutions, respectively; numerical values are shown in Table 2.
Fig. 10.
Decomposition of potential of mean force for plate association in 1M salt solution and pure TIP4P-FQ. The left panel includes the total PMF, the water contribution, and the contribution arising from the plates. The right panel consists of the anion and cation contributions.
Fig. 11.
Decomposition of potential of mean force for plate association in 3M salt solution and pure TIP4P-FQ. The left panel includes the total PMF, the water contribution, and the contribution arising from the plates. The right panel consists of the anion and cation contributions as calculated from 3M solutions. Predicted contributions from each ion determined by scaling the 1M solution results by a factor of 3 are also shown in panel b.
In all cases water represents the largest contribution to the PMF, with the plate contribution having the second largest contribution. Since the plate coordinates are fixed throughout the course of the simulation for each separation distance and the plate-plate interactions are the same in all systems, the plate contribution to the PMFs is essentially the same in all systems. Slight differences in plate contributions between 1M and 3M solutions (not observable with the resolution provided in Figure 10 and Figure 11) are due to differences in the specific separation distances sampled. Thus, any differences in the PMF for our systems are solvent (water and ions) driven. Comparing the water contributions in the pure TIP4P-FQ and 1M solutions, we observe that the water contribution in NaCl solution is more favorable than in pure water by approximately 3 kcal/mol at a distance of 4.0 Å (Figure 10a). Furthermore, the water contribution in the pure water and 1M NaI solutions are similar to each other showing less than 1 kcal/mol difference at the associated separation distance (Figure 10a). While multiple explanations have been offered for the different effects of Hofmeister series ions, the ability of ions to influence the structure of water is perhaps the oldest and the most commonly used. Recent studies39,40, however, suggest that the distinction of Hofmeister ions as either kosmotropes (structure-makers) or chaotropes (structure-breakers) is not general. We suggest that the differences in the water contribution in 1M NaCl and 1M NaI solutions are due to the spatial constraints ions place on the water density at a given position near the plates. Recalling the differences in water density in different solutions of different salts (Figure 2a and d), the NaCl solution and pure water show similar water density at short distances and deviate at longer distances. The increased density of chloride at these larger distances reduces the amount of water that can access this volume. Water molecules in this region are considered to have attractive dispersion interactions with the plates; that is, water in this region exerts a force on the plates working to pull them apart. By reducing the water in this region (in the case of the 1M NaCl solution relative to pure water), the resistance against plate dimerization is reduced, resulting in a more favorable water-induced contribution to the PMF. In the 1M NaI solution, on the other hand, demonstrated reduced water density at both short and longer distances. The displacement of water at short distances effectively reduces the number of repulsive water interactions with the plate (water molecules with distances on the repulsive wall of the Lennard Jones potential). Such water molecules would drive a strong plate-plate association. Iodide’s displacement of both attractive and repulsive water molecules leads to minimal net difference on the forces driving plate-plate association. In fact, the water contribution is higher for the NaI system than the pure water system, whereas the total PMF for NaI is slightly lower than that of pure water. Differences in the overall PMFs for 1M NaI solution and pure TIP4P-FQ must then have significant contributions arising from ions. As shown in Figure 10b, iodide provides a significant contribution (~ −2 kcal/mol) to the PMF. Chloride does not show as significant of a contribution. Again, we attribute these results to the ion density near the plate. Iodide, which is expelled from the water towards the plate-water interface, can be thought of as being “pushed” into the plates (exerting a subsequent pushing force on the plate) and resulting in a greater force towards plate-dimerization. Chloride, due to its smaller size and more favorable hydration free energy, is not as readily expelled from the solution and exhibits less of a force on the plates. The sodium ions show only a weak (WNa+ = 0.1 kcal/mol) influence on the overall PMF. Furthermore, the sodium contributions in each NaCl and NaI are very similar. These observations are not surprising since the cations are considerably separated from the plates and the density of cations in the 1M salt solutions are relatively consistent with each other. In the case of 1M NaCl, the anion and cation contributions effectively offset each other, the water contribution thus dominating.
The 3M salt solutions show more favorable plate-plate association than the 1M salt solutions. We examine the origins of these differences in the decomposed PMFs in Figure 11. Again, the plate contributions are the same in all systems. The water contribution in 3M NaCl is reduced relative to the pure water case, which is consistent with observations from the 1M solutions. The water contribution in 3M NaI is slightly less favorable relative to that in pure TIP4P-FQ. The most notable differences in the decomposed PMFs arise from changes in the anion contribution (Figure 11b). For ease of comparison, we include the 1M results (multiplied by a factor of three) as dashed lines. The 3M profiles deviate from the scaled 1M profiles, with Cl− showing a more negative contribution than expected and I− showing a less negative contribution than expected. These observations are consistent with the differences between calculated and predicted 3M anion density profiles, further supporting the relationship between anion contribution to the PMF and its interfacial density. Our analysis supports recent experimental26 and theoretical31 studies suggesting different mechanisms influencing assembly and the Hofmeister series. We observe that Cl− does not significantly perturb the water molecules solvating the hydrophobic solute, but it displaces the water just beyond the first solvation shell. Conversely, the weakly hydrated (partially dehydrated) I− interacts directly with the hydrophobic surface, displacing water molecules hydrating the solute. From their simulations using polarizable and non-polarizable force fields, Heyda et al. observe an attraction of heavy halides (Br−, I−) to the hydrophobic methyl groups of N-methylacetamide.33 Furthermore, the work of Pegram and Record suggests that the partial dehydration of weakly hydrated ions near hydrophobic surfaces may influence their ion specific effects.31
3.4 Hydrophobic Confinement and Wetting/Dewetting
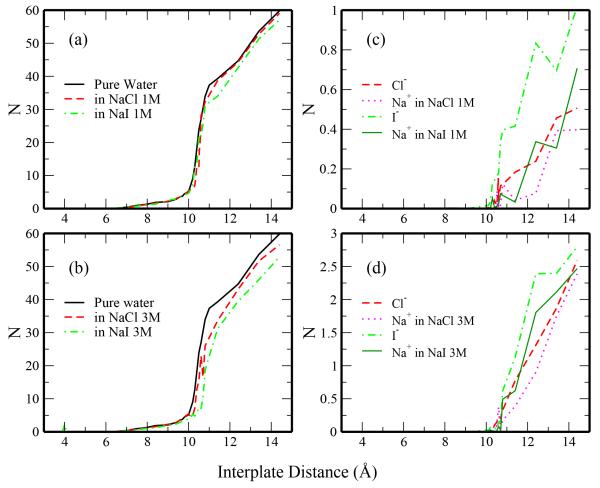
Finally, we consider differences in the systems when under hydrophobic confinement in the region between the plates. In Figure 12 we consider the average number of water molecules, anions, and cations between the plates as a function of the separation distance. We restrict sampling to a confined cylinder of radius = 8Å (in the x, y-direction and centered about the origin) with length equal to the separation distance between the two plates. Figure 12a shows the variation of the confined water with increasing distance. In qualitative agreement with previous studies of pure water under hydrophobic confinement,54,55 this profile increases sharply near the critical distance where wetted and dewetted states are equally favorable.
Fig. 12.
Salt solutions under hydrophobic confinement. The number of water molecules confined between the plates as a function of plate separation distance are shown in Panels a and b for 1M and 3M salt solutions, respectively. Analogous profiles showing the number of each ion are shown in Panels c and d for 1M and 3M salt solutions. A sharp increase in the number of confined molecules (z = 10 − 11 Å) indicates the critical region for wetting/dewetting transitions.
Confined water in the 1M NaI solution deviates significantly from the 1M NaCl and pure water systems, showing a reduction in the number of confined waters at separation distances around 10Å. We attribute this difference to the onset of ion penetration into this region at these distances (Figure 12c). Iodide shows greater extent of permeation into the confined region than chloride. Despite being a larger ion, iodide enters the confined region at lower separation distances (as low as 9.8Å) than chloride. This is attributed to the stronger solvation of chloride which would prevent it from entering this region without significant room to accommodate its hydrating waters. Following from this reasoning, sodium (which has the most favorable solvation free energy of all the ions considered) shows the lowest occupancy of this region for distances less than 11Å. Significant differences are noticed for the sodium profiles in the NaCl and NaI solutions. Interestingly, the features of the sodium ions qualitatively mimic those of the corresponding anions. This suggests some degree of ion pairing that works to increase the stability of the ions in this region.
The increased affinity of the larger (and less charge dense) iodide for the region confined between the plates may influence the strength of association since these ions need to be removed from the plate surface in order to reach the associated state.75 While such effects may contribute to the observed differences in PMFs, significantly different forces on the plates due to water at associated plate separation distances (with no ions between the plates) are observed for the different salt solutions. This suggests that the ions’ influence on the waters hydrating the plates is the dominant factor dictating the depth of the PMF.
The interior water profiles for the 3M NaCl and 3M NaI systems are shifted to larger separations relative to the pure water profile than was observed for the 1M solutions. Additionally, the water density is significantly reduced in the salt solutions relative to pure water at distances d > 10 Å; this is due to increased ionic concentration in the confined region.
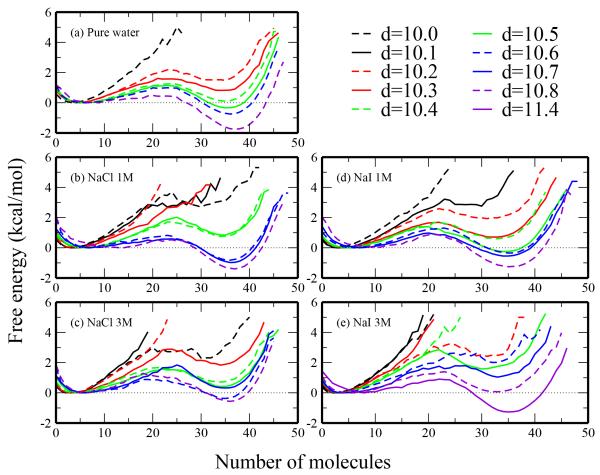
Based on the results presented in Figure 12 it is clear that the presence of ions in solution influences the behavior of each system near the critical distance. To further investigate this, we consider the relative free energies of filled and unfilled interior states at near-critical distances for all the solutions studied. For this analysis, we first determined the probability of finding N water molecules between the plates at a given separation distance. The free energy associated with having a given number of molecules between the plates can then be calculated as:
| (9) |
where P (N, d) is the probability of finding a given number of water molecules between the plates at a given separation distance. Profiles are expressed relative to P0(N0, d), the probability associated with the most common number of water for an unfilled state at a given separation distance. Results of these profiles are shown in Figure 13. Many of the profiles exhibit bimodal behavior, indicating both filled and unfilled interior regions can be observed at the corresponding plate-separation distance, and the confined systems oscillate between filled and unfilled states.76
Fig. 13.
Free energetics of wetting/dewetting the region between the plates. Free energy is calculated from the probability of finding a given number of water molecules between the plates at a specified separation distance. Results are shown for (a) pure TIP4P-FQ, (b) 1M NaCl, (c) 3M NaCl, (d) 1M NaI, (e) 3M NaI. All profiles are shown relative to the free energy of the most favorable unfilled state.
We consider the relative energetics of the filled and unfilled states as the difference of the respective minima in Table 3. At low separation distances, the unfilled states are favorable relative to the filled states; filled states become more favorable as separation distance increases. At the critical distance, we expect the filled and unfilled states to be equally probable (ΔΩu→f = 0 kcal/mol). We predict the critical distance from a linear regression of the ΔΩu→f versus d data as the point when the fitted line coincides with ΔΩ = 0. The 1M NaCl, 1M NaI, and 3M NaCl systems have similar critical distances as pure water (within 0.1 Å), whereas 3M NaI critical distance is increased to 10.8 Å. These results qualitatively agree with the interior water profiles in figure 12.
Table 3.
Free energy of states with a wet interior relative to the free energy of a dewetted interior at several near-critical distances for the systems studied (expressed in kcal/mol). The predicted location of the critical distance is also shown.
| System | Δ Ω u→f,10.2 | Δ Ω u→f,10.3 | Δ Ω u→f,10.4 | Δ Ω u→f,10.5 | Δ Ω u→f,10.6 | Δ Ω u→f,10.8 | dc (Å) |
|---|---|---|---|---|---|---|---|
| TIP4P-FQ | 1.49 | 0.82 | 0.11 | −0.33 | −0.74 | −1.75 | 10.45 |
| 1M NaCl | 0.76 | 0.84 | −0.82 | −1.40 | 10.55 | ||
| 3M NaCl | 1.84 | 0.71 | 0.43 | −0.37 | −0.56 | 10.55 | |
| 1MNaI | 1.93 | 0.71 | 0.60 | −0.24 | −0.35 | −1.25 | 10.47 |
| 3MNaI | 2.41 | 1.59 | 2.01 | 0.06 | 10.83 |
In addition to relative energetics of filled/unfilled states, we consider the energetics of water and ions entering the hydrophobically confined region. These species can enter the confined region through movement in the xy directions. Initially, we can consider the radial density extending in two dimensions of the water molecules and ions at a distance r from the line described by x = 0, y = 0. In order to consider only species relevant to confinement, we limit the sampling in the z-direction. Whereas, we have previously sampled z = ±d/2, where d is the plate-plate separation distance symmetric about the plane z = 0, we limit the sampling in the present analysis to z = ±d/2 − 3.6Å. Here, 3.6Å represents the σH2O,plate and is subtracted to account for excluded volume; only water molecules which would not have an unfavorable interaction with a plate atom are considered. From these density profiles, we calculate the potential of mean force for a water molecule penetrating within a distance r from the center of the confined region using the relationship
| (10) |
where , x0 = y0 = 0, and rbulk is the average density over radii far from the confined region (z = 17.0 − 18.0Å).
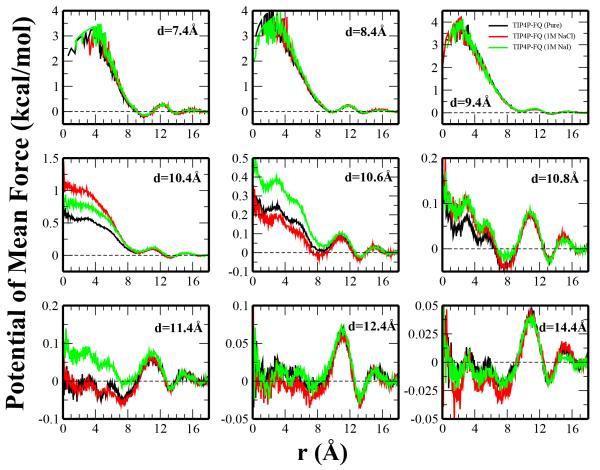
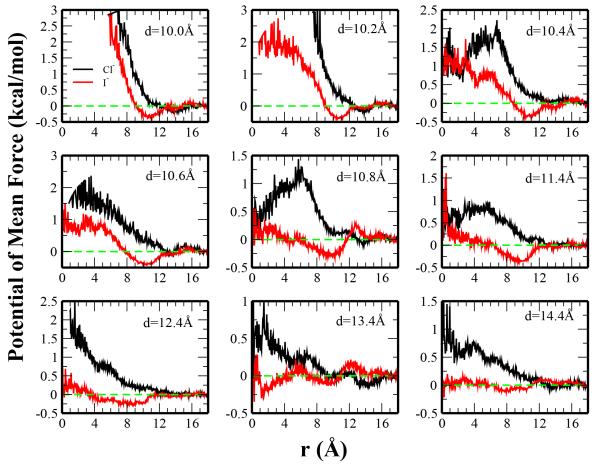
We note that in this coordinate set, r = 0 represents the interior of the confined region and r = 8Å corresponds to the cutoff radius used in the previous analyses (Figures 12-13). The PMFs for water molecules entering the hydrophobically confined region are shown in Figure 14. Analogous profiles for ions entering the confined region are shown in Figure 15.
Fig. 14.
Potential of mean force for water entering the plates as a function of their radial distance from the center of the hydrophobically confined region (x = y = 0 Å). Sampling was limited in the z-dimension to ± (d/2 − 3.6) which ensures only solvent accessible volume is considered. The PMF for d = 7.4Å (near the separation distance in which water can first enter the confined region) through d = 14.4Å (the largest separation distance sampled) are shown for water in the pure water, 1M NaCl, and 1M NaI solutions. All profiles are relative to the bulk region, which we take as the average from r = 17.0 − 18.0Å.
Fig. 15.
Potential of mean force calculated for Cl− (black) and I− (red) in 1M salt solutions as a function of radial distance from the center of the hydrophobically confined region. All profiles are shown relative to the PMF in the bulk region furthest from the confined region (the average value from r = 17.0 − 18.0Å).
The PMFs for water entering the confined region demonstrate similar qualitative behavior for pure water, 1M NaCl, and 1M NaI for various distances. At low distances (d = 7.4 − 9.4Å) there is a significant barrier in the PMF for entering the confined region. This is inherent to the unfilled states at these separations that are common to all systems. Considering the critical region (the middle row corresponding to distances of d = 10.4 − 10.8Å, the barriers are significantly reduced (by approximately 2 kcal/mol) from those experienced at a separation distance only 1Å smaller. These profiles also exhibit the most significant differences among systems, although there does not seem to be a systematic trend regarding the relative ordering of the NaCl, NaI, and pure water systems. Differences may be attributed to the presence of ions between or near the edge of the plates which may obstruct water from entering the confined region. At the larger separation distances, there is essentially no barrier for water moving from the bulk to the interior.
Considering the ion PMFs, significant differences between chloride and iodide PMFs are observed. In general, the PMF is lower for iodide than chloride between the plates (r ≤ 8 Å) which suggests the increased selectivity of the hydrophobically confined region. Regarding the iodide PMFs, a minimum of approximately −0.5 kcal/mol is observed near r = 10Å; this corresponds to a distance in which iodide interacts with the atoms on the edge of the plate. The absence of such a minimum in the chloride profiles reflects the different affinities of the two anions for the plates (as previously illustrated in Figure 8). At largest separation (d = 14.4 Å), there is no significant barrier or minimum experienced for iodide traveling laterally from bulk to the interior of the confined region; this not only suggests relative ease by which an iodide ion can enter the confined region, but also that the density of iodide between the plates is approximately the same in bulk water. The barrier in chloride’s PMF, although still present at the largest separation distance, is on the order of kT and suggests the interior region is quite accessible to chloride at this distance.
4 Discussion and Conclusions
In this study we presented results of the behavior of ions at the water-hydrophobe interface (modeled as two hydrophobic plates). The results of this study can be classified into four general categories: (1) the density of species in the direction normal to the plate-water interface, (2) the local solvation of ions in different physical environments (bulk water, water-plate interface, and water-air interface), (3) the effect of ions on association of the two hydrophobic plates, (4) the influence of ions on the wetting/dewetting of the region confined between the two plates. Similar to numerous studies of the water-air interface35,36,38,66,77,78 (including one using the water and ion force fields used in the present study66), we observe differences in the interfacial preference of iodide and chloride. Iodide, the larger of the two ions, exhibits a less favorable hydration free energy and is readily expelled from the bulk solution to the water-plate interface. Conversely, chloride does not exhibit such a significant density in this interfacial region. We note that the enhancement of iodide at the water-plate is favored over the liquid-vapor interface. Our simulation includes both water-vapor and water-plate interfaces, and throughout the course of the simulation iodide showed a reduced density in the liquid-vapor region. This is in contrast to previous studies of iodide at the liquid-vapor interface (using the same models in the absence of solvated hydrophobes) which showed a substantial enhancement of iodide in the liquid-vapor interfacial region. In the current system, however, the liquid-vapor and water-plate interfaces must “compete” for the limited ions in solutions.
Previous studies have suggested the partial dehydration of iodide at the liquid-vapor interface helps stabilize it in this region.30 Radial angular density profiles of iodide and chloride solvation and anisotropy plots of these ions in different environments suggest the hydration is disrupted more at the water-plate interface than the water-air interface (relative to bulk). Additional stability of the ions at the water-plate interface may be the result of additional dispersive interactions with plate atoms and electrostatic interactions with water (the density of which is enhanced relative to the bulk and liquid-vapor interface). When the concentration of ions in solution is increased from 1M to 3M, the density of ions near the plates is also increased. Interestingly, the density increase near the plate does not scale linearly with the increase in the number of ions in the systems; iodide shows a lower density, while chloride shows a slightly increased density as compared to the linearly scaled value. We attribute iodide’s departure from linear scaling behavior to saturation effects. There is limited surface area accessible to solvent and anion, and iodide approaching the plate will most likely retain at least some hydrating water (the iodide-water interaction is favored over iodide-iodide interactions66). Thus, the number of iodide anions that can be accommodated at the hydrophobe surface with the constraint of also supporting the presence of solvent and the anion’s solvation layer is less than the linear scaling value.
The decomposition of the PMF for hydrophobe association helped distinguish ion-specific effects on hydrophobic assembly free energetics. For the 1 molar solutions we notice two important differences arising from the composition of the solution. First, iodide shows a significant direct contribution to the PMF (approximately 2.51 kcal/mol), whereas the direct contribution from chloride is almost negligible. Next, we note that the ions induce changes in the magnitude of the water contribution to the PMF. In the case of iodide, the water contribution is slightly increased (less favorable) from the pure water contribution. Chloride induces a significant favorable water contribution to the PMF in 1M NaCl solution relative to pure water. We attribute these differences to the proximity of the ions to the hydrophobic surface and the displacement of water in the vicinity of the plates. Iodide, which is preferentially driven from the bulk solution due to less favorable hydration free energy, has a high density near the plate and directly forces the plates together through Van der Waals repulsion. Chloride remains separated from the plate by a layer of water and mostly occupies regions in which water molecules would exert an attractive force on the plates. Therefore, when these water molecules are displaced by chloride, such forces resisting plate association are reduced and the water contributes to a more favorable assembly. By occupying the region closest to the plate, iodide displaces water that would push the plates together. However, the water density in the “attractive” water region is also reduced relative to pure water. The displacement of both “attractive” and “repulsive” water in the NaI solution effectively counteract (although the slightly increased water-induced PMF suggests the displacement of “repulsive” water is more prevalent. Contributions from the plates are essentially the same in all solvents (water, 1M NaCl, and 1M NaI) since the plate-plate interaction is the same in all instances. Furthermore, contributions arising from the cations are quite negligible and similar in the two 1M salt solutions. The ion specific mechanism deduced in this study agrees with a recent explanation of the anion Hofmeister series in which different mechanisms involving direct interactions between anions with macromolecules or the influence on hydration layers immediately solvating the macromolecules help distinguish the ion-specific effects.15,25,26 The combined effect of these contributions leads to a reduction of the PMF in both salt solutions. This may be due in part to the influence of the cation on water solvating the plates. Sodium is known to have a “salting-in” effect, and as a result, may indirectly influence a more favorable PMF in both salt solutions. Future studies probing cation-specific effects would help elucidate the extent to which sodium contributes to the water-induced PMF in the current study; we expect the cation effect to be less pronounced than that for anions, however.25 Results from simulations of salts in higher concentration (3M) showed further reduction in the PMF. Most notably, the contributions from the anions were more favorable than the 1M case and agreed at least qualitatively with the increases in anion density at the plate-water interface.
Another facet of this study was to examine the propensity of anions for the hydrophobically confined region. Despite its larger size, iodide is able to populate the confined region at smaller plate separation distances; it also demonstrates greater presence as the separation distance is increased. We attribute this selectivity to the relative ease in which iodide can shed its hydration shell to interact with the plate whereas chloride experiences a greater penalty for desolvation. The chloride’s solvation shell results in a larger effective size that makes it more difficult to enter such confined regions. Such selectivity can be exploited in the development of filtration/desalination processes and may have general implications for biological ion channels.79-84 It is interesting to note the presence of ions also influenced the critical distance for wetting/dewetting of the interior region. The most pronounced difference (relative to pure water) was observed in the 3M NaI solution in which the critical distance increased from 10.5 to 10.8 Å. This may be the result of spatial constraints arising from a larger concentration of iodide in the confined region.
In this study, we considered only the solvent as polarizable (using the TIP4P-FQ potential53), while ions were treated as non-polarizable. This decision was made in part to examine the influence of a well-characterized49,65,66 ion-water potential that showed differences in the density of the anions in the air-water interface. The results of this study are expected to be influenced (at least to some extent) by the treatment of ion polarizability. Numerous studies have shown the increased propensity of anions (notably chloride, bromide, and iodide) for the water-air interface once they were treated as polarizable particles.36,66,77 In the context of intriguing results from Wick and Xantheas74, ion polarizability is known to increase the anisotropic solvation of ions in the bulk phase, leaving a depleted solvation region. They concluded the influenced hydrophobic nature of the ion due to the cavity and the need to desolvate the cavity may be a driving force for it to the water-air interface. We have shown that although our non-polarizable anions are isotropically solvated in the bulk, a natural depletion of first and second solvation shell waters occurs for iodide (and chloride to a lesser extent). This suggests that polarizable anions should be expected to populate the plate surface to a greater extent than analogous non-polarizable ions. A recent study of ions near carbon nanotubes81 suggest incorporating polarizability (for both water and ions) increases the relative abundance of iodide at the water-carbon nanotube interface both within at the openings. The inclusion of polarizability in that study also led to a slight shift of the iodide towards the nanotube surface. With respect to the connections made in this paper regarding the influence of ions on hydrophobic association, we would expect some interesting differences to arise in the PMF contributions when ion polarizability is treated. Primarily, increased concentrations of iodide and chloride at the hydrophobe surface (at closer distances) are expected to lead to more direct contributions of the anions to the PMF; that is, the anion contribution to the PMF would be more favorable as the ions are “pushed” into the plates more readily. Cations would also be expected to have a more significant influence on the PMF when treating ion polarizability. High concentrations of negatively charged anions at the plate surface would draw an increased concentration of cations to the plates, such as the electric double-layer observed at the liquid-vapor interface.36,66,77 Such changes are expected to further influence the structure and density of water near the plates, and consequently the water-contribution to the PMF. Certainly, the association of these large scale is determined by the accumulation of forces that can arise from very subtle changes in the solvating medium. Neglecting ion polarizability in the current study may explain why we see an apparent shifting of the Hofmeister effects (with the often assumed Hofmeister-neutral chloride exhibiting salting-out effects).
Supplementary Material
Acknowledgments
The authors acknowledge support from the National Institutes of Health (COBRE:5P20RR017716-08) at the University of Delaware, Department of Chemistry and Biochemistry. B.A.B. acknowledges additional support from a Graduate Fellows Award at the University of Delaware.
References
- 1.Frolov AI, Rozhin AG, Fedorov MV. Chem. Phys. Chem. 2010;11:2612–2616. doi: 10.1002/cphc.201000231. [DOI] [PubMed] [Google Scholar]
- 2.Lin S, Blankschtein D. J. Phys. Chem. B. 2010;2010:15616–15625. doi: 10.1021/jp1076406. [DOI] [PubMed] [Google Scholar]
- 3.Zelada-Guillen GA, Riu J, Duzgun A, Rius FX. Angew. Chem. Int. Ed. 2009;48:7334–7337. doi: 10.1002/anie.200902090. [DOI] [PubMed] [Google Scholar]
- 4.Zelada-Guillen GA, Riu J, Duzgun A, Rius FX. Angew. Chem. 2009;121:7470–7473. doi: 10.1002/anie.200902090. [DOI] [PubMed] [Google Scholar]
- 5.Chen RJ, Bangsaruntip S, Drouvalakis KA, Kam NWS, Shim M, Li Y, Kim W, Utz PJ, Dai H. Proc. Nat. Aca. Sci. 2003;100:4984–4989. doi: 10.1073/pnas.0837064100. [DOI] [PMC free article] [PubMed] [Google Scholar]
- 6.Vaisman L, Wagner HD, Marom G. Adv. Coll. Int. Sci. 2006;128:37–46. doi: 10.1016/j.cis.2006.11.007. [DOI] [PubMed] [Google Scholar]
- 7.Moore VC, Strano MS, Haroz EH, Hauge RH, Smalley RE, Schimdt J, Talmon Y. Nano Lett. 2003;3:1379–1382. [Google Scholar]
- 8.Xu Z, Yang X, Yang Z. Nano Lett. 2010;10:985–991. doi: 10.1021/nl9041005. [DOI] [PubMed] [Google Scholar]
- 9.Angelikopoulos P, Beck H. J. Phys. Chem. Lett. 2011;2:139–144. [Google Scholar]
- 10.Hofmeister F. Arch. Exp. Pathol. Pharmakol. 1888;24:247–260. [Google Scholar]
- 11.Kurutz JW, Xu S. Langmuir. 2001;17:7323–7326. [Google Scholar]
- 12.Neagu A, Neagu M, Dńr A. Biophy. J. 2001;81:1285–1294. doi: 10.1016/S0006-3495(01)75786-4. [DOI] [PMC free article] [PubMed] [Google Scholar]
- 13.Tadeo X, López-Méndez B, Castaño D, Millet O. Biophy. J. 2009;97:2595–2603. doi: 10.1016/j.bpj.2009.08.029. [DOI] [PMC free article] [PubMed] [Google Scholar]
- 14.Kunz W, Henle J, Ninham BW. Curr. Opin. Colloid Inter. Sci. 2004;9:19–37. [Google Scholar]
- 15.Zhang Y, Cremer PS. Annu. Rev. Phys. Chem. 2010;61:63–83. doi: 10.1146/annurev.physchem.59.032607.093635. [DOI] [PubMed] [Google Scholar]
- 16.dos Santos AP, Diehl A, Levin Y. Langmuir. 2010;13:10778–10783. doi: 10.1021/la100604k. [DOI] [PubMed] [Google Scholar]
- 17.Zhu S, Elcock AH. J. Chem. Theory Comput. 2010;6:1293–1306. [Google Scholar]
- 18.Thomas AS, Elcock AH. J. Am. Chem. Soc. 2007;129:14887–14898. doi: 10.1021/ja073097z. [DOI] [PubMed] [Google Scholar]
- 19.Collins KD, Washabaugh MW. Q. Rev. Biophys. 1985;18:323–422. doi: 10.1017/s0033583500005369. [DOI] [PubMed] [Google Scholar]
- 20.Horinek D, Serr A, Bonthuis DJ, Bostrom M, Kunz W, Netz RR. Langmuir. 2008;24:1271–1283. doi: 10.1021/la702485r. [DOI] [PubMed] [Google Scholar]
- 21.Ghosh T, Kalra A, Garde S. J. Phys. Chem. B. 2005;109:642–651. doi: 10.1021/jp0475638. [DOI] [PubMed] [Google Scholar]
- 22.Godawat R, Jamadagni SN, Garde S. J. Phys. Chem. B. 2010;114:2246–2254. doi: 10.1021/jp906976q. [DOI] [PubMed] [Google Scholar]
- 23.Zangi R, Hagen M, Berne BJ. J. Am. Chem. Soc. 2007;129:4678–4686. doi: 10.1021/ja068305m. [DOI] [PubMed] [Google Scholar]
- 24.Collins KD. Methods. 2004;34:300–311. doi: 10.1016/j.ymeth.2004.03.021. [DOI] [PubMed] [Google Scholar]
- 25.Zhang Y, Cremer PS. Curr. Opin. Chem. Bio. 2006;10:658–663. doi: 10.1016/j.cbpa.2006.09.020. [DOI] [PubMed] [Google Scholar]
- 26.Zhang YJ, Furyk S, Bergbreiter DE, Cremer PS. J. Am. Chem. Soc. 2005;127:14505–14510. doi: 10.1021/ja0546424. [DOI] [PubMed] [Google Scholar]
- 27.Chen X, Flores SC, Lim S, Zhang Y, Kherb J, Cremer PS. Langmuir. 2010;26:16447–16454. doi: 10.1021/la1015862. [DOI] [PubMed] [Google Scholar]
- 28.Levin Y, dos Santos AP, Diehl A. Phys. Rev. Lett. 2009;103:257802. doi: 10.1103/PhysRevLett.103.257802. [DOI] [PubMed] [Google Scholar]
- 29.Zangi R, Berne BJ. J. Phys. Chem. B. 2006;110:22736–22741. doi: 10.1021/jp064475+. [DOI] [PubMed] [Google Scholar]
- 30.Wick CD, Xantheas SS. J. Phys. Chem. B. 2009;113:4141–4146. doi: 10.1021/jp806782r. [DOI] [PubMed] [Google Scholar]
- 31.Pegram LM, Record MT., Jr. J. Phys. Chem. B. 2007;111:5411–5417. doi: 10.1021/jp070245z. [DOI] [PubMed] [Google Scholar]
- 32.Pegram LM, Record MT., Jr. J. Phys. Chem. B. 2008;112:9428–9436. doi: 10.1021/jp800816a. [DOI] [PMC free article] [PubMed] [Google Scholar]
- 33.Heyda J, Vincent JC, Tobias DJ, Dzubiella J, Jungwirth P. J. Phys. Chem. B. 2010;114:1213–1220. doi: 10.1021/jp910953w. [DOI] [PubMed] [Google Scholar]
- 34.Jungwirth P, Tobias DJ. Chem. Rev. 2006;106:1259–1281. doi: 10.1021/cr0403741. [DOI] [PubMed] [Google Scholar]
- 35.Jungwirth P, Tobias DJ. J. Phys. Chem. B. 2002;106:6361–6373. [Google Scholar]
- 36.Jungwirth P, Tobias DJ. J. Phys. Chem. B. 2001;105:10468–10472. [Google Scholar]
- 37.Horinek D, Netz RR. Phys. Rev. Lett. 2007;99:226104. doi: 10.1103/PhysRevLett.99.226104. [DOI] [PubMed] [Google Scholar]
- 38.Horinek D, Herz A, Vrbka L, Sedlmeier F, Mamatkulov SI, Netz RR. Chem. Phys. Lett. 2009;479:173–183. [Google Scholar]
- 39.Zangi R. J. Phys. Chem. B. 2010;114:643–650. doi: 10.1021/jp909034c. [DOI] [PubMed] [Google Scholar]
- 40.Omta AW, Kropman MF, Wouthersen S, Bakker HJ. Science. 2003;301:347–349. doi: 10.1126/science.1084801. [DOI] [PubMed] [Google Scholar]
- 41.Yeh V, Broering JM, Romanyuk A, Chen B, Chernoff YO, Bommarius AS. Prot. Sci. 2010;19:47–56. doi: 10.1002/pro.281. [DOI] [PMC free article] [PubMed] [Google Scholar]
- 42.Suhre MH, Hess S, Goiser AV, Scheibel T. J. Inorg. Biochem. 2009;103:1711–1720. doi: 10.1016/j.jinorgbio.2009.09.021. [DOI] [PubMed] [Google Scholar]
- 43.Bocharova OV, Breydo l., Sainikov VV, Baskakov IV. Biochemistry. 2005;44:6776–6787. doi: 10.1021/bi050251q. [DOI] [PubMed] [Google Scholar]
- 44.Baldwin RL. Biophy. J. 1996;71:2056–2063. doi: 10.1016/S0006-3495(96)79404-3. [DOI] [PMC free article] [PubMed] [Google Scholar]
- 45.Bostrom M, Williams DR, Ninham BW. Eur. Phys. J. E. 2004;13:239–245. doi: 10.1140/epje/i2003-10072-0. [DOI] [PubMed] [Google Scholar]
- 46.Bostrom M, Williams DR, Ninham BW. Prot. Sci. 2003;19:47–56. [Google Scholar]
- 47.Jungwirth P, Tobias DJ. J. Phys. Chem. A. 2002;106:379–383. [Google Scholar]
- 48.Brown MA, D’Auria R, Kuo LFW, Krisch MJ, Starr DE, Bluhm H, Tobias DJ, Hemminger JC. Phys. Chem. Chem. Phys. 2008;10:4778–4784. doi: 10.1039/b807041e. [DOI] [PubMed] [Google Scholar]
- 49.Warren GL, Patel S. J. Chem. Phys. 2007;127:064509. doi: 10.1063/1.2771550. [DOI] [PubMed] [Google Scholar]
- 50.Brooks BR, Brooks CL, III, MacKerell AD, Jr., Nilsson L, Petrella RJ, Roux B, Won Y, Archontis G, Bartels C, Boresch S, Caflisch A, Caves L, Cui Q, Dinner AR, Feig M, Fisher S, Gao J, Hodoscek M, IM W, Kuczera K, Lazaridis T, Ma J, Ovchinnikov V, Paci E, Pastor RW, Post CB, Pu JZ, Schaefer M, Tidor B, Venable RM, Woodcock HL, Wu X, Yang W, York DM, Karplus M. J. Comp. Chem. 2009;30:1545–1614. doi: 10.1002/jcc.21287. [DOI] [PMC free article] [PubMed] [Google Scholar]
- 51.Patel S, Zhong Y, Bauer BA, Davis JE. J. Phys. Chem. B. 2009;113:9241–9254. doi: 10.1021/jp900446f. [DOI] [PMC free article] [PubMed] [Google Scholar]
- 52.Bauer BA, Patel S. J. Chem. Phys. 2009;131:084709. doi: 10.1063/1.3200869. [DOI] [PMC free article] [PubMed] [Google Scholar]
- 53.Rick SW, Stuart SJ, Berne BJ. J. Chem. Phys. 1994;101:6141–6156. [Google Scholar]
- 54.Zangi R, Berne BJ. J. Phys. Chem. B. 2008;112:8634–8644. doi: 10.1021/jp802135c. [DOI] [PubMed] [Google Scholar]
- 55.Bauer BA, Patel S. J. Phys. Chem. B. 2010;114:8107–8117. doi: 10.1021/jp101995d. [DOI] [PMC free article] [PubMed] [Google Scholar]
- 56.Eun C, Berkowitz ML. J. Phys. Chem. B. 2010;114:13410–13414. doi: 10.1021/jp1072654. [DOI] [PubMed] [Google Scholar]
- 57.Zangi R. J. Phys. Chem. B. 2011;115:2303–2311. doi: 10.1021/jp1090284. [DOI] [PubMed] [Google Scholar]
- 58.Li X, Li J, Eleftheriou M, Zhou R. J. Am. Chem. Soc. 2006;128:12439–12447. doi: 10.1021/ja057944e. [DOI] [PubMed] [Google Scholar]
- 59.Werder T, Walther JH, Jaffe RL, Halicioglu T, Koumoutsakos P. J. Phys. Chem. B. 2003;107:1345–1352. [Google Scholar]
- 60.Choudhury N, Pettitt BM. J. Am. Chem. Soc. 2005;127:3556–3567. doi: 10.1021/ja0441817. [DOI] [PubMed] [Google Scholar]
- 61.Hua L, Zangi R, Berne BJ. J. Phys. Chem. C. 2009;113:5244–5253. [Google Scholar]
- 62.Wang L, Friesner RA, Berne BJ. J. Phys. Chem. B. 2010;114:7294–7301. doi: 10.1021/jp100772w. [DOI] [PMC free article] [PubMed] [Google Scholar]
- 63.Lu L, Berkowitz ML. Mol. Phys. 2006;104:3607–3617. [Google Scholar]
- 64.Lamoureux G, Roux B. J. Phys. Chem. B. 2006;110:3308–3322. doi: 10.1021/jp056043p. [DOI] [PubMed] [Google Scholar]
- 65.Warren GL, Patel S. J. Phys. Chem. B. 2008;112:11679–11693. doi: 10.1021/jp8038835. [DOI] [PMC free article] [PubMed] [Google Scholar]
- 66.Warren GL, Patel S. J. Phys. Chem. C. 2008;112:7455–7467. doi: 10.1021/jp8038835. [DOI] [PMC free article] [PubMed] [Google Scholar]
- 67.Darden T, York D, Pedersen L. J. Chem. Phys. 1993;98:10089–10092. [Google Scholar]
- 68.Ryckaert JP, Ciccotti G, Berendsen HJC. J. Comp. Phys. 1977;23:327–341. [Google Scholar]
- 69.Nosé S. Mol. Phys. 1984;52:255–268. [Google Scholar]
- 70.Ottosson N, Heyda J, Wernersson E, Pokapanich W, Svensson S, Winter B, Öhrwall G, Jungwirth P, Björneholm O. Phys. Chem. Chem. Phys. 2010;12:10693–10700. doi: 10.1039/c0cp00365d. [DOI] [PubMed] [Google Scholar]
- 71.Carignano MA, Karlstrom G, Linse P. J. Phys. Chem. B. 1997;101:1142–1147. [Google Scholar]
- 72.Rangei S, Klein ML. J. Chem. Phys. 2002;116:196–202. [Google Scholar]
- 73.Rogers DM, Beck TL. J. Chem. Phys. 2010;132:014505. doi: 10.1063/1.3280816. [DOI] [PubMed] [Google Scholar]
- 74.Wick CD, Xantheas SS. J. Phys. Chem. B. 2009;113:4141–4146. doi: 10.1021/jp806782r. [DOI] [PubMed] [Google Scholar]
- 75.Graziano G. Chem. Phys. Lett. 2010;491:54–58. [Google Scholar]
- 76.Xu L, Molinero V. J. Phys. Chem. B. 2010;114:7320–7328. doi: 10.1021/jp102443m. [DOI] [PubMed] [Google Scholar]
- 77.Vrbka L, Mucha M, Minofar B, Jungwirth P, Brown EC, Tobias DJ. Curr. Opin. Colloid Inter. Sci. 2004;9:67–73. [Google Scholar]
- 78.Dang LX. J. Phys. Chem. B. 2002;106:10388–10394. [Google Scholar]
- 79.Cannon JJ, Tang D, Hur N, Kim D. J. Phys. Chem. B. 2010;114:12252–12256. doi: 10.1021/jp104609d. [DOI] [PubMed] [Google Scholar]
- 80.Song C, Corry B. J. Phys. Chem. B. 2009;113:7642–7649. doi: 10.1021/jp810102u. [DOI] [PubMed] [Google Scholar]
- 81.Beu TA. J. Chem. Phys. 2010;132:164513. doi: 10.1063/1.3387972. [DOI] [PubMed] [Google Scholar]
- 82.Cazade PA, Dweik J, Coasne B, Henn F, Palmeri J. J. Phys. Chem. C. 2010;114:12245–12257. [Google Scholar]
- 83.Hilder TA, Gordon D, Chung S. J. Chem. Phys. 2011;134:045103. doi: 10.1063/1.3524310. [DOI] [PubMed] [Google Scholar]
- 84.Thomas M, Jayatilaka D, Corry B. Biophy. J. 2011;100:60–69. doi: 10.1016/j.bpj.2010.11.022. [DOI] [PMC free article] [PubMed] [Google Scholar]
Associated Data
This section collects any data citations, data availability statements, or supplementary materials included in this article.


