

Abstract
Objective:
Many states and local communities have enacted social host (SH) laws to reduce underage drinking in private settings. However, little is known about whether such laws are effective. This study examined relationships between city SH laws and underage drinking in general and at parties in private settings.
Method:
SH policy data were collected for 50 California cities in 2009, and SH policies were rated for comprehensiveness and stringency. Annual telephone interviews were conducted with a cohort of 1,483 adolescents (ages 13–16 at Wave 1) from 2009 to 2011 to assess past-year alcohol use, heavy drinking, and drinking at parties. Multilevel analyses were first conducted for the total sample to examine relationships between SH laws and adolescents’ past-year drinking, with other city and individual characteristics controlled for. Parallel analyses were then conducted for a subsample of 667 youth who had reported any past-year drinking.
Results:
SH policy ratings were unrelated to any of the past-year drinking outcomes for the total sample of adolescents. However, among past-year drinkers, a stronger SH policy was inversely related to drinking at parties (β = -.06, p < .05) but was unrelated to past-year alcohol use and heavy drinking in general. There were no moderating effects of SH policy on change in adolescents’ past-year drinking over the 3-year period.
Conclusions:
Local SH policies that include strict liability and civil penalties that are imposed administratively may be associated with less frequent underage drinking in private settings, particularly among adolescents who have already initiated alcohol use.
Hazardous drinking and alcohol-related problems such as drinking and driving remain prevalent among adolescents in the United States. The 2012 Monitoring the Future Survey indicated that 11% of 8th graders, 27.6% of 10th graders, and 41.5% of 12th graders had consumed at least one alcoholic drink in the past 30 days, whereas prevalence rates for heavy episodic drinking (≥5 consecutive drinks) in the past 2 weeks were 5.1%, 15.6%, and 23.7% among youth in these three grades, respectively (Johnston et al., 2013). The 2012 Monitoring the Future Survey also indicated that 57.5% of 8th graders, 78.2% of 10th graders, and 90.6% of 12th graders thought that alcoholic beverages would be “fairly easy” or “very easy” to get. The majority of adolescents obtain alcohol from social sources, notably from friends older than 21 and at parties (Paschall et al, 2007; Pemberton et al., 2008).
A growing number of states and communities are enacting social host (SH) laws to prevent or reduce underage drinking in private settings. There are two types of SH laws. Laws prohibiting hosting of underage parties involve statutory prohibitions enforced by state or local governments, generally through criminal proceedings, that can lead to sanctions such as fines or imprisonment. Host party laws often are closely linked to laws prohibiting the furnishing of alcohol to minors, although laws that prohibit the hosting of underage drinking parties may apply without regard to who furnishes the alcohol. Second, SH civil liability laws, which are at the state level only, involve actions by a private party seeking monetary damages for injuries that result from permitting underage drinking on the host’s premises.
SH laws of both types may be effective strategies for reducing underage drinking and related problems such as drinking and driving (Pacific Institute for Research and Evaluation/Office of Juvenile Justice and Delinquency Prevention [PIRE/OJJDP], 2011). However, research on the effectiveness of either type of SH laws is very limited (Hingson and White, 2014; Wagoner et al., 2012). One study examined effects of state SH civil liability laws on alcohol-related motor vehicle fatalities among 18- to 20-year-olds from 1975 to 2005 (Dills, 2010). Results indicated a 9% reduction in alcohol-related traffic fatalities that was attributable to the presence of SH laws. This study also examined effects of state SH laws on self-reported alcohol use, heavy episodic drinking, and drinking and driving among 18- to 20-year-olds who participated in the Behavioral Risk Factor Surveillance Survey from 1984 to 2004. Results indicated modest, nonsignificant reductions in alcohol use and heavy episodic drinking. However, a significant reduction in the frequency of self-reported drinking and driving was observed in states with SH laws, compared to those without such laws, when overall trends were controlled for.
Less evidence for the effectiveness of SH policies was found in a recent cross-sectional study (Wagoner et al., 2013). The presence of local or state SH policies (prohibitions against hosting underage drinking parties) was unrelated to drinking at home or in someone else’s home on the last drinking occasion, heavy drinking, or drinking consequences among adolescents. However, youth living in communities where SH ordinances had been in effect longer were less likely to report drinking with large groups of peers.
Limited evidence for effects of either type of SH laws on alcohol use and heavy episodic drinking may be attributable to the lack of specificity regarding drinking settings, as both types of SH laws pertain to private settings where underage youth may obtain and consume alcohol. In addition, the available studies have examined only effects of the presence of SH laws, regardless of the content of the law, which varies considerably across states and communities (Fell et al., 2008).
In states such as California where no comprehensive, statewide hosting-prohibition law exists, some counties and cities have enacted such laws, often in response to a tragic event related to underage drinking in a private setting. As part of a study on local alcohol policies related to underage drinking, Thomas et al. (2012) obtained information on the presence or absence and the content of hosting-prohibition laws in 50 California cities. Of the 50 cities, 24 had an SH law in 2009. SH laws in the 24 cities were rated for comprehensiveness and stringency, based on recommended best practices for local alcohol-control policies and a model SH ordinance. The findings indicate that the most effective SH laws (a) apply specifically to underage drinkers, (b) require civil adjudication with a swift administrative penalty, and (c) do not require prior knowledge (i.e., if it happens on your property, you are responsible regardless of specific knowledge of underage drinking; PIRE/OJJDP, 2011; Ventura County Behavioral Health Department, 2005).
Variation in SH laws across the 50 cities and interview data collected from adolescents as part of the 50-city study allow for an assessment of associations between the strength of SH laws and underage drinking in general and in private settings. We hypothesized that adolescents living in cities with stronger SH laws would report less frequent drinking at parties than youth living in cities where SH laws were absent or relatively weak. We also hypothesized that SH law ratings would not be as strongly associated with drinking in general as with drinking at parties. Based on findings of two recent studies with data from the 50 cities (Paschall et al., 2012, 2014), we also took into account other city and individual characteristics that may act as confounders, including adult drinking, bar density, enforcement of underage drinking laws, and demographic characteristics.
Method
Study sample and survey methods
Sample of cities.
Beginning with a list of all 138 California cities with populations between 50,000 and 500,000, a purposive geographic sample of 50 noncontiguous cities was drawn to maximize representativeness with regard to the geography and ecology of the state. The sampled cities tended, on average, to have slightly smaller populations (106,588 vs. 108,000), somewhat less ethnic diversity (e.g., 64% vs. 59% White), smaller household sizes (2.82 vs. 2.93 persons), and lower median household incomes ($50,000 vs. $52,000) than unsampled cities on the list. Of importance, however, none of these differences was statistically significant, and the coverage of these measures across cities was good. Resampling using different starting seeds provided much the same results, offering further evidence regarding the robustness and representativeness of these sampled places (Gruenewald et al., 2014).
Youth sample and survey methods.
This study includes adolescents who participated in at least one of three waves of an annual survey conducted in the 50 cities between 2009 and 2012. The survey targeted adolescents who were 13–16 years old in 2009 (Wave 1). Households within each city were randomly sampled from a purchased list of telephone numbers and addresses. An invitation letter describing the study was mailed to sampled households and followed by telephone contact. Interviewers obtained parental consent for the interviews, followed by assent from the youth respondents. Respondents received $25 at Waves 1 and 2 and $35 at Wave 3 for their participation in the study. Institutional review board approval was obtained before study implementation.
Computer-assisted telephone interviews were given in either English or Spanish at the respondent’s request and lasted 30–40 minutes. Interviewers assured youth that their responses to survey questions would be kept confidential and checked to ensure that their responses could not be overheard by someone else in the household. Of 3,062 sampled households with eligible respondents, 1,543 (50.4%) participated in the first interview (Wave 1). Of these youth, 1,312 (85%) participated 1 year later in Wave 2, and 1,121 (72%) participated 2 years later in Wave 3. The current study is based on data from 1,483 youths who (a) participated in at least one wave of data collection, (b) lived in the same city across study years, and (c) provided complete data for all demographic measures. An average of 30 adolescents (range: 20–47, SD = 5.91) per city provided data for this study.
Youth survey measures
Alcohol use.
Respondents were asked, “Have you ever had a whole drink (not just a sip or a taste) of an alcoholic beverage? A whole drink is a bottle or can of beer, malt liquor, or flavored malt beverage, a glass of wine, a shot of liquor, or a whole mixed drink.” Respondents who answered “yes” were then asked, “In the past 12 months, on how many days did you have a whole drink of an alcoholic beverage?” and “In the past 12 months, on the days when you drank alcohol, how many drinks did you typically have?” Response values for these two variables were multiplied to create a past-year alcohol quantity × frequency (QF) measure. Alcohol QF consumption measures have been shown to have test–retest reliability and validity in clinical and nonclinical studies with adolescents (Sobell and Sobell, 2003). Respondents who indicated any past-year drinking were also asked, “In the past 12 months, on the X days when you drank, on how many of these days would you say you had five or more drinks?” They were also asked, “Thinking about the past 12 months, how many times did you drink alcoholic beverages at parties?” All past-year drinking variables were log transformed to reduce skewness.
Demographics.
Youth reported their gender, age, and race/ethnicity. Race/ethnicity was treated as a dichotomous variable (non-Hispanic White vs. non-White).
City-level measures
Social host policy.
Hosting-prohibition policies in the 50 cities in 2009 were identified through a review of local alcohol policy data, using city ordinances available online and interviews with city clerks. We rated each city’s SH policy based on a coding system developed in previous studies of state underage drinking laws (Fell et al., 2008, 2009) and recommended best practices (PIRE/OJJDP, 2011; Ventura County Behavioral Health Department, 2005). Each city received a +1 if it had an SH ordinance or a 0 otherwise. Each element of law was assigned points for comprehensiveness/stringency or the reverse where individual provisions weakened the law. For example, +2 points were assigned if the law applied to underage persons or parties; +2 if it was a civil law only, +1 if it was a criminal law only, and +3 if it was both a civil and a criminal law; +1 if the law applied to the full range of property types (residential and outdoor property); and -1 if there was a knowledge requirement in the law. This gave each city the possibility of 7 total points.
The same approach was used to rate SH policies in 2010 and 2011. Strong correlations among the ratings for SH policy in the three study years (r = .89–.96) and comparisons of city SH policies from year to year indicated that there were very few changes during that time. We therefore used 2009 SH policy ratings in the current analyses. This variable was log transformed to reduce skewness.
Local enforcement activities.
The level of enforcement of underage drinking laws by police departments in California cities is determined to some extent by funding from the California Alcohol Beverage Control Agency (CA ABC). Therefore, we used total funds received from the CA ABC from 2008–2009 to 2010–2011 as a surrogate measure of enhanced enforcement activities. Fifteen of the 50 cities had received CA ABC funds in at least one of those years, ranging from $ 11,500 to $200,000 total. Compliance checks to reduce alcohol sales to underage youth are the most common type of enforcement activity using these funds, but they may also be used for other activities such as enforcement of minor-in-possession laws. Because city population size could influence level of funding, the per capita funding rate was computed. This variable was log transformed to reduce skewness.
Bar density.
In a previous study with two waves of youth survey data from the 50 cities, we found that bar density was positively related to youth drinking, whereas off-premise outlet density was not (Paschall et al., 2012). Bar density may therefore represent both the physical availability of alcohol and community norms regarding alcohol use. Based on records of licensed establishments obtained from the CA ABC, we computed bar densities based on the number of bars per roadway mile. This measure is thought to be a better indicator of access to alcohol outlets than outlets per square mile (Chen et al., 2010).
Adult alcohol use.
A random-digit-dial household telephone survey of 8,553 adults in the 50 cities was conducted in 2009 to assess levels of alcohol consumption and related problems (Gruenewald et al., 2014). The number of adult respondents per city ranged from 109 to 204 (M = 171). Respondents’ ages ranged from 18 to 98 (M = 54.6), 57% were female, and 59% were White. The survey included a graduated frequency measure that was used to calculate the total volume and frequency of alcohol use in the past 28 days. The mean level of past-28-day alcohol use was then obtained for each city. This variable was log transformed to reduce skewness.
City demographics.
Measures of city demographics were obtained from 2010 census data (Geolytics, 2010). City demographics included population density, percentage of the population younger than 18 years old, and percentage of White and Hispanic residents. A socioeconomic status factor score was derived from median family income, percentage of the population with a college education, and percentage of the population that was unemployed. These measures were significantly correlated (r = .52–.79, p < .01). Principal components analysis yielded a single factor solution, accounting for 75.1% of the variance (factor loadings range: .78–.91).
Data analysis
Attrition analyses were conducted to determine whether adolescents who participated only in the first survey differed from those who also participated in the second and third surveys with respect to demographic characteristics and alcohol use behaviors at Wave 1.
Multilevel linear regression analyses were conducted with HLM Version 7.0 software (Raudenbush et al., 2011) to examine associations between city-level SH policy ratings and drinking behaviors. SH policy rating and other alcohol environment indicators (enforcement of underage drinking laws, adult drinking, bar density) and city demographics were included as city-level variables in all models. Youth gender, age, and race/ethnicity were included as individual-level variables in all models. Drinking behaviors (outcomes) and a time (survey wave) variable were included at the observation level. The cross-level interaction between SH policy rating and time was examined to determine whether it was predictive of outcome slopes. The interaction term was dropped from models if it was not statistically significant. Parallel analyses were conducted for 667 youths who reported any past-year alcohol use for at least one wave of data collection (56% male, Mage at Wave 1 = 14.9 years, SD = 0.95) to determine whether effects of SH policies and other community characteristics would differ when the sample was limited to drinkers.
Results
Sample attrition
Attrition analyses indicated that the percentage of female youth did not differ significantly across the three waves (range: 47.8%–48.7%), nor did the percentage of Whites (range: 57.8%–59.2%). T test results indicated that Wave 1 mean levels of past-year drinking at parties, past-year alcohol use, and heavy drinking were similar among youth who did and did not participate in Wave 2. Mean levels of past-year drinking at parties and past-year alcohol use were significantly higher among youth who did not participate in Wave 3—drinking at parties: t(628.78) = 2.74, p = .006; past-year alcohol use: t(644.14) = 2.61, p = .009. Mean levels of past-year heavy drinking were similar among youth who did and did not participate in Wave 3.
Descriptive statistics
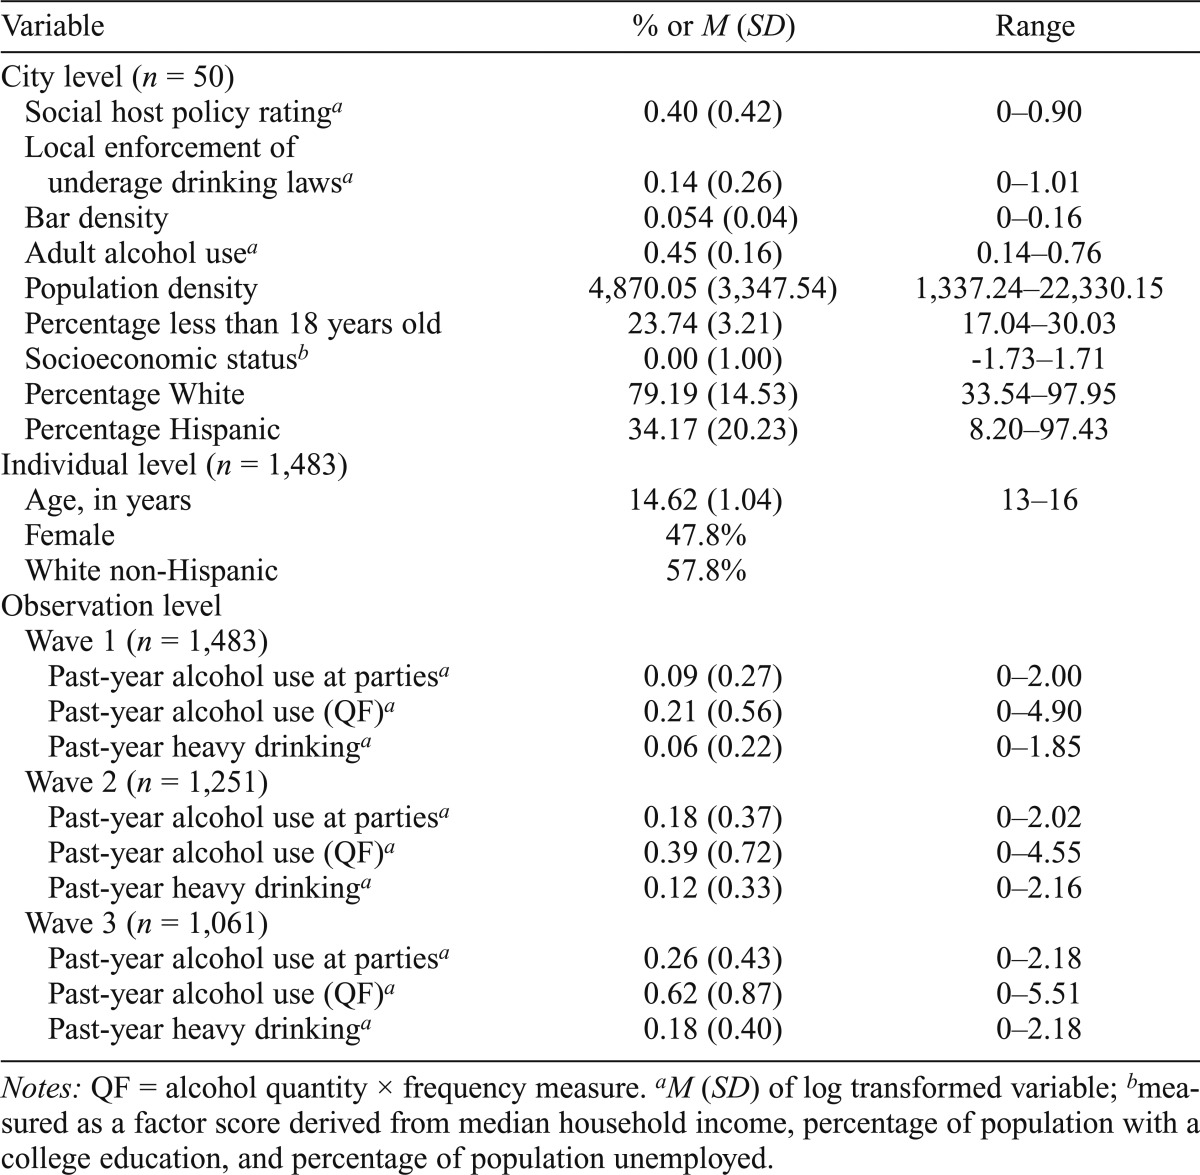
Descriptive statistics for study variables are provided in Table 1. The mean SH policy rating was 2.84 (SD = 3.06, range: 0–7); as noted previously, this variable and others were log transformed for analyses to reduce skewness. Prevalence rates for past-year youth alcohol use were 20.2% at Wave 1, 32.0% at Wave 2, and 44.5% at Wave 3. Prevalence rates for heavy drinking were 8.2% at Wave 1, 14.6% at Wave 2, and 22.7% at Wave 3. Prevalence rates for drinking at parties were 15% at Wave 1, 25% at Wave 2, and 37% at Wave 3.
Table 1.
Descriptive statistics
| Variable | % or M (SD) | Range |
| City level (n = 50) | ||
| Social host policy ratinga | 0.40 (0.42) | 0–0.90 |
| Local enforcement of underage drinking lawsa | 0.14 (0.26) | 0–1.01 |
| Bar density | 0.054 (0.04) | 0–0.16 |
| Adult alcohol usea | 0.45 (0.16) | 0.14–0.76 |
| Population density | 4,870.05 (3,347.54) | 1,337.24–22,330.15 |
| Percentage less than 18 years old | 23.74 (3.21) | 17.04–30.03 |
| Socioeconomic statusb | 0.00 (1.00) | -1.73–1.71 |
| Percentage White | 79.19 (14.53) | 33.54–97.95 |
| Percentage Hispanic | 34.17 (20.23) | 8.20–97.43 |
| Individual level (n = 1,483) | ||
| Age, in years | 14.62 (1.04) | 13–16 |
| Female | 47.8% | |
| White non-Hispanic | 57.8% | |
| Observation level | ||
| Wave 1 (n = 1,483) | ||
| Past-year alcohol use at partiesa | 0.09 (0.27) | 0–2.00 |
| Past-year alcohol use (QF)a | 0.21 (0.56) | 0–4.90 |
| Past-year heavy drinkinga | 0.06 (0.22) | 0–1.85 |
| Wave 2 (n = 1,251) | ||
| Past-year alcohol use at partiesa | 0.18 (0.37) | 0–2.02 |
| Past-year alcohol use (QF)a | 0.39 (0.72) | 0–4.55 |
| Past-year heavy drinkinga | 0.12 (0.33) | 0–2.16 |
| Wave 3 (n = 1,061) | ||
| Past-year alcohol use at partiesa | 0.26 (0.43) | 0–2.18 |
| Past-year alcohol use (QF)a | 0.62 (0.87) | 0–5.51 |
| Past-year heavy drinkinga | 0.18 (0.40) | 0–2.18 |
Notes: QF = alcohol quantity × frequency measure.
M (SD) of log transformed variable;
measured as a factor score derived from median household income, percentage of population with a college education, and percentage of population unemployed.
Social host policy and past-year drinking
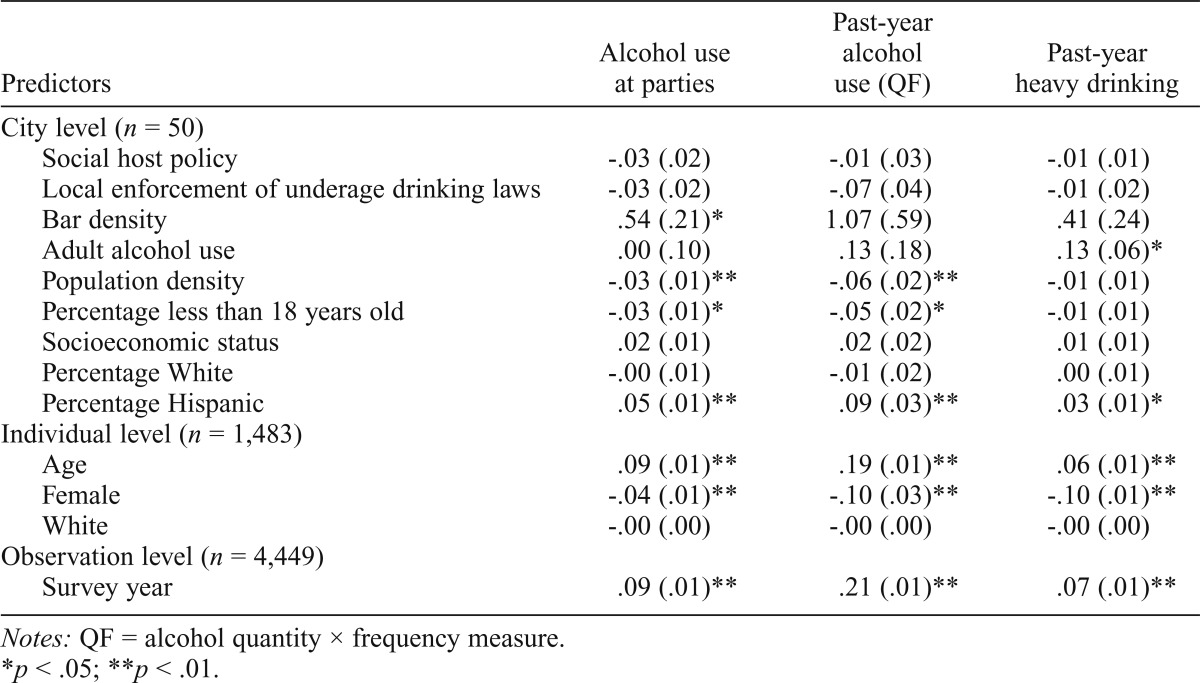
Results of multilevel analyses examining associations between SH policy ratings and alcohol use behaviors are reported in Table 2. No associations were found between SH policy rating and any of the three past-year drinking outcomes. In addition, no cross-level interactions were found between time and SH policy rating on any of the alcohol use behaviors. Of the other alcohol environmental indicators, bar density was positively related to drinking at parties, whereas adult drinking was positively related to past-year heavy drinking. Being older and being male were consistently associated with greater heavy drinking, greater alcohol use in general, and drinking at parties, whereas ethnicity was not related to any of the past-year drinking outcomes.
Table 2.
Results of multilevel analyses for total adolescent sample, β (SE)
| Predictors | Alcohol use at parties | Past-year alcohol use (QF) | Past-year heavy drinking |
| City level (n = 50) | |||
| Social host policy | -.03 (.02) | -.01 (.03) | -.01 (.01) |
| Local enforcement of underage drinking laws | -.03 (.02) | -.07 (.04) | -.01 (.02) |
| Bar density | .54 (.21)* | 1.07 (.59) | .41 (.24) |
| Adult alcohol use | .00 (.10) | .13 (.18) | .13 (.06)* |
| Population density | -.03 (.01)** | -.06 (.02)** | -.01 (.01) |
| Percentage less than 18 years old | -.03 (.01)* | -.05 (.02)* | -.01 (.01) |
| Socioeconomic status | .02 (.01) | .02 (.02) | .01 (.01) |
| Percentage White | -.00 (.01) | -.01 (.02) | .00 (.01) |
| Percentage Hispanic | .05 (.01)** | .09 (.03)** | .03 (.01)* |
| Individual level (n = 1,483) | |||
| Age | .09 (.01)** | .19 (.01)** | .06 (.01)** |
| Female | -.04 (.01)** | -.10 (.03)** | -.10 (.01)** |
| White | -.00 (.00) | -.00 (.00) | -.00 (.00) |
| Observation level (n = 4,449) | |||
| Survey year | .09 (.01)** | .21 (.01)** | .07 (.01)** |
Notes: QF = alcohol quantity × frequency measure.
p < .05;
p < .01.
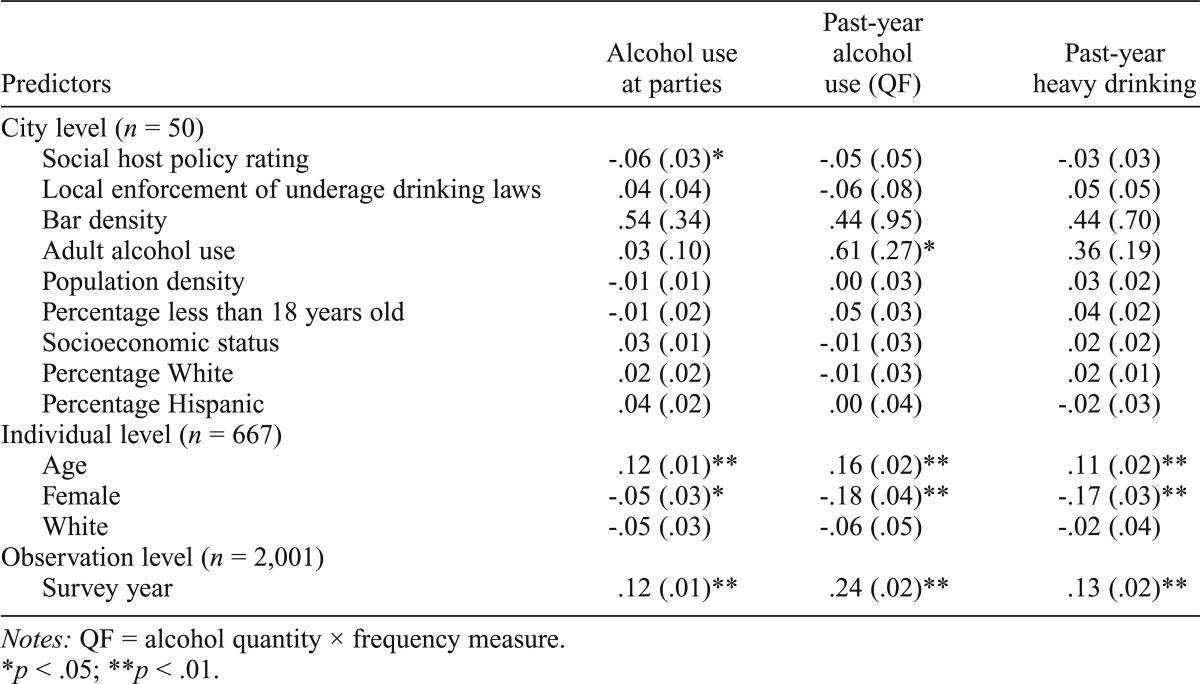
We further examined these associations among the 667 youth who reported past-year alcohol use for at least one wave of data collection (Table 3). A statistically significant inverse association was found between SH policy rating and youth past-year alcohol use at parties, indicating that a stronger SH policy was associated with less frequent alcohol use at parties among drinkers. To help with interpretability, we also ran the model using Poisson (zero-inflated) regression with the original (unlogged) variables. Results indicated a modest, although significant, 3% lower incidence of drinking at parties with each unit increase in the SH policy rating (event rate ratio [95% CI] = 0.97 [0.95, 0.99], p = .03). This represents a 20% lower incidence of drinking at parties among adolescents in cities with the highest SH policy rating compared to those in cities with no SH law. No association was observed between SH policy rating and overall past-year alcohol use or heavy drinking. No cross-level interactions were found between time and SH policy rating on any of the alcohol use behaviors. Of the other alcohol environment indicators, adult alcohol use was positively related to overall past-year alcohol use. Associations between youth demographic characteristics and past-year drinking variables were similar to those observed for the total sample.
Table 3.
Results of multilevel analyses for adolescent drinkers, β (SE)
| Predictors | Alcohol use at parties | Past-year alcohol use (QF) | Past-year heavy drinking |
| City level (n = 50) | |||
| Social host policy rating | -.06 (.03)* | -.05 (.05) | -.03 (.03) |
| Local enforcement of underage drinking laws | .04 (.04) | -.06 (.08) | .05 (.05) |
| Bar density | .54 (.34) | .44 (.95) | .44 (.70) |
| Adult alcohol use | .03 (.10) | .61 (.27)* | .36 (.19) |
| Population density | -.01 (.01) | .00 (.03) | .03 (.02) |
| Percentage less than 18 years old | -.01 (.02) | .05 (.03) | .04 (.02) |
| Socioeconomic status | .03 (.01) | -.01 (.03) | .02 (.02) |
| Percentage White | .02 (.02) | -.01 (.03) | .02 (.01) |
| Percentage Hispanic | .04 (.02) | .00 (.04) | -.02 (.03) |
| Individual level (n = 667) | |||
| Age | .12 (.01)** | .16 (.02)** | .11 (.02)** |
| Female | -.05 (.03)* | -.18 (.04)** | -.17 (.03)** |
| White | -.05 (.03) | -.06 (.05) | -.02 (.04) |
| Observation level (n = 2,001) | |||
| Survey year | .12 (.01)** | .24 (.02)** | .13 (.02)** |
Notes: QF = alcohol quantity × frequency measure.
p < .05;
p < .01.
To investigate the possibility that SH policies had a greater effect for older than for younger adolescents, we conducted additional analyses that included the interactions between age and the SH policy rating, for both the total sample and drinkers only. These analyses indicated that age did not significantly moderate the relationships between SH policy and any of the outcomes.
Discussion
Many states and local communities have enacted hosting-prohibition laws to reduce hazardous drinking by underage youth in private settings. This study is one of the first to examine whether local hosting-prohibition policies are associated with adolescent alcohol use and heavy drinking in general and at parties that are typically in private settings. Results suggest that stronger SH policies are associated with less frequent drinking at parties among adolescents who have already initiated alcohol use. SH policies, however, were unrelated to drinking at parties among all adolescents, including those who have not already initiated alcohol use. The general measures of past-year alcohol use and heavy drinking were unrelated to SH policy ratings for both the total sample of adolescents and the subsample of drinkers. Thus, SH policies may be most relevant and effective for deterring alcohol use in private settings for adolescents who have already begun to drink.
Our findings also provide some support for the validity of our SH policy ratings. The fact that we found a significant association between SH policy ratings and drinking at parties among alcohol-initiated adolescents suggests that SH policies are effective in a meaningful subset of those situations for which they were designed. To address more broadly the harms that result from underage drinking at parties to the drinkers themselves as well as others, a larger range of underage drinking policies is needed. For example, policymakers and researchers may want to consider the two major types of SH laws that can be implemented. The first is the type of SH policy investigated here, which establishes government-imposed liability against individuals (social hosts) responsible for underage drinking events on property they own, lease, or otherwise control. These laws can be implemented at both the state and local levels. The second type involves an action by a private party seeking monetary damages for injuries that result from permitting underage drinking on the host’s premises. Only state legislatures or state courts (as opposed to city and county governments) have the authority to impose this form of civil liability. These different approaches to SH liability may have different implications for preventing underage drinking and drinking problems.
The effectiveness of SH laws in preventing or reducing underage drinking will depend not only on the content of the laws but also on public awareness and enforcement of SH laws, neither of which was examined in this study. Public awareness of SH laws may be enhanced through a variety of media channels, including written or electronic messages from schools, public service announcements, and news coverage of related enforcement activities. Enforcement of SH laws will most likely occur when there is strong support from the city government and appropriate training of law enforcement officers, who may be accustomed to using party-dispersal operations that do not focus on the party hosts when underage drinking is involved. In addition, resources to support SH law enforcement operations may be limited. Thus, some communities have adopted response cost–recovery ordinances (which are, often, a component of hosting underage drinking party ordinances, although they are sometimes separate ordinances), where fines are imposed on party hosts to cover the costs of enforcement operations and emergency medical services.
Findings of this study should be considered in light of several limitations. We cannot make causal inferences because this study examined only the association between SH laws and youth drinking. Adolescents in our sample may not be representative of all adolescents in the 50 California cities, and sample attrition may have affected our results in unknown ways. In addition, California cities in our sample may not be typical of other cities in the United States in terms of demographic makeup, as many California cities have ethnically diverse populations with a relatively high percentage of non-White or Hispanic residents. Therefore, findings of this study may not generalize beyond the study sample. Responses to survey questions were subject to recall and social desirability biases, which may have led to underreporting of alcohol use, although measures were taken to ensure privacy of telephone interviews and truthful responses to survey questions. We also recognize the difficulty of interpreting analysis results, given that many of the variables were log transformed before analyses. In addition, we did not directly measure the level of enforcement of SH policies by local law enforcement agencies; a high level of enforcement may enhance their effectiveness.
Additional research is needed to determine whether findings of this study can be replicated in other settings. Ideally, studies with controlled or natural experimental designs are needed to determine whether SH laws are effective (Wagoner et al., 2012). Future research should also examine the level of enforcement of SH laws, which may vary considerably across communities. Without adequate enforcement, support from the public and city officials, and parental awareness, SH laws may be less effective. Research is also needed to better understand the mechanisms through which SH policies may affect youth drinking, such as alcohol availability from social sources, perceived acceptability of alcohol use, and perceived enforcement of underage drinking laws. In addition, future research should examine effects of SH policies on adverse consequences of adolescent alcohol use in private settings, such as drinking and driving.
Footnotes
This research and preparation of this article were supported by National Institute on Alcohol Abuse and Alcoholism (NIAAA) Grant P60-AA006282. The content is solely the responsibility of the authors and does not necessarily represent the official views of the NIAAA or the National Institutes of Health.
References
- Chen M-J, Grube JW, Gruenewald PJ. Community alcohol outlet density and underage drinking. Addiction. 2010;105:270–278. doi: 10.1111/j.1360-0443.2009.02772.x. [DOI] [PMC free article] [PubMed] [Google Scholar]
- Dills AK. Social host liability for minors and underage drunk-driving accidents. Journal of Health Economics. 2010;29:241–249. doi: 10.1016/j.jhealeco.2009.12.001. [DOI] [PubMed] [Google Scholar]
- Fell JC, Fisher DA, Voas RB, Blackman K, Tippetts AS. The relationship of underage drinking laws to reductions in drinking drivers in fatal crashes in the United States. Accident Analysis and Prevention. 2008;40:1430–1440. doi: 10.1016/j.aap.2008.03.006. [DOI] [PMC free article] [PubMed] [Google Scholar]
- Fell JC, Fisher DA, Voas RB, Blackman K, Tippetts AS. The impact of underage drinking laws on alcohol-related fatal crashes of young drivers. Alcoholism: Clinical and Experimental Research. 2009;33:1208–1219. doi: 10.1111/j.1530-0277.2009.00945.x. [DOI] [PMC free article] [PubMed] [Google Scholar]
- Geolytics. Official Census 2010 Data. 2010 Retrieved from http://www.geolytics.com/USCensus,Census2010,Products.asp. [Google Scholar]
- Gruenewald PJ, Remer LG, LaScala EA. Testing a social ecological model of alcohol use: The California 50-city study. Addiction. 2014;109:736–745. doi: 10.1111/add.12438. [DOI] [PMC free article] [PubMed] [Google Scholar]
- Hingson R, White A. New research findings since the 2007 Surgeon General’s Call to Action to Prevent and Reduce Underage Drinking: A review. Journal of Studies on Alcohol and Drugs. 2014;75:158–169. doi: 10.15288/jsad.2014.75.158. [DOI] [PMC free article] [PubMed] [Google Scholar]
- Johnston LD, O’Malley PM, Bachman JG, Schulenberg JE. Monitoring the Future national survey results on drug use, 1975-2012. Volume I: Secondary school students. Ann Arbor, MI: Institute for Social Research, University of Michigan; 2013. [Google Scholar]
- Pacific Institute for Research and Evaluation/Office of Juvenile Justice and Delinquency Prevention. Regulatory strategies for preventing youth access to alcohol: Best practices. 2011. Calverton, MD: Author. Retrieved from http://www.udetc.org/documents/accesslaws.pdf. [Google Scholar]
- Paschall MJ, Grube JW, Black C, Ringwalt CL. Is commercial alcohol availability related to adolescent alcohol sources and alcohol use? Findings from a multi-level study. Journal of Adolescent Health. 2007;41:168–174. doi: 10.1016/j.jadohealth.2007.03.009. [DOI] [PMC free article] [PubMed] [Google Scholar]
- Paschall MJ, Grube JW, Thomas S, Cannon C, Treffers R. Relationships between local enforcement, alcohol availability, drinking norms, and adolescent alcohol use in 50 California cities. Journal of Studies on Alcohol and Drugs. 2012;73:657–665. doi: 10.15288/jsad.2012.73.657. [DOI] [PMC free article] [PubMed] [Google Scholar]
- Paschall MJ, Lipperman-Kreda S, Grube JW. Effects of the local alcohol environment on adolescents’ drinking behaviors and beliefs. Addiction. 2014;109:407–416. doi: 10.1111/add.12397. [DOI] [PMC free article] [PubMed] [Google Scholar]
- Pemberton MR, Colliver JD, Robbins TM, Gfroerer JC. Underage alcohol use: Findings from the 2002–2006 National Surveys on Drug Use and Health (Department of Health and Human Services Publications No. SMA 08-4333, Analytic Series A-30) Rockville, MD: Substance Abuse and Mental Health Services Administration, Office of Applied Studies; 2008. [Google Scholar]
- Raudenbush S, Bryk A, Cheong YF, Congdon R, du Toit M. HLM 7: Hierarchical linear and nonlinear modeling. Lincolnwood, IL: Scientific Software International; 2011. [Google Scholar]
- Sobell LC, Sobell MB. Alcohol consumption measures. In: Allen JP, Wilson VB, editors. Assessing alcohol problems: A guide for clinicians and researchers. 2nd ed. Bethesda, MD: National Institute on Alcohol Abuse and Alcoholism; 2003. (NIH Publication No. 03-3745, pp. 75–99) [Google Scholar]
- Thomas S, Paschall MJ, Grube JW, Cannon C, Treffers R. Underage alcohol policies across 50 California cities: An assessment of best practices. Substance Abuse Treatment Prevention Policy. 2012;7:26–39. doi: 10.1186/1747-597X-7-26. [DOI] [PMC free article] [PubMed] [Google Scholar]
- Ventura County Behavioral Health Department. Model social host liability ordinance with legal commentary and resources. Ventura, CA: Author; 2005. [Google Scholar]
- Wagoner KG, Francisco VT, Sparks M, Wyrick D, Nichols T, Wolfson M. A review of social host policies focused on underage drinking parties: Suggestions for future research. Journal of Drug Education. 2012;42:99–117. doi: 10.2190/DE.42.1.f. [DOI] [PubMed] [Google Scholar]
- Wagoner KG, Sparks M, Francisco VT, Wyrick D, Nichols T, Wolfson M. Social host policies and underage drinking parties. Substance Use & Misuse. 2013;48:41–53. doi: 10.3109/10826084.2012.722158. [DOI] [PubMed] [Google Scholar]