

Abstract
Temperature acclimation may offset the increased energy expenditure (standard metabolic rate, SMR) and reduced scope for activity (aerobic scope, AS) predicted to occur with local and global warming in fishes and other ectotherms. Yet, the time course and mechanisms of this process is little understood. Acclimation dynamics of SMR, maximum metabolic rate, AS and the specific dynamic action of feeding (SDA) were determined in shorthorn sculpin (Myoxocephalus scorpius) after transfer from 10°C to 16°C. SMR increased in the first week by 82% reducing AS to 55% of initial values, while peak postprandial metabolism was initially greater. This meant that the estimated AS during peak SDA approached zero, constraining digestion and leaving little room for additional aerobic processes. After eight weeks at 16°C, SMR was restored, while AS and the estimated AS during peak SDA recovered partly. Collectively, this demonstrated a considerable capacity for metabolic thermal compensation, which should be better incorporated into future models on organismal responses to climate change. A mathematical model based on the empirical data suggested that phenotypes with fast acclimation rates may be favoured by natural selection as the accumulated energetic cost of a slow acclimation rate increases in a warmer future with exacerbated thermal variations.
Keywords: climate change, digestion, metabolic rate, sculpin, specific dynamic action, thermal compensation
1. Introduction
Temperature has profound effects on the performance and biogeography of ectothermic animals including fishes, partly through its effects on metabolism [1,2]. Increasing temperature results in an exponential increase in cellular respiration rate with a Q10 of approximately 2, which is met by a corresponding elevation of the whole-animal oxygen consumption rate (i.e. the standard metabolic rate; SMR) to meet aerobic energy requirements [3]. However, in the long term many species have a considerable capacity for physiological acclimation (i.e. reversible physiological plasticity) allowing them to compensate for the direct thermodynamic effects on metabolism [4–8]. Indeed, some species can maintain relatively stable basal energy requirements over broad temperature ranges. For example, in Atlantic halibut (Hippoglossus hippoglossus), SMR was indistinguishable between 10°C and 16°C following 14 weeks acclimation [9]. Thermal acclimation capacity is, therefore, increasingly considered as a key feature determining resilience to climate change [7,10–13], and plastic responses at the individual level can buffer temperature effects potentially allowing time for genetic adaptation to occur at the species level [14–16]. While it is well known that average ocean temperatures are increasing, recent projections also predict more extreme and frequent heat waves [17–19]. It could, therefore, be argued that in a more thermally variable future, the thermal acclimation rate (i.e. the speed by which an organism can compensate for a given change in environmental temperature and attain a new steady state) will become more important. Rapidly acclimating species may, therefore, acquire increasingly greater energetic and competitive advantages as sudden changes in temperature may become more frequent and extreme in the future, but so far the time course and rate of metabolic thermal acclimation in ectothermic animals have been explored little.
Thermal acclimation of metabolism involves changes at multiple organizational levels spanning from biochemical and cellular processes to behavioural responses [5,20–25]. At the whole-animal level not only SMR changes but also there are changes in other metabolic traits affecting the energy budget including the maximum metabolic rate (MMR), aerobic scope (AS, the difference between SMR and MMR) and the metabolic costs of feeding (i.e. the specific dynamic action, SDA). During a transient temperature increase such as during an episodic heat wave, the increase in SMR may lead to a reduction in AS unless the MMR increases by an equivalent or greater amount. The aerobic metabolic reserve available to process beyond basal requirements is then reduced [26–28]. While thermal effects on AS has been proposed to be a key mechanism determining, e.g. fitness and biogeography of fishes with climate change [2,29], little is known about the chronic effects of temperature on AS [6,30]. In Atlantic halibut acclimated to static temperatures between 6°C and 18°C for 14–16 weeks, AS increased continuously with acclimation temperature up to 18°C, which is near lethal temperatures [9]. However, recent work on the tropical barramundi (Lates calcarifer) showed a somewhat different response. While AS in 29°C acclimated barramundi increased continuously with an acute temperature increase up to 38°C, which is 2–3° from the upper lethal temperature; five weeks acclimation at 38°C resulted in a significantly reduced AS that was not different from 29°C acclimated fish [31]. While these studies suggest that AS can be drastically modulated with thermal acclimation, there appears to be considerable interspecific differences. Moreover, the time course of thermal acclimation of AS remains largely unexplored although this would have important implications for ectotherms in a warmer and more thermally variable future.
The SDA, which are the metabolic processes and subsequent increase in oxygen consumption associated with feeding, must also be accommodated by AS [32,33]. The temperature effects on SDA in fishes are variable, but the postprandial peak metabolic response typically increases with temperature; not only because the SMR may increase but also because the absolute elevation in metabolic rate (i.e. the SDA amplitude) increases [32,34,35]. This presents fish feeding and digesting in a warming environment with a metabolic challenge as digestion may become metabolically constrained, and there may also be increasingly less aerobic capacity available for other fitness-related processes such as locomotion during digestion. Thermal acclimation of the SDA response along with changes in AS could, therefore, have ecologically important implications, but currently information is scant about the thermal acclimation dynamics of SDA and how this relates to changes in AS.
This study explored the temporal aspects of thermal acclimation of SMR, MMR and AS; as well as various components of the SDA in shorthorn sculpin (Myoxocephalus scorpius) following a temperature increase from 10°C to 16°C. This species inhabits coastal Atlantic waters throughout much of the Northern Hemisphere and is a typical ambush predatory species that remains motionless on the bottom substratum for extended periods of time [36]. We hypothesized that the thermal acclimation dynamics in this sculpin species would have considerable ecological relevance as it is probably exposed to significant variations in temperature in its littoral habitat. Furthermore, we predicted that the postprandial metabolism would constitute a large proportion of the available AS given its inactive lifestyle [37], and documented ability to consume large prey items [38,39]. In addition, given the dearth of information on thermal acclimation rate in ectothermic animals, a mathematical model was developed based on field temperature data and our empirical study to evaluate the energetic costs of differing acclimation rates under current and a simulated future ocean temperature scenario.
2. Material and methods
(a). Animals
Shorthorn sculpin (M. scorpius) between 80 g and 330 g (mean: 147.2 ± 9.2 g) were caught by a local fisherman in traps in the vicinity of the Gullmar fjord on the Swedish west coast. Fish were transported to the Department of Biological and Environmental Sciences at the University of Gothenburg, Sweden, and held in approximately 1 m3 tanks supplied with aerated seawater (10°C) from a recirculating system. The animals were fed ad libitum at least once a week with Alaskan pollock (Theragra chalcogramma) and occasionally with northern shrimps (Pandalus borealis).
(b). Experimental protocols
Fish were anaesthetized in seawater containing MS222 (100 mg l−1) and implanted with a Passive Integrated Transponder tag in the abdominal cavity and marked subcutaneously with Visible Implant Elastomere (Northwest Marine Technology, Washington, DC, USA) for easy visual discrimination. Fish were divided into three experimental groups and left for approximately eight weeks to acclimate to the holding conditions at 10°C.
(1) In the first group, the dynamics of the temperature acclimation response of SMR and MMR was determined after increasing the temperature to 16°C. This scenario was considered ecologically relevant as these temperatures and magnitude of temperature change are within the range of thermal conditions observed during summer in the Gullmar fjord (http://www.weather.loven.gu.se/data.shtml) where the fish were caught. Measurements were first taken at 10°C and then after one, four and eight weeks of acclimation to 16°C. During measurements, fish were randomly collected from the holding tank and MMR was measured after 5 min of encouraged exhaustive exercise in a separate tank, a treatment that rendered the fish completely unresponsive to physical stimuli at the end of the protocol. The fish was then quickly placed in the respirometer (see below for details) and the highest recorded value was considered to represent MMR. The SMR was then recorded after at least 24 h in the respirometer as the mean over 2 h when the metabolic rate had declined and plateaued [30].
(2) In the second group, the temperature acclimation response of the postprandial metabolic response (i.e. SDA) was monitored after transfer to 16°C as outlined above. Measurements were first taken at 10°C and then after one, four and eight weeks of acclimation to 16°C. Fish were randomly collected from the holding tank, placed in a respirometer and allowed a recovery period of 24 h. The SDA response was determined by gavage feeding the fish a standardized ration of cut pieces of fish meat (i.e. T. chalcogramma) amounting to 5% of the body mass. The oxygen consumption rate was then measured until the metabolic rate had returned to baseline.
(3) A third control group was maintained at 10°C for the duration of the experimental period to account for, for example, seasonal variations in metabolic rates.
The two experimental groups (i.e. groups 1 and 2) were kept collectively in one tank. The control group (group 3) was kept in a nearby identical tank connected to the same recirculating water system.
(c). Respirometry
Eight custom-made round PVC respirometers (total volume: 3.1 l), submerged in an outer 240 l tank and supplied with a continuous flow of aerated seawater, was used to measure oxygen consumption rate (MO2) by intermittent-flow respirometry [30]. Circulation of water through the respirometers was achieved by submersible pumps, one mixing the water inside the respirometer and one controlled by an automatic time relay to close the respirometer for 15–20 min during MO2 measurements. The duration of the closed state was adjusted to avoid water oxygen tension falling below 65% air saturation. Oxygen levels were measured using Oxi 340i oxygen meters (WTW, Weilheim, Germany) placed in line with the mixing pumps. Analogue signals from the oxygen metres were stored digitally using a PowerLab system connected to a computer running Labchart v. 7.2.2 software (ADInstruments, Castle Hill, Australia). After each experiment, respirometers were cleaned and rinsed with hot water to remove any microbial growth. Background oxygen consumption was checked regularly in empty respirometers and was always negligible.
(d). Calculations
MO2 was calculated as
where Δ[O2] is the difference in oxygen concentration (%) calculated from the slope of the resultant linear regression;  is oxygen content (mg l−1) of water; v is volume of the closed respirometer excluding the volume of the fish, m is body mass of the fish and t is time. MO2 was adjusted to represent a 100 g fish and normalized to body mass (i.e. mg O2 kg−1 h−1) according to [40]:
where MO2(100) is oxygen consumption of a 100 g fish and MO2 the oxygen consumption of a fish with a body mass of m, as calculated above. A is the mass exponent (0.8). AS was calculated as the difference between MMR and SMR.
Postprandial metabolic rate was analysed as the average of three MO2 recordings every 10 h. The following components of the SDA response was calculated for individual fish: (i) SDA, the total amount of oxygen consumed, calculated as the integrated area under the curve using a fitted polynomial trend line; (ii) SDA duration, the duration of elevated MO2 until metabolism had returned to within 10% of the initial MO2; (iii) peak postprandial MO2, the maximal postprandial oxygen consumption rate; (iv) SDA amplitude, the difference between peak postprandial MO2 and SMR; (v) time to peak postprandial MO2, the time from feeding until peak postprandial MO2; (vi) SDA coefficient, the total energy used in relation to the energetic content of the meal, this was calculated by dividing the SDA with the energy content of the meal, using an oxycalorific coefficient of 14.06 kJ g O2−1 [41]; and (vii) the SDA quotient, the ratio between the SDA and the total SMR. In addition, we estimated the remaining AS during peak SDA [42]. This was done by subtracting peak postprandial MO2 in individual fish from the mean MMR of unfed fish, assuming that MMR does not change with feeding.
(e). Modelling energetic consequences of differing acclimation rates
As sculpins were found to show complete thermal acclimation of SMR over the temperature range examined (figure 1), a mathematical model based on our empirical data was constructed to estimate the accumulated excess energetic cost and duration of the acclimation process. This was done by fitting the SMR data of sculpins acclimating to 16°C for one, four and eight weeks (figure 1) to an exponential decay equation:
where f(t) represents the temperature-induced change in SMR, a is the estimated increase in SMR at time 0, b the exponential decay coefficient (percentage per day) and t is time. From this model, we calculated: (i) acclimation time as the time in days taken to re-establish SMR within 10% of SMR at 10°C, and (ii) accumulated energetic cost during acclimation (in kilojoules) by integrating the area under the curve of the decay function. Data were normalized to a 100 g fish with oxygen consumption converted to energy using an oxycalorific coefficient of 14.06 kJ g O2−1 [41]. We then modelled how a doubled acclimation rate would affect these variables by doubling the decay coefficient in the model (i.e. b × 2). While the temperature increase of 6°C used in the empirical part of this study corresponds well with current high summer temperatures and thermal fluctuations (see Experimental protocols section), we also evaluated the implications of a hypothetical future ocean scenario with greater fluctuations in temperature extremes (e.g. as caused by a more pronounced episodic heat wave, e.g. [19]). This was performed by estimating the energetic consequences of a 50% greater temperature increase (i.e. Δ9°C), using a Q10 of 2.7 for SMR as obtained one week after transfer from 10°C to 16°C (figure 1).
Figure 1.
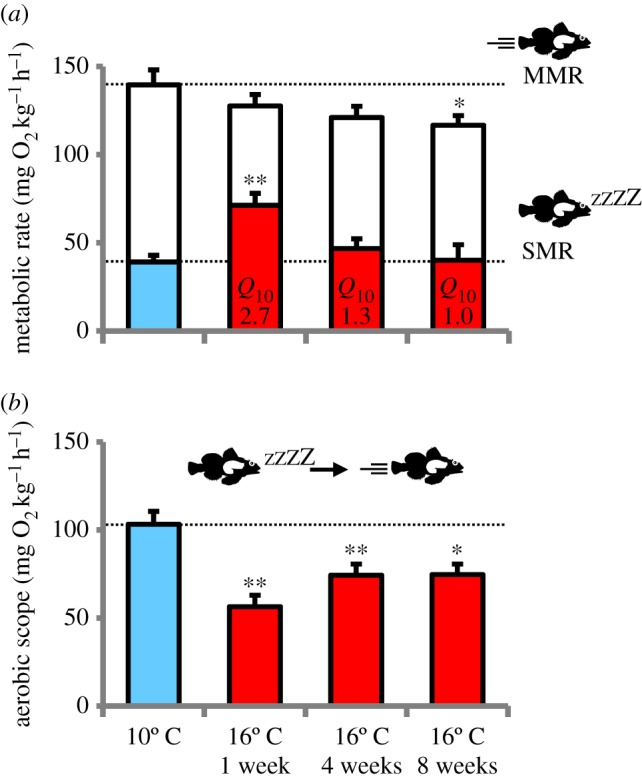
Thermal acclimation dynamics of metabolic rate following transfer from 10°C to 16°C in shorthorn sculpin (M. scorpius). (a) SMR (filled bars) and MMR (open bars) and (b) AS. Measurements were taken on 10°C acclimated animals prior to transfer (10°C, blue bars) and after one, four and eight weeks acclimation at 16°C (red bars). Variables are reported as means ± s.e.m. (n = 11–12). Q10 values for the change in SMR from 10°C are presented for each column. Asterisks denote significant (*p ≤ 0.05 and **p ≤ 0.01) differences from the respective value at 10°C. (Online version in colour.)
(f). Statistical analysis
Changes in metabolic rates were statistically analysed using one-way ANOVA or one-way rm-ANOVA followed by Dunnet's post hoc tests to identify time points that were significantly different from the initial value at 10°C. Unpaired student's t-tests were used to compare specific time points between experimental groups were such comparisons were considered relevant. Assumptions of normality and homogeneous variance were validated using the Kolmogorov–Smirnov test and the Bartlett's test, respectively. All values are reported as means ± s.e.m. and p ≤ 0.05 was considered statistically significant.
3. Results
(a). Thermal acclimation effects on standard metabolic rate, maximum metabolic rate and aerobic scope
Fish typically remained completely motionless in the respirometers, and so the recorded baseline values closely approximate SMR for this species. SMR in 10°C acclimated fish was 39.2 ± 3.8 mg O2 kg−1 h−1. One week after the temperature was increased to 16°C, SMR increased to 71.2 ± 6.8 mg O2 kg−1 h−1, reflecting a Q10 of 2.7 (figure 1a). Over the next eight weeks, SMR gradually decreased such that after eight weeks SMR was 40.2 ± 8.7 mg O2 kg−1 h−1, which was not significantly different from SMR at 10°C and reflecting a Q10 of 1.0. The initial MMR at 10°C was 142.3 ± 9.2 mg O2 kg−1 h−1. MMR was not significantly different from the value at 10°C after one and four weeks at 16°C, but after eight weeks, it was significantly reduced to 114.9 ± 6.8 mg O2 kg−1 h−1 (figure 1a). The combined effects on SMR and MMR resulted in a significantly reduced AS from 103.3 ± 7.3 mg O2 kg−1 h−1 at 10°C to 56.4 ± 6.4 mg O2 kg−1 h−1 after one week at 16°C (figure 1b), which is only 55% of the value at 10°C. Over the eight-week acclimation to 16°C, AS partly recovered along with the reduction in SMR and increased to 74.7 ± 5.9 mg O2 kg−1 h−1. However, AS was still significantly lower than the value at 10°C. There were no significant changes in metabolic rates in the control group kept at 10°C (figure 1; electronic supplementary material).
(b). Thermal acclimation of specific dynamic action
At 10°C, feeding resulted in a gradual increase in oxygen consumption, reaching a postprandial peak of 86.0 ± 8.2 mg O2 kg−1 h−1 with an amplitude of 48.3 ± 7.1 mg O2 kg−1 h−1. The total SDA amounted to 2.1 ± 0.4 g O2 kg−1 with a duration of 67 ± 3 h (table 1). At the peak SDA response, metabolic rate was still significantly lower than MMR in unfed fish at 10°C (figure 2a), resulting in an estimated AS during peak SDA of 55.2 ± 7.0 mg O2 kg−1 h−1 (figure 3).
Table 1.
Temperature effects on postprandial metabolism in shorthorn sculpin (M. scorpius). (Values are means ± s.e.m. (n = 3–7). Asterisks denote statistically significant difference from 10°C. For further details see Material and methods section.)
| 16°C |
||||
|---|---|---|---|---|
| 10°C | 1 week | 4 weeks | 8 weeks | |
| SDA (g O2 kg−1) | 2.1 ± 0.4 | 2.0 ± 0.4 | 2.7 ± 0.6 | 1.4 ± 0.2 |
| SDA duration (h) | 67 ± 3 | 57 ± 5* | 66 ± 3 | 67 ± 3 |
| peak postprandial MO2 (mg O2 kg−1 h−1) | 86.0 ± 8.2 | 131.6 ± 8.6* | 120.9 ± 17.4* | 86.1 ± 7.2 |
| SDA amplitude (mg O2 kg−1 h−1) | 48.3 ± 7.1 | 59.7 ± 7.1* | 69.5 ± 14.5* | 44.4 ± 5.6 |
| time to peak postprandial MO2 (h) | 21.4 ± 14.4 | 18.3 ± 3.1 | 20.0 ± 2.2 | 23.3 ± 3.3 |
| SDA coefficient (%) | 9.0 ± 1.6 | 8.8 ± 1.9 | 11.8 ± 2.7 | 6.4 ± 1.0 |
| SDA quotient (%) | 41.7 ± 5.5 | 27.9 ± 4.8 | 41.4 ± 5.5 | 34.0 ± 7.0 |
Figure 2.

Thermal acclimation dynamics of the postprandial metabolic response (i.e. the SDA response) following transfer from 10°C to 16°C in shorthorn sculpin (M. scorpius). Fish were fed with a ration of fish meat corresponding to 5% of the total body mass at vertical arrow. Measurements were taken on 10°C acclimated animals prior to thermal transfer (a, blue symbols) and at one, four and eight weeks of acclimation at 16°C (b–d, red symbols). Variables are reported as means ± s.e.m. (n = 3–7). The shaded area represents SMR and MMR in unfed fish (n = 12, see figure 1). Asterisks denote significant (*p ≤ 0.05 and **p ≤ 0.01) changes from 10°C. Daggers denote significant (p ≤ 0.05) difference between the peak postprandial metabolic response and MMR. (Online version in colour.)
Figure 3.
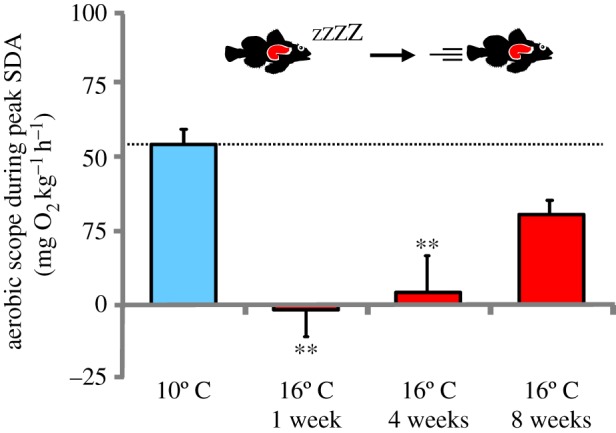
Thermal acclimation dynamics of the estimated AS during peak SDA following transfer from 10°C to 16°C in shorthorn sculpin (M. scorpius). Variables are reported as means ± s.e.m., (n = 3–7). Asterisks denote significant (p ≤ 0.05) differences from 10°C. For details see Material and methods section. (Online version in colour.)
One week after the increase to 16°C, the peak postprandial MO2 reached a significantly higher value of 131.6 ± 8.6 mg O2 kg−1 h−1, whereas the SDA duration was reduced to 57 ± 5 h. The higher SDA peak was mainly caused by the higher SMR because the SDA and the SDA amplitude were not different from 10°C (table 1). In fact, the peak SDA response was now equivalent to MMR in unfed fish (figure 2b), and the estimated AS during peak SDA was close to zero (figure 3). After four weeks acclimation to 16°C, the peak postprandial MO2 response was still significantly elevated compared with the response at 10°C, mainly because the SDA amplitude was significantly increased (table 1). Although the SDA duration and the SDA were unchanged relative to fish at 10°C, there was no difference between MMR in unfed fish and the peak SDA (figure 2c and table 1), which meant that the estimated AS during digestion remained markedly depressed (figure 3). However, after eight weeks at 16°C, the metabolic response to feeding was more similar to that in 10°C acclimated fish (figure 2d). The SDA amplitude was no longer significantly elevated and the peak postprandial response was not different from the response at 10°C. The estimated AS during peak SDA was, therefore, restored to 55% of the 10°C value (30.5 ± 7.2 mg O2 kg−1 h−1, figure 3). The SDA coefficient and quotient did not change with thermal acclimation.
(c). Model of metabolic acclimation rates in future oceans
When fitting SMR data from this study to the thermal acclimation model, a decay coefficient of 0.0125 (i.e. 12.5% decrease day−1) was obtained (figure 4a). This acclimation rate resulted in an accumulated excess energetic cost of 20 KJ when acclimating to the 6°C increase (figure 4a,b); while the energetic cost was more than halved (9 KJ) with a simulated doubled acclimation rate (25% decrease day−1; figure 4c,d). Similarly, the acclimation times were 21 and 10 days, respectively (figure 4a,c).
Figure 4.

Effects of different acclimation rates in future ocean temperature scenarios. SMR (a,c) and the accumulated excess energetic cost during acclimation (b,d) following temperature increase by 6°C (current, red) or 9°C (future, black). Fish with an acclimation rate of 12.5% decrease day−1 in (a,b), and fish with a doubled acclimation rate of 25% decrease day−1 in (c,d). Hatched bars in (a) are empirical SMR data (figure 1) used to fit the exponential decay function. Arrows mark the time to 90% thermal compensation of SMR. Δcost in (b,d) represents the difference in the accumulated excess energetic cost between temperature scenarios. (Online version in colour.)
A future ocean temperature scenario with a 50% greater temperature increase (9°C) resulted in increased energetic costs during acclimation. With the normal acclimation rate, the excess energetic cost during acclimation increased to 33 KJ, while the cost was 15 KJ with the doubled acclimation rate. Furthermore, when comparing metabolic costs of the future temperature scenario with current thermal conditions, the excess energetic cost was 13 KJ greater with the normal acclimation rate, whereas the difference was only 6 KJ with the doubled acclimation rate (figure 4b,d). Similarly, the future temperature scenario extended the acclimation time by 4 days with the normal acclimation rate, but only by 2 days with the doubled acclimation rate (figure 4a,c). The overall differences between the two temperature scenarios (Δ6°C versus Δ9°C), therefore, decreased markedly with the faster acclimation rate.
4. Discussion
(a). Thermal metabolic compensation in unfed fish
This study revealed that the shorthorn sculpin (M. scorpius) has the capacity to fully compensate for the acute thermal effects on SMR following a temperature increase from 10°C to 16°C. After eight weeks acclimation to 16°C, SMR was not statistically different from the value at 10°C, and the Q10 value was 1.0, indicating complete thermal compensation of SMR (i.e. type 2 compensation; [8]). This finding is qualitatively consistent with a recent long-term study on Atlantic halibut (H. hippoglossus) [9]. This also gives some hope that macrophysiological predictions on dramatic reductions in fish body size resulting from thermal effects on metabolism with current warming trends may not be as severe because such predictions typically employ SMR Q10 values above 2 [43].
The MMR was initially unchanged after transfer to 16°C, and then declined slightly. The greater reduction in SMR, therefore, resulted in considerable thermal compensation of AS. Given that maintenance of a high AS is generally considered adaptive [29,44], it is perhaps immediately less obvious why MMR was not increased or at least maintained with thermal acclimation. This suggests that there are either costs associated with maintaining a high MMR, or perhaps the reduction in MMR is simply an inevitable consequence of the reduced SMR. Nonetheless, the small decrease in MMR with warm acclimation is partly consistent with a recent study on the tropical barramundi where both MMR and AS were markedly reduced with thermal acclimation following an initial increase with acute temperature increase [31]. However, the reduced AS observed in this previous study differs from the present study where AS was partly restored during acclimation. In the study on Atlantic halibut, AS increased continuously with increasing acclimation temperature, but the acute thermal effects on AS were not examined [9]. Unless these sculpins are able to migrate into cooler (e.g. deeper) waters, the reduction in AS initially observed here at the higher temperature would probably have negative fitness consequences in nature; e.g. by constraining feed processing and impair predator avoidance by reducing the scope for activity [26,44]. Even so, it appears increasingly clear that the chronic thermal effects on AS may be quite variable and differ considerably between species and possibly with different heating regimes. Compensatory thermal acclimation responses on AS should therefore be better integrated when forecasting the effects of climate change on ectothermic animals [6,7,30]. Yet, detailed knowledge about the ecological ramifications of AS in wild animals remains limited [30].
The SMR for M. scorpius reported here at 10°C and after eight weeks at 16°C (approx. 39 mg O2 kg−1 h−1) are lower than a previous study on the same species from the North sea acclimated to 5–6°C and measured at 7°C (approx. 48 mg O2 kg−1 h−1) [45], but slightly higher than conspecifics acclimated and measured at 15°C (approx. 31 mg O2 kg−1 h−1) [39]. Even so, when revisiting a recent study on the same species from Greenland waters that were field-acclimated to approximately 9°C [36], SMR reported here is nearly half of the values in the Greenland study (80.4 ± 8.9 mg O2 kg−1 h−1). This is interesting because these sculpins were examined by the same researchers using a nearly identical experimental set-up. While this may suggest that the sculpins from the Arctic population had not yet fully acclimated to the unusually warm Arctic summer conditions in 2009 [36], it seems equally possible that the Greenland population had an elevated metabolic thermal sensitivity resulting from, for example, genetic adaptation and/or non-genetic (e.g. epigenetic) effects imposed by the frigid Arctic conditions. This finding is consistent with a recent meta-analysis of fish species across latitudes showing that populations from high latitudes have relatively higher SMR and aerobic capacities [46].
(b). Thermal acclimation of the postprandial metabolic response
The peak SDA response typically increases while the SDA duration decreases with temperature in ectotherms [32,34,47]. Accordingly, after one week at 16°C a significantly higher peak postprandial metabolism was observed in shorthorn sculpin. This increase was entirely caused by the increase in SMR because the SDA and the SDA amplitude were unchanged, although the SDA duration decreased (table 1). As the estimated AS during peak SDA was initially close to zero at 16°C, it seems likely that digestion was metabolically constrained at this point. In fact, after four weeks at 16°C, when SMR had been partly thermally compensated, feeding resulted in greater SDA amplitude; but the estimated postprandial AS was still close to zero, suggesting that SDA was still metabolically constrained. The initially reduced ability to digest a large prey item following an acute temperature increase would of course be physiologically and energetically challenging for these sculpins in nature, not least because the elevated SMR requires an increased energy intake to maintain energy balance. Furthermore, peak postprandial metabolism typically increases with meal size [32], and so digestion of even larger meals would probably be increasingly constrained by the reduced AS with warming. The estimated reduction of postprandial AS also indicate that the capacity for other metabolically demanding activities such as predatory avoidance and inter- and intra-specific competition will be severely compromised during digestion at the higher temperature.
Nonetheless, following long-term acclimation to 16°C these sculpins clearly had the capacity to thermally compensate their SMR such that AS was partly restored and the SDA was no longer metabolically constrained. Even so, a potential caveat in these calculations is that feeding may have additive metabolic effects in some fish species resulting in an elevated MMR postprandial [34,47–49], although this is not the case in all species [50,51]. It is, therefore, possible that we may have underestimated postprandial AS, although it remains uncertain how temperature acclimation affected this. A recent study showed that MMR was higher postprandial in three cyprinids acclimated to 15°C, but this additive effect partly disappeared after acclimation to 25°C where only one species showed a clear additive effect [34]. This further highlights the complex relationship between temperature and feeding energetics in wild animals.
(c). Implications of thermal acclimation rate in future oceans
Although comparative data are scarce, it appears that the thermal compensation of SMR in shorthorn sculpin in this study is a relatively slow process. For example, in rainbow trout (Oncorhynchus mykiss) taken acutely from 8°C to 18°C, SMR only showed partial thermal compensation, but a new steady state was established within approximately 3 days [52]. In the Antarctic bald notothen (Pagothenia borchgrevinki), there was no statistically significant difference in SMR between animals at −1°C and 4°C after 9 days acclimation to the higher temperature [53].
While the capacity for thermal acclimation is generally regarded as a key determinant of resilience to climate change [12,14], this study emphasizes that the acclimation rate should also be incorporated into future models. Our study suggests that a slow acclimation rate may be increasingly energetically disadvantageous in a future with more pronounced episodic heat waves [19]. This is because the accumulated excess energetic cost during thermal acclimation is larger for a slowly acclimating species, and this difference becomes more pronounced with greater thermal variability leading to greater energy expenditure. In addition, the increase in acclimation time is less pronounced in rapidly acclimating species. This does not only affect the direct energetic costs, but also other fitness-related traits such as AS and SDA that are inherently dependent on the thermal resetting of SMR. For simplicity, we assumed complete thermal compensation in both thermal scenarios tested in the model, as the main purpose was to explore the effects of differences in the rate of acclimation. However, in reality, it is possible that species may be unable to fully compensate if thermal variability increases and this would off course exacerbate the metabolic consequences. While the ecological implications of these differences in acclimation rate are largely unknown, they can potentially lead to competitive imbalances between today coexisting species that have similar acclimation capacity but different acclimation rates. Even so, individuals with relatively faster acclimation rates will probably pay a smaller energetic prize and experience competitive advantages in future oceans with more variable and extreme thermal conditions. It could then be speculated that if global change progresses, a likely evolutionary outcome would be that natural selection will favour phenotypes with faster thermal acclimation rates.
Given the dearth of information on the dynamics and capacity of metabolic thermal acclimation in ectothermic animals, future studies should more thoroughly explore the time course of thermal acclimation and the underlying changes of critical physiological and biochemical processes. Particularly, in temperate species that may have evolved to compensate physiologically for large but relatively slow seasonal temperature changes, future ‘winners’ may turn out to not only be those that can acclimate, but also perhaps more importantly, those who can acclimate fast.
Supplementary Material
Supplementary Material
Ethics statement
All experiments were covered by ethical permit 143-2010 from the regional animal ethics committee.
Funding statement
This study was supported by grants from the Swedish Research Council and the Swedish Research Council for Environment, Agricultural Sciences and Spatial Planning (FORMAS) to E.S. and a grant from the Swedish Research Council to M.A.
References
- 1.Dillon ME, Wang G, Huey RB. 2010. Global metabolic impacts of recent climate warming. Nature 467, 704–706. ( 10.1038/Nature09407) [DOI] [PubMed] [Google Scholar]
- 2.Pörtner HO. 2010. Oxygen- and capacity-limitation of thermal tolerance: a matrix for integrating climate-related stressor effects in marine ecosystems. J. Exp. Biol. 213, 881–893. ( 10.1242/jeb.037523) [DOI] [PubMed] [Google Scholar]
- 3.Clarke A, Johnston NM. 1999. Scaling of metabolic rate with body mass and temperature in teleost fish. J. Anim. Ecol. 68, 893–905. ( 10.1046/j.1365-2656.1999.00337.x) [DOI] [PubMed] [Google Scholar]
- 4.Angiletta MJ. 2009. Thermal adaptation, a theoretical and empirical synthesis. New York, NY: Oxford University Press. [Google Scholar]
- 5.Johnston IA, Dunn J. 1987. Temperature acclimation and metabolism in ectotherms with particular reference to teleost fish. Symp. Soc. Exp. Biol. 41, 67–93. [PubMed] [Google Scholar]
- 6.Schulte PM, Healy TM, Fangue NA. 2011. Thermal performance curves, phenotypic plasticity, and the time scales of temperature exposure. Integr. Comp. Biol. 51, 691–702. ( 10.1093/Icb/Icr097) [DOI] [PubMed] [Google Scholar]
- 7.Seebacher F, Franklin CE. 2012. Determining environmental causes of biological effects: the need for a mechanistic physiological dimension in conservation biology. Phil. Trans. R. Soc. B 367, 1607–1614. ( 10.1098/rstb.2012.0036) [DOI] [PMC free article] [PubMed] [Google Scholar]
- 8.Precht H. 1958. Concepts of the temperature adaptation of unchanging reaction systems of cold-blooded animals. In Physiological adaptation (ed. Prosser CL.), pp. 50–78. Washington, DC: American Physiological Society. [Google Scholar]
- 9.Gräns A, et al. 2014. Aerobic scope fails to explain the detrimental effects on growth resulting from warming and elevated CO2 in Atlantic halibut. J. Exp. Biol. 217, 711–717. ( 10.1242/jeb.096743) [DOI] [PubMed] [Google Scholar]
- 10.Stillman JH. 2003. Acclimation capacity underlies susceptibility to climate change. Science 301, 65 ( 10.1126/science.1083073) [DOI] [PubMed] [Google Scholar]
- 11.Franklin CE, Seebacher F. 2009. Adapting to climate change. Science 323, 876–877 (author reply 876–877). ( 10.1126/science.323.5916.876b) [DOI] [PubMed] [Google Scholar]
- 12.Somero GN. 2010. The physiology of climate change: how potentials for acclimatization and genetic adaptation will determine ‘winners’ and ‘losers’. J. Exp. Biol. 213, 912–920. ( 10.1242/jeb.037473) [DOI] [PubMed] [Google Scholar]
- 13.Somero GN. 2011. Comparative physiology: a ‘crystal ball’ for predicting consequences of global change. Am. J. Physiol. Regul. Integr. Comp. Physiol. 301, R1–R14. ( 10.1152/ajpregu.00719.2010) [DOI] [PubMed] [Google Scholar]
- 14.Chevin LM, Lande R, Mace GM. 2010. Adaptation, plasticity, and extinction in a changing environment: towards a predictive theory. PLoS Biol. 8, e1000357 ( 10.1371/journal.pbio.1000357) [DOI] [PMC free article] [PubMed] [Google Scholar]
- 15.Munday PL, Warner RR, Monro K, Pandolfi JM, Marshall DJ. 2013. Predicting evolutionary responses to climate change in the sea. Ecol. Lett. 16, 1488–1500. ( 10.1111/Ele.12185) [DOI] [PubMed] [Google Scholar]
- 16.Hoffmann AA, Sgro CM. 2011. Climate change and evolutionary adaptation. Nature 470, 479–485. ( 10.1038/Nature09670) [DOI] [PubMed] [Google Scholar]
- 17.Meehl GA, Tebaldi C. 2004. More intense, more frequent, and longer lasting heat waves in the 21st century. Science 305, 994–997. ( 10.1126/science.1098704) [DOI] [PubMed] [Google Scholar]
- 18.Perkins SE, Alexander LV, Nairn JR. 2012. Increasing frequency, intensity and duration of observed global heatwaves and warm spells. Geophys. Res. Lett. 39, L20714 ( 10.1029/2012GL053361) [DOI] [Google Scholar]
- 19.Seneviratne SI, Donat MG, Mueller B, Alexander LV. 2014. No pause in the increase of hot temperature extremes. Nat. Clim. Change 4, 161–163. ( 10.1038/nclimate2145) [DOI] [Google Scholar]
- 20.Gamperl AK, Farrell AP. 2004. Cardiac plasticity in fishes: environmental influences and intraspecific differences. J. Exp. Biol. 207, 2539–2550. ( 10.1242/jeb.01057) [DOI] [PubMed] [Google Scholar]
- 21.Bouchard P, Guderley H. 2003. Time course of the response of mitochondria from oxidative muscle during thermal acclimation of rainbow trout, Oncorhynchus mykiss. J. Exp. Biol. 206, 3455–3465. ( 10.1242/Jeb.00578) [DOI] [PubMed] [Google Scholar]
- 22.Sidell BD, Wilson FR, Hazel J, Prosser CL. 1973. Time course of thermal acclimation in goldfish. J. Comp. Physiol. B 84, 119–127. ( 10.1007/Bf00697602) [DOI] [Google Scholar]
- 23.Guderley H, St Pierre J. 1999. Seasonal cycles of mitochondrial ADP sensitivity and oxidative capacities in trout oxidative muscle. J. Comp. Physiol. B 169, 474–480. ( 10.1007/s003600050244) [DOI] [PubMed] [Google Scholar]
- 24.Hazel JR. 1984. Effects of temperature on the structure and metabolism of cell-membranes in fish. Am. J. Physiol. Regul. Integr. Physiol. 246, R460–R470. [DOI] [PubMed] [Google Scholar]
- 25.Seebacher F, Brand MD, Else PL, Guderley H, Hulbert AJ, Moyes CD. 2010. Plasticity of oxidative metabolism in variable climates: molecular mechanisms. Physiol. Biochem. Zool. 83, 721–732. ( 10.1086/649964) [DOI] [PubMed] [Google Scholar]
- 26.Farrell AP, Eliason EJ, Sandblom E, Clark TD. 2009. Fish cardiorespiratory physiology in an era of climate change. Can. J. Zool. 87, 835–851. ( 10.1139/Z09-092) [DOI] [Google Scholar]
- 27.Fry FEJ. 1947. Effects of the environment on animal activity. Toronto, Canada: University of Toronto Press. [Google Scholar]
- 28.Brett JR. 1972. The metabolic demand for oxygen in fish, particularly salmonids, and a comparison with other vertebrates. Respir. Physiol. 14, 151–170. ( 10.1016/0034-5687(72)90025-4) [DOI] [PubMed] [Google Scholar]
- 29.Pörtner HO, Farrell AP. 2008. Physiology and climate change. Science 322, 690–692. ( 10.1126/science.1163156) [DOI] [PubMed] [Google Scholar]
- 30.Clark TD, Sandblom E, Jutfelt F. 2013. Aerobic scope measurements of fishes in an era of climate change: respirometry, relevance and recommendations. J. Exp. Biol. 216, 2771–2782. ( 10.1242/Jeb.084251) [DOI] [PubMed] [Google Scholar]
- 31.Norin T, Malte H, Clark TD. 2014. Aerobic scope does not predict the performance of a tropical eurythermal fish at elevated temperatures. J. Exp. Biol. 217, 244–251. ( 10.1242/Jeb.089755) [DOI] [PubMed] [Google Scholar]
- 32.Secor SM. 2009. Specific dynamic action: a review of the postprandial metabolic response. J. Comp. Physiol. B 179, 1–56. ( 10.1007/s00360-008-0283-7) [DOI] [PubMed] [Google Scholar]
- 33.McCue MD. 2006. Specific dynamic action: a century of investigation. Comp. Biochem. Physiol. A Mol. Integr. Physiol. 144, 381–394. ( 10.1016/j.cbpa.2006.03.011) [DOI] [PubMed] [Google Scholar]
- 34.Pang X, Cao ZD, Fu SJ. 2011. The effects of temperature on metabolic interaction between digestion and locomotion in juveniles of three cyprinid fish (Carassius auratus, Cyprinus carpio and Spinibarbus sinensis). Comp. Biochem. Physiol. A 159, 253–260. ( 10.1016/j.cbpa.2011.03.013) [DOI] [PubMed] [Google Scholar]
- 35.Frisk M, Steffensen JF, Skov PV. 2013. The effects of temperature on specific dynamic action and ammonia excretion in pikeperch (Sander lucioperca). Aquaculture 404, 65–70. ( 10.1016/j.aquaculture.2013.04.005) [DOI] [Google Scholar]
- 36.Seth H, Gräns A, Sandblom E, Olsson C, Wiklander K, Johnsson JI, Axelsson M. 2013. Metabolic scope and interspecific competition in sculpins of Greenland are influenced by increased temperatures due to climate change. PLoS ONE 8, e62859 ( 10.1371/journal.pone.0062859) [DOI] [PMC free article] [PubMed] [Google Scholar]
- 37.Fu SJ, Zeng LQ, Li XM, Pang X, Cao ZD, Peng JL, Wang YX. 2009. The behavioural, digestive and metabolic characteristics of fishes with different foraging strategies. J. Exp. Biol. 212, 2296–2302. ( 10.1242/jeb.027102) [DOI] [PubMed] [Google Scholar]
- 38.Seth H, Axelsson M. 2009. Effects of gastric distension and feeding on cardiovascular variables in the shorthorn sculpin (Myoxocephalus scorpius). Am. J. Physiol. Regul. Integr. Comp. Physiol. 296, 171–177. ( 10.1152/ajpregu.90533.2008) [DOI] [PubMed] [Google Scholar]
- 39.Johnston IA, Battram J. 1993. Feeding energetics and metabolism in demersal fish species from Antarctic, temperate and tropical environments. Mar. Biol. 115, 7–14. ( 10.1007/BF00349380) [DOI] [Google Scholar]
- 40.Steffensen JF, Bushnell PG, Schurmann H. 1994. Oxygen consumption in four species of teleosts from Greenland: no evidence of metabolic cold adaptation. Polar Biol. 14, 49–54. ( 10.1007/BF00240272) [DOI] [Google Scholar]
- 41.Gnaiger E. 1983. Heat dissipation and energetic efficiency in animal anoxibiosis: economy contra power. J. Exp. Zool. 228, 471–490. ( 10.1002/jez.1402280308) [DOI] [Google Scholar]
- 42.Fu SJ, Zeng LQ, Li XM, Pang X, Cao ZD, Peng JL, Wang YX. 2009. Effect of meal size on excess post-exercise oxygen consumption in fishes with different locomotive and digestive performance. J. Comp. Physiol. B 179, 509–517. ( 10.1007/s00360-008-0337-x) [DOI] [PubMed] [Google Scholar]
- 43.Cheung WWL, Sarmiento JL, Dunne J, Frolicher TL, Lam VWY, Palomares MLD, Watson R, Pauly D. 2013. Shrinking of fishes exacerbates impacts of global ocean changes on marine ecosystems. Nat. Clim. Change 3, 254–258. ( 10.1038/Nclimate1691) [DOI] [Google Scholar]
- 44.Priede IG. 1985. Metabolic scope in fishes. In Fish energetics, new perspectives (eds Tytler P, Calow P.), pp. 33–64. London, UK: Croom Helm. [Google Scholar]
- 45.Johnston IA, Clarke A, Ward P. 1991. Temperature and metabolic rate in sedentary fish from the Antarctic north sea and Indo-west pacific ocean. Mar. Biol. Res. 109, 191–196. ( 10.1007/BF01319386) [DOI] [Google Scholar]
- 46.White CR, Alton LA, Frappell PB. 2012. Metabolic cold adaptation in fishes occurs at the level of whole animal, mitochondria and enzyme. Proc. R. Soc. B 279, 1740–1747. ( 10.1098/rspb.2011.2060) [DOI] [PMC free article] [PubMed] [Google Scholar]
- 47.Pang X, Cao ZD, Peng JL, Fu SJ. 2010. The effects of feeding on the swimming performance and metabolic response of juvenile southern catfish, Silurus meridionalis, acclimated at different temperatures. Comp. Biochem. Physiol. A 155, 253–258. ( 10.1016/j.cbpa.2009.11.005) [DOI] [PubMed] [Google Scholar]
- 48.Jourdan-Pineau H, Dupont-Prinet A, Claireaux G, McKenzie DJ. 2010. An investigation of metabolic prioritization in the European sea bass, Dicentrarchus labrax. Physiol. Biochem. Zool. 83, 68–77. ( 10.1086/648485) [DOI] [PubMed] [Google Scholar]
- 49.Li XM, Cao ZD, Peng JL, Fu SJ. 2010. The effect of exercise training on the metabolic interaction between digestion and locomotion in juvenile darkbarbel catfish (Peltebagrus vachelli). Comp. Biochem. Physiol. A 156, 67–73. ( 10.1016/j.cbpa.2009.12.022) [DOI] [PubMed] [Google Scholar]
- 50.Thorarensen H, Farrell AP. 2006. Postprandial intestinal blood flow, metabolic rates, and exercise in Chinook salmon (Oncorhynchus tshawytscha). Physiol. Biochem. Zool. 79, 688–694. ( 10.1086/505512) [DOI] [PubMed] [Google Scholar]
- 51.Alsop D, Wood C. 1997. The interactive effects of feeding and exercise on oxygen consumption, swimming performance and protein usage in juvenile rainbow trout (Oncorhynchus mykiss). J. Exp. Biol. 200, 2337–2346. [DOI] [PubMed] [Google Scholar]
- 52.Evans DO. 1990. Metabolic thermal compensation by rainbow trout: effects on standard metabolic rate and potential usable power. Trans. Am. Fish. Soc. 119, 585–600. () [DOI] [Google Scholar]
- 53.Robinson E, Davison W. 2008. The Antarctic notothenioid fish Pagothenia borchgrevinki is thermally flexible: acclimation changes oxygen consumption. Polar Biol. 31, 317–326. ( 10.1007/s00300-007-0361-4) [DOI] [Google Scholar]
Associated Data
This section collects any data citations, data availability statements, or supplementary materials included in this article.