Figure 4.

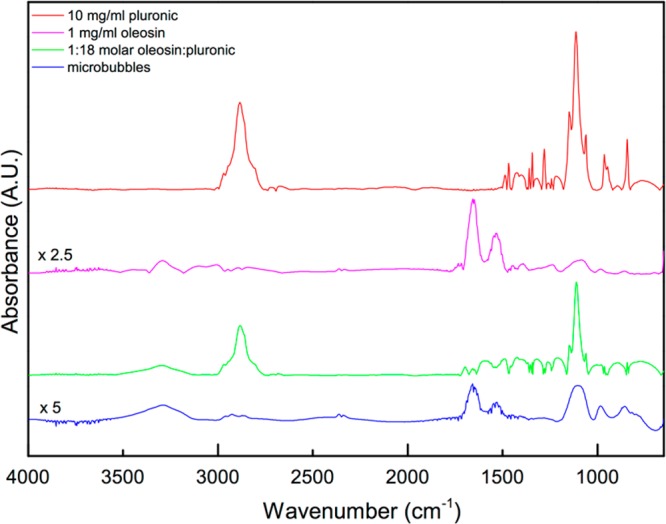
FTIR absorbance spectra of the components utilized to produce the bubbles and microbubbles. The spectra of pure oleosin and microbubbles are amplified by factors of 2.5 and 5, respectively, to clearly show the features.

FTIR absorbance spectra of the components utilized to produce the bubbles and microbubbles. The spectra of pure oleosin and microbubbles are amplified by factors of 2.5 and 5, respectively, to clearly show the features.