Abstract
Acori Graminei Rhizoma (AGR), widely used in traditional herbal medicine, is composed of the roots of Acorus gramineus Soland. The family Acoraceae includes A. gramineus, A. calamus, and A. tatarinowii, among others. We compared genomic DNA sequences of AGR for polymorphisms. The sequences of the internal transcribed spacer (ITS) regions of nuclear ribosomal DNA, the rbcL region of chloroplast DNA from A. gramineus, A. calamus, and A. tatarinowii were compared. We designed primers specific to the ITS region of A. calamus and A. tatarinowii (A. cataF4/R4) and the internal primer Araceae Radix (IntAcoF2/R4). Random amplification of polymorphic DNA (RAPD) analysis showed a difference in A. calamus using the UBC 681 primer. A specific primer (Aca681-F/R) amplified 138 base pairs of A. calamus. The primers designed for this study (A. cataF4/R4, Aca681-F/R, and IntAcoF2/R2) can be used for multiplex PCR to distinguish the three species of Acorus. An allelic discrimination assay was conducted using commercially available AGR. We used sequence-characterized amplified region (SCAR) markers to confirm whether AGR purchased at a market was A. gramineus. Our study indicated the SCAR markers could be used as molecular evidence to distinguish Araceae Radix.
Keywords: Acori graminei rhizoma, Acorus calamus, Acorus gramineus, Acorus tatarinowii, monitoring, SCAR marker
Introduction
Owing to the recent import liberalization of agricultural products caused by Korea’s entry into the World Trade Organization and International Union for the Protection of New Varieties of Plants, it is necessary to differentiate various species of domestic and foreign agricultural products. In particular, it is very difficult to differentiate between similar species of medicinal herbs and their places of origin by morphological observation alone because medicinal herbs are typically dried products.
Acori graminei rhizoma (AGR) originates from the root of Acorus gramineus Soland (Araceae) and distributed throughout Korea, China, Japan, Siberia, and Europe [1]. Acorus gramineus is a medicinal herb that has been referenced more than 1200 times in “Bojebang”, the most comprehensive oriental prescription book [2]. Its root has been prescribed for the treatment of convulsions and stomach aches and as a sedative in oriental medicine. In addition, Acorus gramineus is effective against oxidation, to activate suppressive neuroceptors, to show antibacterial activity, and to act against Alzheimer’s disease [3].
Acori plants include two species: A. gramineus and A. calamus L. A. gramineus Soland is the original species in Korea (KP), whereas A. tatarinowii Schott, which is similar to A. gramineus. Soland is the original species in China (CP). The use of A. calamus and A. gramineus is ambiguous [4]. The aerial and subterranean parts of A. gramineus, A. tatarinowii, and A. calamus, both are medicinal herbs, show similar morphologies. Patients should be sure to use the correct plant. However, more accurate and effective screening methods need to develop before this is feasible.
With recent advances in analytical methods in molecular biology such as PCR and sequence analysis, more accurate and objective methods for classifying medicinal herbs have been developed [5,6]. Of these, randomly amplified polymorphic DNA (RAPD) has been widely used for accurately identifying plant species [7,8]. In particular, with the introduction of more accurate and stable sequence-characterized, amplified region (SCAR) markers developed using species-specific amplified products obtained from RAPD analysis [9], studies involving screening of medicinal herbs have been actively conducted both domestically and internationally.
The objective of this study was to analyze the genetic diversity of Korean Acorus using RAPD markers and to examine the efficacy of SCAR markers for distinguishing members of the genus Acorus [10,11]. Monitoring of AGR purchased in Korean markets using genomic DNA markers has not been conducted previously.
Accordingly, our goals were to establish a screening method and monitoring system at the genomic DNA level by developing markers using RAPD analysis to prevent the misuse and mix use of A. gramineus, and to identify its inappropriate use.
Materials and methods
Plant materials
A total 16 Acorus samples were used in this study. Six of which were A. gramineus, six were A. calamus, and four were A. tatarinowii (Table 1). Materials came from dried roots or purchased from commercial suppliers in Korea and China. These samples were preserved at the Korea Institute of Oriental Medicine.
Table 1.
List of Acorus specimens used in this study
| No. | Locality | Collection Date | Identification results |
|---|---|---|---|
| 1 | Jeju, Korea | 2010.2 | A. gramineus |
| 2 | Jeonbuk, Korea | 2010.2 | A. gramineus |
| 3 | Jeju, Korea | 2010.2 | A. gramineus |
| 4 | Seoul, Korea | 2010.2 | A. gramineus |
| 5 | Banan, China | 2010.2 | A. gramineus |
| 6 | Guangxi, China | 2002.7 | A. gramineus |
| 7 | Szechuan, China | 2010.2 | A. calamus |
| 8 | Gyeongju, Korea | 2010.2 | A. calamus |
| 9 | Seoul, Korea | 2002.9 | A. calamus |
| 10 | Guangxi, China | 2002.9 | A. calamus |
| 11 | Bonghwa, Korea | 2010.2 | A. calamus |
| 12 | Uiseong, Korea | 2002.7 | A. calamus |
| 13 | Zhejiang, China | 2010.2 | A. tatarinowii |
| 14 | Nanjing, China | 2010.7 | A. tatarinowii |
| 15 | Nanjing, China | 2010.7 | A. tatarinowii |
| 16 | Changsha, China | 2010.7 | A. tatarinowii |
DNA extraction
Total DNA was extracted from the Acorus samples and purified using a Nucleospin® plant II kit (Macherey-Nagel, Düren, Germany), according to the manufacturer’s instructions. DNA was quantified using an ND-1000 spectrophotometer (NanoDrop Tech, Wilmington, DE, USA).
ITS and rbcL sequence analysis
ITS regions were amplified from total DNA by PCR. The ITS region was amplified using the primers ITSp 1 and ITS4 (Table 2) (White et al., 1990). For a 25 μL PCR reaction, 1 μL of genomic DNA (~ 20 ng) was added to 12.5 μL PrimeSTAR HS Premix (Takara, Shiga, Japan) containing 0.63 U PrimeSTAR HS DNA Polymerase, 0.4 mM dNTP mixture, 2 mM PrimeSTAR Buffer, and 1 μL forward and reverse primers (10 pM). PCR was performed using a C1000™ Thermal Cycler (Bio-Rad, Hercules, CA, USA) according to the following program: denaturation was followed by 30 cycles of 10 s at 98°C, 15 s at 50°C with a ramp time of 1°C/s, 1 min at 72°C, and 5 min of final extension at 72°C. The PCR product was purified using a PCR purification kit (LaboPass™ PCR; Cosmo Genetech, Seoul, Korea), according to the manufacturer’s instructions. Cycle sequencing and the sequencing reactions were performed by an external company (Solgent, Daejeon, Korea). All sequences were edited using Chromas (Technelysium, South Brisbane, Australia) and aligned using the ClustalW algorithm of the software MEGA3. All sequence distances were calculated using MEGA3. Additionally, a dendrogram phylogenetic tree was constructed according to Kimura2-parameters.
Table 2.
Amplification and sequencing primers used in this study
| Primer name | Direction | Sequence (5’ to 3’) |
|---|---|---|
| ITSp 1 | Forward | TACCGATTGAATGRTCCG |
| ITS 4 | Reverse | TCCTCCGCTTATTGATATGC |
| rbcL-1F | Forward | ATGTCACCACAAACAGAAAC |
| rbcL-1352R | Reverse | CAGCAACTAGTTCAGGRCTCC |
RAPD analysis
RAPD amplification using 95 primers (Table 3) was repeated twice. The amplification was performed according to the protocol previously described by Williams. Briefly, amplification was performed with 1 μL of genomic DNA (~ 20 ng) in a 20 μL reaction volume containing 10 μL 2 × EF-Taq Premix (Solgent) and 2 μL 10 pM primer (UBC, Canada). PCR was performed using a C1000™ Thermal Cycler (Bio-Rad) under the following conditions: initiation with 5 min of denaturation at 95°C, followed by 35 cycles of 40 s at 95°C, 30 s at 38°C with a ramp time of 1°C/s, 1 min at 72°C, and 5 min of final extension at 72°C. PCR products were analyzed on 1.5% agarose gels at 130 V constant voltage for approximately 40 min, visualized under ultraviolet light and photographed.
Table 3.
List of the sequences of the UBC 10-mer oligonucleotide primers used for RAPD analysis
| Primer sequences | |||||
|---|---|---|---|---|---|
|
| |||||
| No. | Sequences (5’ to 3’) | No. | Sequences (5’ to 3’) | No. | Sequences (5’ to 3’) |
| UBC-001 | CCT GGG CTT C | UBC-315 | GGT CTC CTA G | UBC-491 | TCC TGT CAA G |
| UBC-011 | CCC CCC TTT A | UBC-321 | ATC TAG GGA C | UBC-495 | CTT TCC TTC C |
| UBC-021 | ACC GGG TTT C | UBC-325 | TCT AAG CTC G | UBC-501 | CGG ATA TAC C |
| UBC-030 | CCG GCC TTA G | UBC-331 | GCC TAG TCA C | UBC-511 | GAA TGG TGA G |
| UBC-040 | TTA CCT GGG C | UBC-335 | TGG ACC ACC C | UBC-521 | CCG CCC CAC T |
| UBC-051 | CTA CCC GTG C | UBC-341 | CTG GGG CCG T | UBC-531 | GCT CAC TGT T |
| UBC-060 | TTG GCC GAG C | UBC-345 | GCG TGA CCC G | UBC-541 | GCC CCT TTA C |
| UBC-071 | GAG GGC GAG G | UBC-351 | CTC CCG GTG G | UBC-551 | GGA AGT CCA C |
| UBC-080 | GTG CTC TAG A | UBC-355 | GTA TGG GGC T | UBC-561 | CAT AAC GAC C |
| UBC-100 | ATC GGG TCC G | UBC-361 | GCG AGG TGC T | UBC-571 | GCG CGG CAC T |
| UBC-101 | GCG GCT GGA G | UBC-365 | TAG ACA GAG G | UBC-581 | CCC GTT AAG G |
| UBC-111 | AGT AGA CGG G | UBC-371 | TCT CGA TTG C | UBC-591 | TCC CTC GTG G |
| UBC-121 | ATA CAG GGA G | UBC-376 | CAG GAC ATC G | UBC-601 | CCG CCC ACT G |
| UBC-131 | GAA ACA GCG T | UBC-381 | ATG AGT CCT G | UBC-611 | CCA TCG TAC C |
| UBC-141 | ATC CTG TTC G | UBC-386 | TGT AAG CTC G | UBC-621 | GTC TGC GCT A |
| UBC-151 | GTC GTA GTG T | UBC-391 | GCG AAC CTC G | UBC-631 | GGC TTA ACC G |
| UBC-161 | CGT TAT CTC G | UBC-395 | TCA CTT GAG G | UBC-641 | TGG AAC CAT G |
| UBC-171 | TGA CCC CTC C | UBC-401 | TAG GAC AGT C | UBC-651 | TCA TTT CGC C |
| UBC-181 | ATG ACG ACG G | UBC-405 | CTC TCG TGC G | UBC-661 | CCT GCT TAC G |
| UBC-191 | CGA TGG CTT T | UBC-411 | GAG GCC CGT T | UBC-671 | CAT TAA GGC G |
| UBC-201 | CTG GGG ATT T | UBC-415 | GTT CCA GCA G | UBC-681 | CCC CCG GAC T |
| UBC-211 | GAA GCG CGA T | UBC-421 | ACG GCC CAC C | UBC-691 | AAA CCA GGC G |
| UBC-221 | CCC GTC AAT A | UBC-425 | CGT CGG GCC T | UBC-701 | CCC ACA ACC C |
| UBC-231 | AGG GAG TTC C | UBC-431 | CTG CGG GTC A | UBC-711 | CCC TCT CCC T |
| UBC-241 | GCC CGA CGC G | UBC-435 | CTA GTA GGG G | UBC-721 | CCC TTC CCT C |
| UBC-251 | CTT GAC GGG G | UBC-441 | CTG CGT TCT T | UBC-731 | CCC ACA CCA C |
| UBC-261 | CTG GCG TGA C | UBC-445 | TAG CAG CTT G | UBC-741 | CCT CCC TCT C |
| UBC-271 | GCC ATC AAG A | UBC-451 | CTA ATC TCG C | UBC-751 | CCC ACC ACA C |
| UBC-281 | GAG AGT GGA A | UBC-455 | AGC AAG CCG G | UBC-761 | GAG AGG AGG G |
| UBC-291 | AGC TGA AGA G | UBC-461 | CCC GTA TGT C | UBC-771 | CCC TCC TCC C |
| UBC-301 | CGG TGG CGA A | UBC-471 | CCG ACC GGA A | UBC-781 | GGG AAG AAG G |
| UBC-305 | GCT GGT ACC C | UBC-481 | GTA ATT GCG C | UBC-791 | GTG GGT TGT G |
| UBC-311 | GGT AAC CGT A | UBC-485 | AGA ATA GGG C | ||
SCAR analysis
The diagnostic band for A. calamus amplified using RAPD primer UBC-681 (5’-CCCCCGGACT-3’), which was approximately 246 bp in length, was purified using a LaboPass™ gel extraction kit (Cosmo Genetech). Cycle sequencing and the sequencing reaction itself were performed by an external company (Solgent). These sequences were used to construct alignments based on SCAR markers, and primers for Aca681-F/R and were designed using Primer Express (Bioneer, Daejeon, Korea). The PCR conditions for each 20 μL reaction were as follows: 1 μL of genomic DNA (~ 20 ng) was added to 10 μL 2 × EF-Taq Premix (Solgent) and 1 μL each of 10-pM primers. PCR was performed using a C1000™ Thermal Cycler (Bio-Rad), with 5 min of denaturation at 95°C, 30 cycles of 40 s at 95°C, 30 s at 55°C with a ramp time of 1°C/s, 1 min at 72°C, and 5 min of a final extension at 72.
Results
ITS sequence analysis and the design of specific primers for distinguishing A. calamus and A. tatarinowii from A. gramineus
Amplified ITS sequences, 564 bp long, from the 3 species of Acori were compared. Compared to A. gramineus, the sequence of A. calamus showed 27 bp of substitutions, 16 bp of insertions, and 4 bp of deletions, which correlates to 92% (517 bp/564 bp) homology. Additionally, 15 bp of substitutions, 15 bp of insertions, and 2 bp of deletions were found in A. tatarinowii, correlating with 94% (532 bp/564 bp) homology (Figure 1). Analysis of the phylogenetic tree constructed using ITS sequences showed that Acori can be classified into 3 groups: A. gramineus, A. calamus, and A. tatarinowii. A. gramineus was shown to be more closely related to A. tatarinowii than to A. calamus (data not shown).
Figure 1.
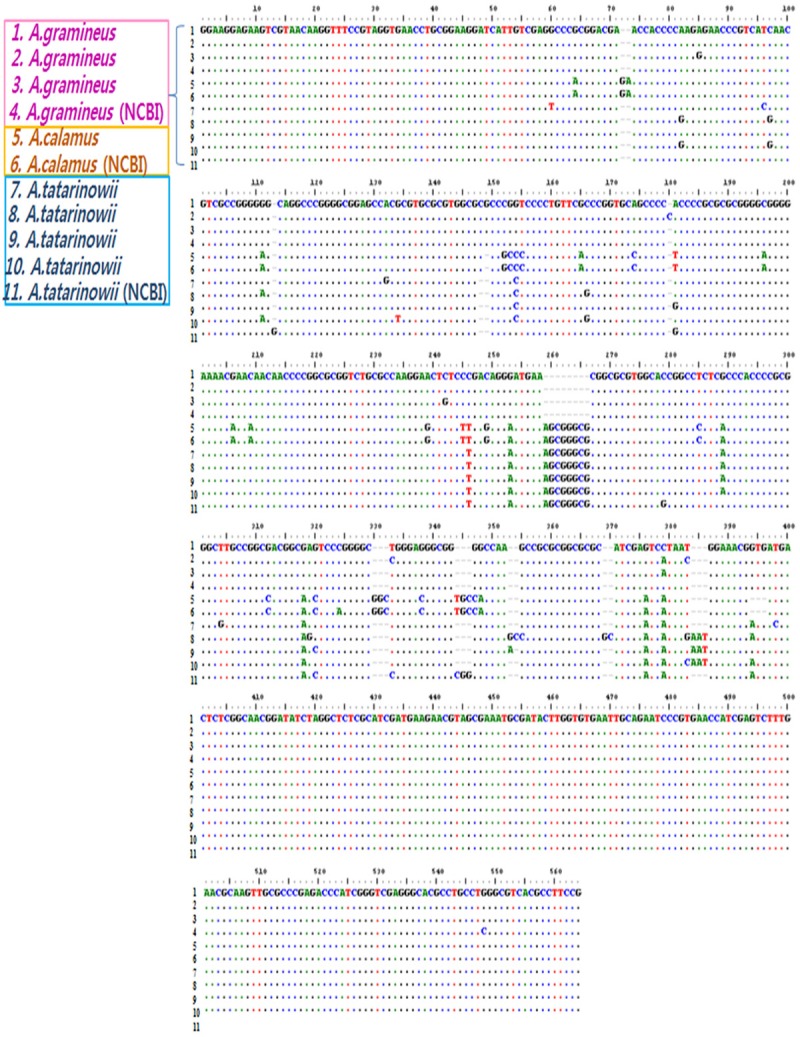
Partial ITS gene sequence alignment for Acorus gramineus, A. calamus, and A. tatarinowii compared with sequences from the NCBI database.
To distinguish between the 3 species of Acori, ITS-specific primers were designed and tested. However, the specific primers proved to be inappropriate for distinguishing between the 3 species because of low reproducibility. Accordingly, a primer recognizing the same locus in both A. calamus and A. tatarinowii was designed (Figure 2). This specific primer was confirmed to be suitable for distinguishing A. calamus and A. tatarinowii from A. gramineus.
Figure 2.
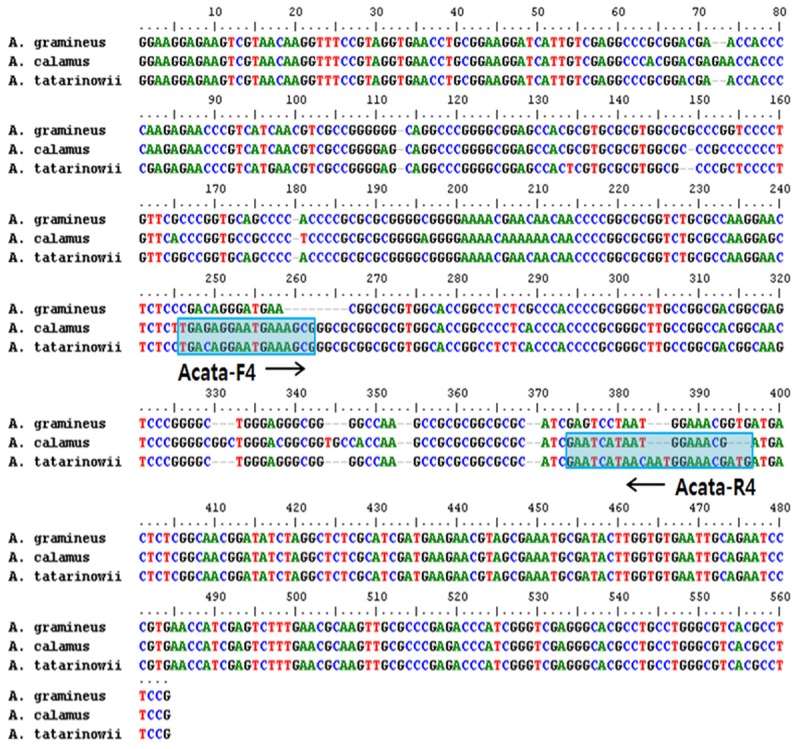
Alignment of ITS sequences from Acorus gramineus, A. calamus, and A. tatarinowii, showing the sequence used to design the primer pair.
Analysis of the rbcL sequence from chloroplast DNA and design of internal primers
Analysis of nucleotide sequences amplified using primers for the rbcL region of chloroplast DNA (cpDNA) showed that the size of the amplified fragment was 523 bp in A. gramineus, 437 bp in A. calamus, and 380 bp in A. tatarinowii. The rbcL region showed no intraspecific nucleotide variation, at the interspecific level, the sequences shared 99% homology, with a 1 bp variation. Thus, the rbcL region of cpDNA was observed to be highly homologous between species, and we designed a pair of primers common to the 3 species of Acori based on this region (Figure 3).
Figure 3.
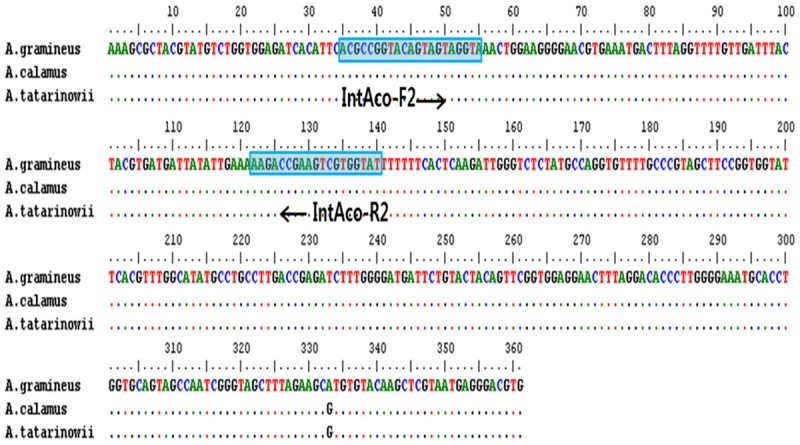
Comparison of rbcL sequences from Acorus gramineus, Acorus calamus, and Acorus tatarinowii showing the sequences used to design the internal primer pair (IntAco-F2/R2).
Development of a pair of specific primers for identifying A. calamus by RAPD analysis
To identify A. calamus, a pair of specific primers (Aca681-F/R) was designed based on analysis of the sequencing results from the UBC 681 primer. This primer pair produced a 246 bp amplicon and only recognized A. calamus (Figure 4). Additionally, a pair of specific primers (Aca681-F/R) was confirmed for all samples.
Figure 4.
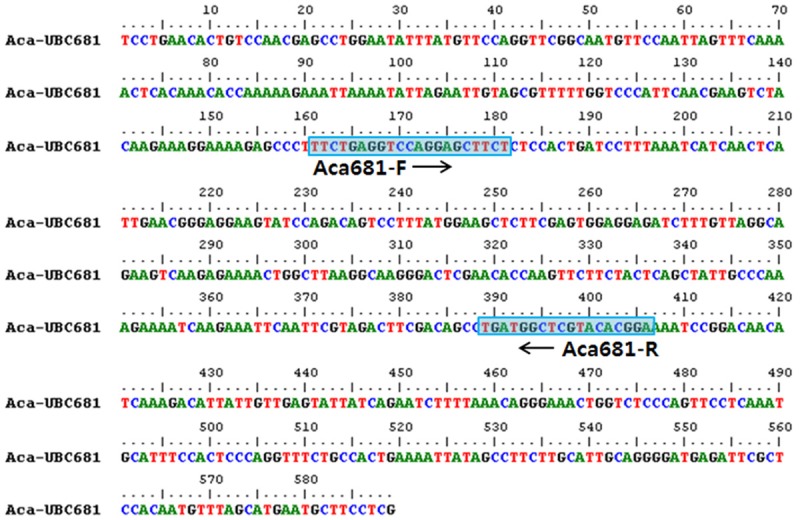
Characteristics of specific primers designed for discrimination of A. calamus. Sequence of A. calamus amplified by the UBC-681 RAPD primer and the A. calamus-specific RAPD amplicon (Aca681-F/R).
Multiplex PCR analysis
We developed primers that could be used to simultaneously distinguish between A. gramineus, A. calamus, and A. tatarinowii. Six primers were designed, including A. cata-F4 and A. cata-R4, which amplifies sequences in both A. calamus and A. tatarinowii, Aca681-F and Aca681-R, which amplifies sequence in A. calamus, and IntAco-F2 and IntAco-R2, which simultaneously amplifies sequences in all 3 species (Table 4). When multiplex PCR was conducted using all 6 primers, 246 bp and 153 bp bands were observed in A. calamus, a 153 bp band was observed in A. tatarinowii, and an identical 138 bp band was observed in all 3 species (Figure 5). These results confirmed that the specific primers developed in this study can be used to distinguish between the 3 species of Acori using multiplex PCR. Additionally, optimal PCR conditions were determined.
Table 4.
The sequence of the primers designed in this study
| Primer name | Direction | Sequence (5’ to 3’) |
|---|---|---|
| Aca681-F | Forward | TTC TGA GGT CCA GGA GCT TCT |
| Aca681-R | Reverse | TCC GTG TAC GAG CCA TCA |
| Acata-F4 | Forward | TGA CAG GAA TGA AAG CGG |
| Acata-R4 | Reverse | CAT CGT TTC CAT TCT TAT GAT TC |
| IntAco-F2 | Forward | ACG CCG GTA CAG TAG TAG GTA |
| IntAco-R2 | Reverse | ATA CCA CGA CTT CGG TCT T |
Figure 5.
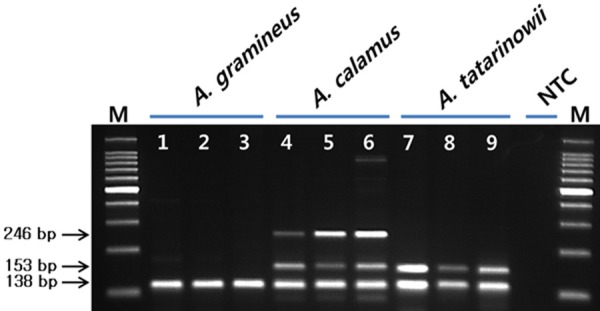
PCR profile using Acata F4/R4 primer designed from the partial ITS gene sequence and Aca681-F/R primer designed form RAPD analysis using the random primer UBC 681 (M: size marker, 1-3: Acorus gramineus, 4-6: A. calamus, 7-9: A. tatarinowii, NTC: No Template Control).
Monitoring
For monitoring, an allelic discrimination assay was used. This method was also applied to commercially distributed AGR (monitoring no. 1-69) in Korea. A total 52 of monitoring samples clustered with the sequence of A. gramineus, 7 monitoring samples clustered with the sequence of A. calamus, and 10 monitoring samples clustered with the sequence of A. tatarinowii (Table 5). All samples had been sold as A. gramineus in the commercial market. These results suggest that our method can be used to identify AGR in the Korean market. The SCAR marker was used to confirm that identification of AGR in the market is possible.
Table 5.
Monitoring of Acori Graminei Rhizoma purchased from Korean markets
| Monitoring No. | Identification Results | Monitoring No. | Identification Results | Monitoring No. | Identification Results |
|---|---|---|---|---|---|
| 1 | A. gramineus | 24 | A. tatarinowii | 47 | A. gramineus |
| 2 | A. calamus | 25 | A. gramineus | 48 | A. gramineus |
| 3 | A. tatarinowii | 26 | A. gramineus | 49 | A. gramineus |
| 4 | A. gramineus | 27 | A. gramineus | 50 | A. gramineus |
| 5 | A. gramineus | 28 | A. gramineus | 51 | A. tatarinowii |
| 6 | A. gramineus | 29 | A. gramineus | 52 | A. gramineus |
| 7 | A. gramineus | 30 | A. gramineus | 53 | A. gramineus |
| 8 | A. gramineus | 31 | A. gramineus | 54 | A. gramineus |
| 9 | A. gramineus | 32 | A. gramineus | 55 | A. gramineus |
| 10 | A. gramineus | 33 | A. gramineus | 56 | A. tatarinowii |
| 11 | A. tatarinowii | 34 | A. gramineus | 57 | A. gramineus |
| 12 | A. gramineus | 35 | A. gramineus | 58 | A. calamus |
| 13 | A. gramineus | 36 | A. gramineus | 59 | A. calamus |
| 14 | A. gramineus | 37 | A. tatarinowii | 60 | A. calamus |
| 15 | A. tatarinowii | 38 | A. gramineus | 61 | A. calamus |
| 16 | A. gramineus | 39 | A. gramineus | 62 | A. gramineus |
| 17 | A. gramineus | 40 | A. gramineus | 63 | A. calamus |
| 18 | A. calamus | 41 | A. gramineus | 64 | A. tatarinowii |
| 19 | A. gramineus | 42 | A. gramineus | 65 | A. gramineus |
| 20 | A. gramineus | 43 | A. gramineus | 66 | A. gramineus |
| 21 | A. gramineus | 44 | A. gramineus | 67 | A. tatarinowii |
| 22 | A. gramineus | 45 | A. gramineus | 68 | A. gramineus |
| 23 | A. gramineus | 46 | A. tatarinowii | 69 | A. gramineus |
Discussion
Analysis of nuclear ribosomal DNA sequence data showed that the ITS regions of A. gramineus, A. calamus, and A. tatarinowii are 601 bp, 660 bp, and 624 bp long, respectively. When these ITS regions were compared with nucleotide sequences from GenBank (National Center for Biotechnology Information, Bethesda, MD, USA) using a BLAST search, A. gramineus was confirmed to share 99% homology (600 bp/601 bp) with NCBI A. gramineus DQ008849, with only a single one-bp substitution. No nucleotide sequence variation was observed among the 6 samples of A. gramineus. A. calamus share 99% homology (550 bp/551 bp) with NCBI A. calamus DQ008848, with only a single one-bp substitution. No nucleotide sequence variation was observed among the six samples of A. calamus. Samples of A. tatarinowii were confirmed to share 95-97% homology (529-536 bp/552 bp) with NCBI A. tatarinowii DQ008845. Because each sample showed substitutions and insertions of 16-23 bp in diverse locations, A. tatarinowii appears likely to contain a large number of intraspecific nucleotide polymorphisms.
Identifying the origin of medicinal herbs is very important because their origin is relevant to the effects of the herbs. However, nearly all imported medicinal herbs are dried or processed, making it difficult to distinguish between similar species and production regions based on appearance. In this study, we developed specific primers that can be used to distinguish between three species of herbs in the genus Acorus using multiplex PCR, along with optimal PCR conditions for their use. These specific primers can be used to identify both dried and fresh plants. Additionally, a survey of samples purchased at markets in Korea using these primers confirmed the incorrect labeling of A. gramineus bands and showed that most plants from the Acorus are A. gramineus in the Korean market.
Acknowledgements
This research was supported by a grant from The Korea Institute of Oriental Medicine (Grant No. K14080) and a grant (09112KFDA890) from The Korean Food & Drug Administration in 2010.
Disclosure of conflict of interest
None.
References
- 1.Yoo YK. Effects of Plant Growth Regulators and Several Conditions on Rooting and Shoot Growth in Rhizome Cutting of Acorus gramineus. Korean J Hortic Sci. 2009;27:560–566. [Google Scholar]
- 2.Zhu S. Universal Salvation Formulary or Prescriptions for Universal Relief. Pu ji fang. 1406 [Google Scholar]
- 3.Gu BS, Lee DU. Antioxidative effect of the essential oil from the Rhizomes of Acorus gramineus. Kor J Life Sci. 2001;11:503–508. [Google Scholar]
- 4.Choi GY, Kim HJ, Ju YS. Study on Internal-External Morphological Analysis in Acori Graminei Rhizoma. Kor J Ori Med. 2006;12:91–100. [Google Scholar]
- 5.Kim YH, Kim ES, Ko BS, Uddin MR, Oh SE, Choi GY, Chae SW, Lee HW, Lee JH, Park JY, Lee MY. Internal transcribed spacer-based identification of Bupleurum species used as sources of medicinal herbs. J Med Plants Res. 2012;6:841–848. [Google Scholar]
- 6.Ryuk JA, Choi GY, Kim YH, Lee HW, Lee MY, Choi JE, Ko BS. Application of genetic marker and real-time polymerase chain reaction for discrimination between Forsythia viridissima and Forsythia suspensa . Biol Pharm Bull. 2010;33:1133–1137. doi: 10.1248/bpb.33.1133. [DOI] [PubMed] [Google Scholar]
- 7.Shinde VM, Dhalwal K, Mahadik KR, Joshi KS, Patwardhan BK. RAPD Analysis for Determination of Components in Herbal Medicine. Evid-based Compl Alt. 2007;4:21–23. doi: 10.1093/ecam/nem109. [DOI] [PMC free article] [PubMed] [Google Scholar]
- 8.Katoh K, Toh H. Parallelization of the MAFFT multiple sequence alignment program. Bioinformat. 2010;26:1899–1900. doi: 10.1093/bioinformatics/btq224. [DOI] [PMC free article] [PubMed] [Google Scholar]
- 9.Paran I, Michelmore RW. Development of reliable PCR-based markers linked to downy mildew resistance genes in lettuce. Theor Appl Genet. 1993;85:985–993. doi: 10.1007/BF00215038. [DOI] [PubMed] [Google Scholar]
- 10.Lee JH, Kim IS, Lee SG, Rim KS, Kim SG, Han TH. Analysis of Genetic Diversity of Korean Accessions of the Genus Acorus Using RAPD Markers and NIR Spectroscopy. Korean J Hortic Sci. 2011;29:232–239. [Google Scholar]
- 11.Moon BC, Ji Y, Lee YM, Chun JM, Lee AY, Choo BK, Kim HK. Development of SCAR Markers for the Authentication of Acori Rhizoma Based on the Analysis of RAPD and Multiplex-PCR. Kor J Med Crop Sci. 2011;19:162–169. [Google Scholar]


