

Abstract
At the center of the computational cerebellar circuitry are Purkinje cells, which integrate synaptic inputs from >150,000 granule cell inputs. Traditional theories of cerebellar function assume that all granule cell inputs are comparable. However, it has recently been suggested that the two anatomically distinct granule cell inputs, ascending and parallel fiber, have different functional roles. By systematically examining the efficacy of patches of granule cells with photostimulation, we found no differences in the efficacy of the two inputs in driving the activity of, or in producing postsynaptic currents in, Purkinje cells in cerebellar slices in vitro. We also found that the activity of Purkinje cells was significantly increased upon stimulation of lateral granule cells in vivo. Moreover, when we estimated parallel fiber and ascending apparent unitary EPSC amplitudes using photostimulation in cerebellar slices in vitro, we found them to be indistinguishable. These results are inconsistent with differential functional roles for these two inputs. Instead, our data support theories of cerebellar computation that consider granule cell inputs to be functionally comparable.
Introduction
To orchestrate the signals required to coordinate movement, the circuitry of the cerebellum samples sensory and cortical information related to the execution and planning of movements (Ito, 1984). Cerebellar Purkinje cells integrate this information from >150,000 granule cell inputs and associated feedforward inhibition (Napper and Harvey, 1988; Harvey and Napper, 1991).
Traditional theories of cerebellar computation assume that all granule cell inputs have comparable potencies and functions (Braitenberg and Atwood, 1958; Eccles et al., 1967; Marr, 1969; Albus, 1971; Eccles, 1973; Ito, 1984). However, anatomically, granule cell synapses belong to one of two classes: ascending and parallel fiber. Ascending synapses form as the granule cell axons rise into the molecular layer and contact the dendrites of Purkinje cells immediately above them (Mugnaini, 1972; Palay and Chan-Palay, 1974). These axons then bifurcate and make parallel fiber synapses onto hundreds of Purkinje cells (Napper and Harvey, 1988; Harvey and Napper, 1991). A question central to theories of cerebellar computation, and a topic of much debate and controversy (Barbour, 1993; Isope and Barbour, 2002; Sims and Hartell, 2005, 2006; Marcaggi and Attwell, 2007), is whether these two anatomically distinct inputs play differential functional roles.
Classic theories of cerebellar function assume that activation of any discrete patch of granule cells similarly increases the activity of a Purkinje cell. A common observation in vivo, however, is that only patches of granule cells located beneath a Purkinje cell drive its activity (Bower and Woolston, 1983; Jaeger and Bower, 1994; Santamaria et al., 2007). This observation led to the hypothesis that ascending inputs are more powerful and have different functional roles than parallel fiber inputs (Llinas, 1982; Santamaria et al., 2002, 2007; Santamaria and Bower, 2005; Sims and Hartell, 2005, 2006).
In support of this hypothesis, recent observations suggest that the amplitude of EPSCs mediated by ascending inputs are larger than those evoked by parallel fiber inputs (Sims and Hartell, 2005). Moreover, it is also suggested that a granule cell has a much higher probability of forming an ascending input with a Purkinje cell than a parallel fiber input (Isope and Barbour, 2002). These studies predict that a patch of granule cells positioned to form ascending synapses can be 3.1- to 8.5-fold more efficacious in driving the firing of a Purkinje cell. However, recent in vivo data obtained in the absence of feedforward inhibition provide little evidence in support of this prediction (Santamaria et al., 2007).
Using a novel approach, we mapped the efficacy of different patches of granule cells in driving the activity of Purkinje cells with glutamate photostimulation. These experiments did not support differential functional roles for ascending and parallel fiber inputs. To explore the basis for their similar efficacies, we used photostimulation to estimate their respective apparent unitary EPSCs and found them to be comparable. Our findings support theories of cerebellar computation that assume that EPSCs resulting from parallel fiber and ascending inputs are functionally equivalent.
Materials and Methods
Cerebellar slice preparation.
All experiments were performed in accordance with the guidelines and recommendations set by Albert Einstein College of Medicine. Wistar rats of the ages 12–19 d or 2–3 months were anesthetized with halothane and decapitated. Four-hundred-micrometer-thick slices were made from the cerebellar vermis in the coronal plane or ∼20° to the coronal plane (Isope and Barbour, 2002), or 300-μm-thick sagittal slices were made using a modified Oxford vibratome. Slices were kept at room temperature until use (1–4 h) in extracellular solution containing the following (in mm): 125 NaCl, 2.5 KCl, 26 NaHCO3, 1.25 NaH2PO4, 1 MgCl2, 2 CaCl2, 10 glucose, at a pH of 7.4 when gassed with 5% CO2/95% O2.
In vitro electrophysiological recordings.
Slices were placed in a recording chamber on the stage of an upright Olympus or Zeiss microscope and Purkinje cells visualized using a 40× water-immersion objective (numerical aperture 0.8) with infrared optics. Slices were constantly superfused at a rate of 1.5 ml/min with the extracellular solution maintained at 35 ± 1°C and containing 100 μm picrotoxin (Sigma) to block GABAA receptors and 1 μm CGP 55845 (Tocris) to block GABAB receptors. Extracellular recordings were made from single Purkinje cells using a home-made differential amplifier and pipettes filled with extracellular solution. Under visual guidance, the electrodes for extracellular recordings were placed along the axon of Purkinje cells where the greatest voltage deflections were obtained. For each experiment a detailed schematic drawing of the field of view was constructed by carefully drawing the position of the soma of the target Purkinje cell and the orientation and trajectory of its proximal dendrite. In addition, at the end of the experiment, a detailed note was made of the orientation of the folium and that of the white matter. These schematic drawings were used to visually estimate the location of the patch of granule cells that were most likely to contain ascending axons.
Whole-cell voltage-clamp recordings were performed with an Optopatch amplifier (Cairn Research) with electrodes pulled from borosilicate glass with a resistance of 1–3 MΩ when filled with an internal solution containing the following (in mm): 120 Cs-gluconate, 10 CsF, 20 CsCl, 10 EGTA, 10 HEPES, 3 MgATP, and 2 QX-314 to block voltage-gated sodium channels, pH 7.4 with CsOH. To determine the dendritic plane of voltage-clamped Purkinje cells, 100 μm Alexa Fluor 488 was added to the patch-pipette solution and visualized using standard epifluorescence microscopy with a 485 ± 15 nm bandpass filter and 530 ± 15 nm emission filter. For experiments performed in slices from juvenile rats, Purkinje cells were whole-cell voltage clamped at −60 mV. To maintain adequate voltage clamp when monitoring EPSCs in Purkinje cells from adult rats, Purkinje cells were voltage clamped with reduced driving forces (−20 to −40 mV). The maximum voltage-clamp error obtained in any mapping experiment from juvenile and adult animals was estimated to be <13% of the driving force, while the error associated with the apparent unitary EPSC recordings was on average ∼6%. Whole-cell data were sampled at 10 kHz using a National Instruments analog-to-digital converter (PCI-MIO-16XE-10), and acquired and analyzed using custom software written in LabView (National Instruments).
Granule cell photostimulation.
For photolysis experiments, 200–250 μm MNI-caged l-glutamate (Tocris) was added to the bathing solution and recirculated over the slice to allow preequilibration. The energy source for glutamate photolysis was a multiline UV Coherent Innova 300C Krypton ion laser. The light from the laser was gated to achieve a 1 ms pulse for photolysis and its energy further adjusted (0–100%) using an acousto-optical modulator (NEOS). The laser light was transmitted to the microscope via a fiber optic cable, collimated, and positioned via a pair of galvos (Cambridge Technology) driven by the data acquisition software. The laser light was focused to form a 40-μm-diameter spot, and glutamate was photoreleased every 5 s. The energy of this spot corresponded to maximally 3.5 mW for the mapping experiments, and maximally 0.1–0.3 mW for experiments examining the apparent unitary current amplitude of granule cells.
For mapping experiments, using custom software written in LabView, every 5 s the photolysis spot was randomly moved to one of 117 positions on a 520 × 360 μm grid (low-resolution mapping) or to one of 63 positions on a 200 × 160 μm grid positioned within the granule cell layer beneath the soma of the Purkinje cell under study. In some experiments, the interphotolysis interval was increased to 30 s. There were no differences in the data obtained with this longer interval, and thus the data were pooled. Mapping experiments were performed in one of two ways: either with photolysis time locked to occur with the firing of an action potential using a home-made timing device or with photolysis occurring randomly at any time during the interspike interval. MNI-caged l-glutamate at the concentrations used is neither an agonist nor an antagonist for glutamate receptors (Canepari et al., 2001).
Granule cells making ascending inputs were activated by placing the spot in the granule cell layer within the plane of the dendrites of the target Purkinje cell. To activate granule cells making parallel fiber inputs, the spot was positioned >100 μm lateral to the dendritic plane.
In all photolysis mapping experiments, there is the possibility that in addition to granule cells, unipolar brush cells (UBCs) were also activated. These excitatory neurons contact several laterally located granule cells and could in principle reduce the resolution of the maps. However, there are many reasons to believe that the extent to which UBCs might have affected the resolution of the maps was minimal. First, UBCs are present at low densities in the cerebellar cortex of mice and rats. Depending on the folium, the ratio of UBC:PC could be as low as 0.1:1, and at most 4:1 (Takács et al., 1999; Nunzi et al., 2002; Sekerková et al., 2007; Diño and Mugnaini, 2008). Within our regions of interest (vermis and lobules V, VI, VII, and VIII), the ratio of UBC:PC is ∼0.5 (Takács et al., 1999). Given that in the rat the granule cell:PC ratio is on the order of 500:1 (Palay and Chan-Palay, 1974), the density of UBCs is expected to be in the range of 1/1000 to 1/2000 that of granule cells. Second, the input resistance of UBCs is significantly lower than that of granule cells (by approximately twofold), and its capacitance is threefold to fivefold higher (Russo et al., 2007). Thus, with the brief 1 ms pulses of glutamate photoreleased, which activate glutamate receptors throughout the cell (including in the soma), it is twice as likely that a granule cell is brought to threshold as a UBC. Collectively, taking into account both relative density and activation differences, for every 2000 granule cells directly activated by photolysis, only one UBC is likely to be activated in our slices. We estimate in our mapping experiments that we activate, at the very most, 180 granule cells (typically ∼50) with each pulse of glutamate (Walter and Khodakhah, 2009), and thus it is unlikely that we activated any UBCs. Under our experimental conditions, it is unlikely UBCs had much, if any, impact on the resolution of the maps and our results.
In vivo experiments.
Recordings were made from Purkinje cells of 8- to 10-week-old male C57BL mice under isoflurane anesthesia. An ∼1.5 mm hole was made at the midline using a drill at bregma −5.9 to −6.2 mm, taking extreme caution not to touch the underlying cerebellar cortex.
Single-unit recordings from Purkinje cells were performed using platinum quartz electrodes (2–3 MΩ; Thomas Recording system). Signals from the microelectrode were bandpass filtered (80 Hz to 10 kHz), amplified, and fed into a Plexon Neuro-technology A/D system (40 kHz sampling per channel). Waveforms were sorted off-line using standard methods implemented in commercial software (Plexon Offline Sorter). Specifically, we performed an off-line principal-components analysis on the waveform snippets that exceeded our threshold, and then ran a clustering algorithm on the waveforms represented in this space. Finally, we hand sorted the output of this algorithm to ensure that the resultant waveforms represent data from a single neuron, relying on consistency in spike shape and evidence of a clear refractory period in the interspike interval histogram. The presence of complex spikes and an ensuing pause of the simple spike firing were used to identify Purkinje cells.
Granule cells 300 or 600 μm away from the recording site were stimulated using Thomas stimulation electrodes (∼0.1 MΩ) using a 100 μs constant-current pulse (Digitimer). The stimulation intensities were comparable for both locations and across all experiments ranged from 0.05 to 2 mA.
Data analysis.
The in vitro data acquisition and analysis program was written in house using LabView software. For data acquired with extracellular recordings, the poststimulus maximum firing rate was defined as the maximum instantaneous firing rate (reciprocal of individual interspike interval) in the response. The response duration was defined as the time taken for the poststimulus instantaneous firing rate to return to within two SDs of the average prestimulus baseline firing rate. Baseline firing rate was calculated by averaging the 20 prestimulus instantaneous firing rates. In the extracellular mapping experiments, the location of the patch of granule cells making ascending inputs to the target Purkinje cell (located immediately below the dendritic plane) was determined by two independent researchers using the detailed schematics constructed during the experiment.
To generate EPSC amplitude histograms, in each experiment >200 EPSCs were recorded in response to single photolytic stimulations of the granule cell layer. The peak EPSC amplitude was measured with respect to a set reference point immediately before the stimulus. The stimulus was adjusted to an intensity that produced both failures and EPSCs of various amplitudes. In the context of this experimental paradigm, a failure may be representative of a situation in which no granule cells are activated by stimulation or one in which none of the activated terminals release neurotransmitter. If a granule cell is activated and releases neurotransmitter it will result in an EPSC. From trial to trial, such EPSCs may arise from activation of different granule cells. Moreover, an EPSC can result from simultaneous activation of several synapses. The only assumption made is that the resulting EPSCs belong to the same population. Several responses were analyzed to determine the time at which the EPSC reached its maximum amplitude and a single time to peak was used to obtain the peak EPSC amplitude for all trials. For each trial, noise was also measured and used to construct a noise histogram. Noise was measured as the difference between the reference point and the amplitude of baseline preceding it. The time difference between the reference point and the baseline were set to be the same as the time between the reference point and EPSC peak. To minimize noise, amplitudes were obtained from the average of 1-ms-long segments of data centered at each time point.
Amplitude histograms had bin widths of 2 pA and were fit with a function that was a sum of Gaussians with all of the following constraints: (1) the SD of the Gaussian representing failures had the same SD as the Gaussian fit to the baseline noise histogram; (2) the SD of the Gaussian fit to the first response had to be greater than the SD of the noise. The SDs of subsequent Gaussians fit to the second, third, … responses had to increase with the absolute mean of the Gaussians; (3) the peak-to-peak distance between the means of Gaussians had to be equal; and (4) if multiple Gaussians were required to represent multiple nonfailure responses, then the ratio of the areas of the Gaussians was forced to correspond to that produced by a binomial distribution with independent populations, each having a probability of occurrence over the range of 0.3–0.5.
Average data are presented as means ± SEM unless otherwise noted, with p values calculated using one-way ANOVA and considered statistically significant at p < 0.05.
Results
Functional mapping of granule cell to Purkinje cell inputs in juvenile rats
We systematically examined the efficacy of different patches of granule cells in driving the activity of a Purkinje cell. In the first set of experiments, extracellular recordings were used to monitor the activity of Purkinje cells in acutely prepared cerebellar slices to avoid alterations in their rate and pattern of activity. To selectively assay the excitatory efficacy of different granule cell patches, feedforward inhibition was pharmacologically blocked using 100 μm picrotoxin to block GABAA receptors and 1 μm CGP 55845 to block GABAB receptors.
We used glutamate photolysis to activate spatially restricted patches of granule cells. This method of stimulation has the advantage over electrical stimulation that it eliminates the accidental unwanted activation of climbing fibers, mossy fibers, and granule cell axons not located in the target patch. This method of stimulation has the additional benefit that it asynchronously activates granule cells (Walter and Khodakhah, 2006) as occurs in vivo (Jaeger and Bower, 1994; Chadderton et al., 2004; Jörntell and Ekerot, 2006; Rancz et al., 2007). This was evident in both the kinetics and noise of currents recorded in voltage-clamped Purkinje cells. Photorelease of glutamate in the granule cell layer with a 1 ms pulse of UV light resulted in currents in a voltage-clamped Purkinje cell that were significantly slower and nosier than those resulting from the photolysis of glutamate over its dendritic tree (Fig. 1A).
Figure 1.
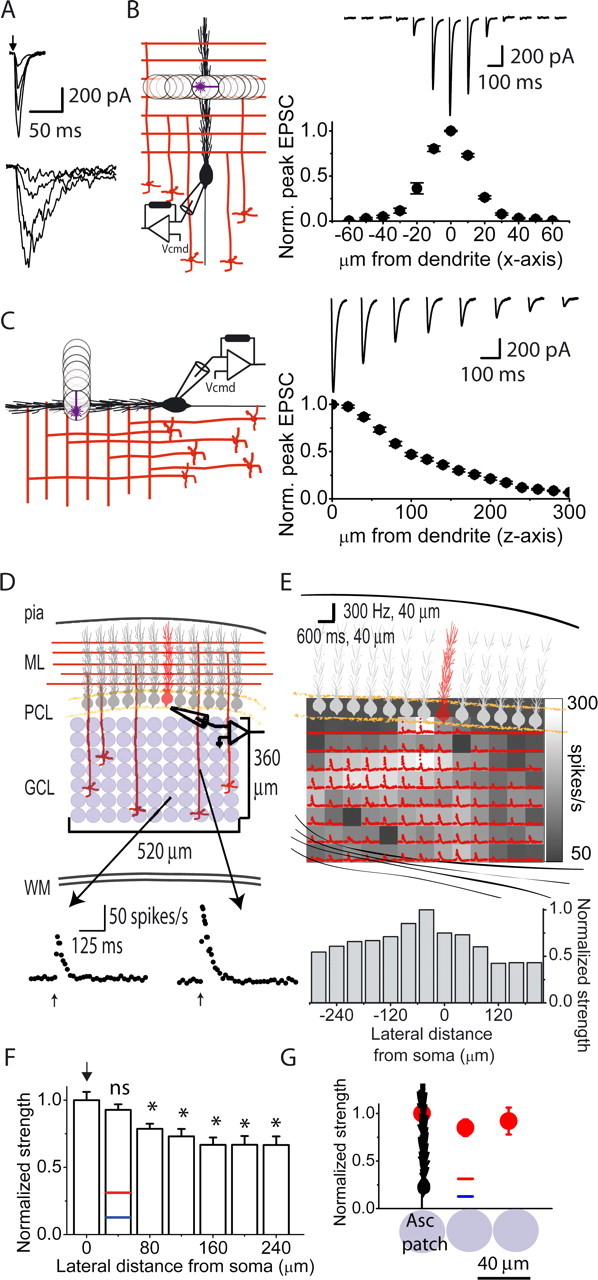
Mapping the efficacy of patches of granule cells in driving the firing of Purkinje cells. A, Glutamate-evoked currents were recorded in a voltage-clamped Purkinje cell (−60 mV) in response to photolysis of glutamate over its dendritic tree in the molecular layer (top) and in the granule cell layer beneath its soma (bottom). The kinetics of the currents resulting from photorelease of glutamate in the granule cell layer were much slower and the noise of the currents was much greater than that observed when glutamate was photoreleased directly over the dendrites of the target Purkinje cell. B, To examine the spatial selectivity of the 40 μm spot used for photolysis of glutamate in the X–Y plane, the dendrites of voltage-clamped Purkinje cells in acutely prepared coronal slices of the cerebellum were used as glutamate detectors. Using the same intensity pulse of UV light, glutamate was photoreleased at various lateral distances from the center of the dendritic tree of a voltage-clamped Purkinje cell, and the resulting currents were recorded. The photolysis spot was moved laterally in 10 μm increments in both directions. Sample glutamate-evoked currents recorded from a single Purkinje cell in response to glutamate photolysis at various lateral distances from the center of its dendritic tree are shown together with an average plot of peak EPSC amplitude as a function of photolysis location (n = 3 cells). Each raw data trace is the average of five trials. C, Experiments were performed to measure the depth of photolysis in the Z plane. Purkinje cells on the surface of sagittal cerebellar slices were voltage clamped and the intensity of the 40 μm spot of UV light was adjusted to produce a large-amplitude inward current when positioned on the surface of the slice within dendritic tree of the target Purkinje cell (0 μm from dendrite). The plane of focus was then moved vertically above the slice in 20 μm increments and the resulting currents in response to the same pulse of UV light at each location recorded. Sample glutamate- evoked currents recorded from a single Purkinje cell in response to glutamate photolysis at various vertical distances from its dendritic tree are shown together with an average plot of peak EPSC amplitude as a function of vertical distance from the Purkinje cell dendrite (n = 4 cells). Each raw data trace is the average of five trials. D, Glutamate photoreleased by a constant-intensity UV pulse activated patches of granule cells and the firing of a single Purkinje cell in a coronal cerebellar slice was monitored with extracellular recordings. Lower traces show instantaneous firing rate in response to photolysis of glutamate using the same intensity pulse of UV light at two separate locations. ML, Molecular layer; PCL, Purkinje cell layer; GCL, granule cell layer; WM, white matter. E, Top, Schematic drawing of the cerebellar slice and the Purkinje cell whose activity was recorded (shown in red). The grayscale map shows the maximum poststimulus instantaneous firing rate of the target Purkinje cell after photolysis of glutamate at each location. The instantaneous firing rate response at each location is superimposed on each location. The baseline firing rate of this Purkinje cell was 50 spikes/s. Bottom, The instantaneous maximum firing rates obtained from photolysis at each location within a column were averaged and these column strengths were then normalized to the strongest column value. F, The normalized column strengths obtained from eight maps were averaged based on lateral distances from the soma of the target Purkinje cell and renormalized to the strongest column value. Normalized strengths predicted for patches of granule cells making only parallel fiber inputs based on various estimates of granule cell connection probability and EPSC amplitudes are also shown as blue and red bars (see Results for details). Results are shown as mean ± SEM for these and all subsequent figures. * denotes statistical significance with respect to the column denoted by the arrow at p < 0.01. G, For all eight experiments included in F above, two investigators independently determined the location of the “ascending” patch in the row closest to the Purkinje cell layer. The average maximum instantaneous firing rate at the location that corresponded to the position where granule cells form ascending inputs (Asc patch) was taken as one. The relative firing rates of the adjoining patches located on either side of the ascending patch and the second adjacent pair located 80 μm away from the ascending patch were pooled and averaged. Data are presented as mean ± SEM.
We used a 40-μm-diameter photolysis spot to mimic the terminal field of a single mossy fiber branchlet in the coronal orientation (Sultan, 2001; Isope and Barbour, 2002). A photolysis spot of this diameter ensures that one examines the functional role of ascending and parallel fiber inputs in a physiological context (although admittedly photorelease of glutamate would indiscriminately activate granule cells dispersed throughout the photolysis spot, whereas a mossy fiber input would only activate the granule cells that it synapses with). To experimentally verify that we achieved the desired spatial selectivity, we used the dendrites of a Purkinje cell as a sensitive glutamate detector to empirically measure the spatial and temporal glutamate profile following photolysis. Purkinje cells in coronal cerebellar slices were voltage clamped with patch pipettes containing Alexa Fluor 488, which allowed the visualization of their dendrites. The 40 μm spot of UV light was positioned within the center of the dendritic tree of the Purkinje cell, which in this orientation has a width of ∼20 μm. The intensity of a 1 ms pulse of UV light was adjusted such that at a holding potential of −60 mV the photolysis of glutamate produced a large-amplitude (∼1 nA) inward current. The photolysis induced current had a 10–90% rise time of ∼3 ms and a decay time constant of ∼12 ms (Fig. 1B). The photolysis spot was then moved laterally in 10 μm increments, and the resulting currents in response to the same pulse of UV light were recorded (Fig. 1B). On average, moving the photolysis spot 10 μm in either direction resulted in a small (∼25%) reduction in current amplitude, since the 40 μm photolysis spot still covered a substantial fraction of the width of the dendrites. Moving the spot 20 μm laterally in either direction from the center resulted in a large (70%) reduction in the current amplitude. When the photolysis spot was positioned 30 and 40 μm away, the resulting current amplitudes were only 10 and 4% of the maximum amplitude. The kinetics of the photolysis-induced currents obtained at all locations were comparable to those obtained at the center location (Fig. 1B). Given the 20 μm width of the dendritic tree, the results suggest that under our experimental conditions, the diffusion of glutamate from the photolysis spot in the X–Y plane is negligible (see also supplemental material 1, available at www.jneurosci.org).
A similar set of experiments was performed to measure the depth of photolysis in the Z plane. Purkinje cells on the surface of sagittal cerebellar slices were voltage clamped, and the intensity of the 40 μm spot of UV light was adjusted to produce a large-amplitude inward current when positioned on the surface of the slice within the dendritic tree of the target Purkinje cell (Fig. 1C). The plane of focus was then moved vertically out of the slice in 20 μm increments, and the resulting currents in response to the same pulse of UV light at each location were recorded (Fig. 1C). With these experiments, the EPSC amplitudes detected by the dendrites of a Purkinje cell decline to half maximal in ∼100 μm. As is also the case for similar experiments performed in the X–Y plane, this value is likely to be an overestimate because (1) the dendrites themselves have a width of 5–20 μm, and (2) cerebellar slices absorb UV light with an extinction coefficient of 10–12 cm−1 (Khodakhah and Ogden, 1995). Given the geometry of the cerebellar cortex, photoreleasing glutamate in a column (z-axis) activates granule cells of comparable nature (ascending vs PF) provided that the plane of the dendrites is not far from perpendicular with respect to the surface of the slice. The scrutiny of our experimental data indicates that the maximum deviation of the dendritic plane was <8°, and thus each photolysis column activated granule cells of comparable nature (supplemental material 2, available at www.jneurosci.org).
The photolysis spot was randomly positioned within a 520 × 360 μm area of the granule cell layer beneath the target cell and a 1 ms pulse of light used to activate the targeted patch of granule cells while the activity of a Purkinje cell was monitored extracellularly (Fig. 1D). The same amount of glutamate was photoreleased at all locations, thus on average activating the same number of granule cells (see supplemental material 3, available at www.jneurosci.org). The response of the Purkinje cell was quantified by measuring its poststimulus maximum instantaneous firing rate, which within the range of firing rates examined is linearly and directly proportional to granule cell peak EPSC amplitudes (Walter and Khodakhah, 2006). This measure is a good indicator of the strength of granule cell synaptic input because it is also similarly correlated with the number of spikes fired after stimulus and also the average poststimulus firing rate (Walter and Khodakhah, 2006).
Figure 1E illustrates the results from a representative experiment. In contrast to the observation that only Purkinje cells overlying activated granule cell regions are excited in vivo, as shown patches of granule cells spanning the entire 520 μm width of the granule cell layer were capable of driving the firing of the target Purkinje cell. Furthermore, in each of the 11 mapping experiments, the patches with the greatest efficacy were often dispersed throughout the mapped region and sometimes did not even include the patches immediately below or surrounding the Purkinje cell soma (Fig. 1E). In the example shown, patches of granule cells that drove the firing rate to ≥200 spikes/s span ∼280 μm in the lateral direction (Fig. 1E). The results qualitatively show that patches of granule cells positioned to make only parallel fiber inputs with the target Purkinje cell were capable of driving its firing to similar levels as patches positioned to make ascending inputs. Similar results were obtained when these experiments were performed on Purkinje cells located several cell diameters below the surface of the slice or on Purkinje cells whose dendrites were angled down into slices cut 20° to the coronal plane (Isope and Barbour, 2002).
We quantitatively compared the average efficacy of patches of granule cells as a function of their position from the soma of the target Purkinje cell (Fig. 1E, bottom). On the basis of the known anatomy, patches located beneath the soma of the target Purkinje cell contain granule cells making ascending inputs and laterally adjacent patches contain granule cells making parallel fiber inputs. As can be seen in this example, while the patches immediately below the soma of the Purkinje cell were most powerful, they were only 1.25-fold more powerful than the immediately adjoining patches. The efficacy of the adjoining patches was comparable to that obtained for the patch immediately below the soma in all 11 maps examined. To provide an average we combined data from eight similarly oriented maps. In these maps, the Purkinje cell layer was a relatively flat horizontal line, and the target Purkinje cell was located (and similarly oriented) on the same coordinate to allow averaging (Fig. 1F). Patches immediately below the soma of the target Purkinje cell were on average only 1.08-fold more efficacious in driving Purkinje cell firing than adjoining patches (p = 0.3).
As an additional assay of the efficacy of ascending and adjoining patches, for each experiment based on the anatomy of the cerebellar cortex, two investigators independently determined the location of the “ascending” patch in the row closest to the Purkinje cell layer and compared its efficacy to that of adjoining patches. This row is least affected by any deviations in the angle of the Purkinje cell dendrite and thus is potentially the most sensitive indicator of any difference in strength of ascending and parallel fiber patches. As was the case for the previous analysis, on average the ascending patch was found to be no more than 1.2-fold stronger than the adjoining patches located on either side of the ascending patch (Fig. 1G) (p = 0.23) or the second adjacent pair located 80 μm away from the ascending patch (Fig. 1G) (p = 0.69).
We compared our experimentally obtained ratios of the efficacies of ascending/parallel fiber patches of granule cells with those predicted on the basis of suggested differences in the strength and connection probability of ascending inputs. Based on the data of Isope and Barbour, a 35 μm (the average extent of the mossy fiber terminal field) patch of granule cells positioned beneath the soma of a Purkinje cell is 3.2-fold more efficacious than equivalently sized adjoining patches making parallel fiber inputs (Isope and Barbour, 2002). The 3.2-fold higher efficacy (Fig. 1F,G, red line) was derived from two components. First, they estimated that a 35 μm patch of proximal granule cells has, on average, a 2.3-fold higher connection probability than adjoining patches that only formed parallel fibers with a Purkinje cell. Second, they suggested that ascending inputs have 1.4-fold higher EPSC amplitudes than parallel fiber inputs. If one revises their estimate to account for the recent suggestion that ascending inputs have 3.1- to 3.7-fold higher EPSC amplitudes (Sims and Hartell, 2005), then one expects that a 35 μm patch of granule cells located immediately underneath the soma of a Purkinje cell to be 7.1- to 8.5-fold (Fig. 1F,G, blue line) more effective at driving its firing than a comparable sized adjoining patch. The average 1.08-fold difference obtained experimentally from our maps is significantly less than those predicted above (3.2- to 8.5-fold). Thus, even taking into consideration our larger patch size (40 μm vs 35 μm), our data do not support either of these predictions.
There was a small but systematic decrease in the efficacy of laterally positioned patches of granule cells in the maps obtained from juvenile and adult cerebella. Compared with the most lateral patches examined (240 μm away from target Purkinje cell), patches of granule cells immediately below the soma of the target Purkinje cell were 1.5-fold more effective in driving Purkinje cell firing (1.00 ± 0.06 beneath the soma, 0.67 ± 0.06 240 μm lateral, p < 0.005) (Fig. 1F). Because of the comparable efficacy of ascending and adjoining parallel fiber patches in the same cell, this gradual reduction cannot be the consequence of differences in ascending and parallel fibers, but is likely to be accounted for by the systematic increase in intervaricosity distance that occurs along the length of parallel fibers (Pichitpornchai et al., 1994). The increase in intervaricosity distance as one moves farther away from the bifurcation point of a granule cell axon will impact the probability that a parallel fiber makes a synapse with a target Purkinje cell. The further along the parallel fiber beam a Purkinje cell is located from a granule cell, the lower the likelihood of parallel fiber synapse formation. Thus, in the absence of any specialized connectivity patterns, one would expect a small systematic reduction in the efficacy of patches of granule cells as one moves further along the parallel fiber beam.
Under our experimental conditions, and given the cerebellar lobules from which we recorded there was little chance that UBCs were activated (see Materials and Methods). However, in vivo when a mossy fiber is active, particularly in lobules I, IX, and X, it is likely that it also activates UBCs. The UBC, in turn, will activate granule cells positioned laterally to those directly activated by the mossy fiber. Speculatively, this will ensure that PF inputs to the Purkinje cell positioned directly above the activated patch are also activated; thus, in lobules where UBCs are in abundance, it may not even be possible to selectively activate ascending inputs.
EPSC maps confirm the comparable efficacy of adjoining granule cell patches forming ascending and parallel fiber inputs
By virtue of monitoring the firing of Purkinje cells, the experiments detailed above are comparable to those evaluating the efficacy of granule cell patches in driving the activity of Purkinje cells in the absence of inhibition in vivo (Santamaria et al., 2007). Most evidence in support of a difference in efficacy between ascending and parallel fiber inputs, however, has been obtained by examining their corresponding EPSCs (Barbour, 1993; Isope and Barbour, 2002; Sims and Hartell, 2005). To allow for a direct comparison with these studies, granule cell mediated EPSCs were monitored in voltage-clamped Purkinje cells using the mapping procedure described above. These experiments also allowed the visualization and recording of the dendritic trajectory by including Alexa Fluor 488 in the patch pipette. Moreover, to obtain higher resolution, the maps were generated with a 20 μm center-to-center distance between photolysis locations.
A representative experiment is shown in Figure 2. As observed when monitoring the firing rate of Purkinje cells, peak EPSC amplitudes evoked by patches of granule cells dispersed throughout the mapped region were comparable (Fig. 2). Moreover, there was no correlation between the location of the patch of granule cells activated with the resulting EPSC rise or decay times (Fig. 2). This result suggests that the average electrotonic length of the inputs activated by each patch of granule cells is comparable, presumably as a consequence of the fact that they were dispersed throughout the dendritic tree. Qualitatively similar results were obtained in all six experiments.
Figure 2.
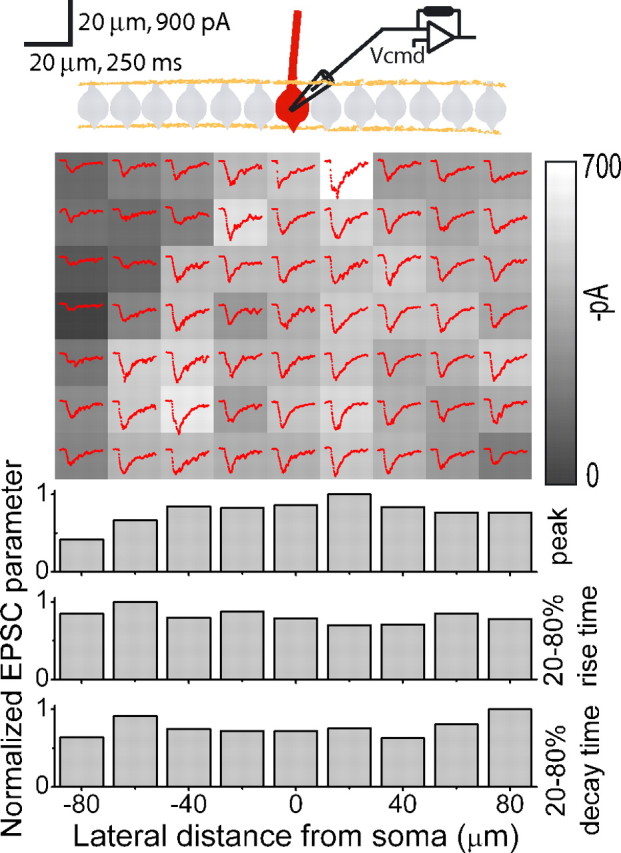
High-resolution EPSC maps in juvenile rats. Top, A sample experiment in which EPSCs were monitored in a whole-cell voltage-clamped Purkinje cell in response to glutamate photorelease as in Figure 1E. In these experiments the spot was moved in 20 μm increments to improve mapping resolution. Inclusion of 100 μm Alexa Fluor 488 in the patch-pipette solution allowed determination of the exact orientation of the dendritic plane of the voltage-clamped Purkinje cells (red). The grayscale patches show the average magnitude of peak EPSC amplitudes resulting from glutamate photolysis at each location. The average of three EPSCs (red traces) is also shown for each position. Bottom, EPSC peak amplitudes, 20–80% rise times, and 20–80% decay times from every position in a column were averaged and normalized to the largest column value.
The orientation of the Purkinje cell layer and the dendritic trajectory in all six experiments were alike and were thus averaged (Fig. 3A). On average, patches of granule cells located within or in the immediate vicinity of the dendritic plane of the target Purkinje cell evoke EPSC amplitudes no more than 1.22-fold larger than those resulting from activation of patches located 40 μm lateral to the ascending patch (Fig. 3C). Compared to the ascending patch, the differences in the average strength of the directly adjoining pair of patches (20 μm away) were not statistically significant (p = 0.5 and 0.2 for each side). The patch 40 μm to the right of the ascending patch was also not statistically different (p = 0.06), and the one 40 μm to the left was (p < 0.005). Similar results were obtained when the maps were analyzed row by row instead of collapsing columns (Fig. 3B), and as was done for extracellular maps when the efficacy of the ascending patch located in the row closest to the Purkinje cell soma (row least affected by any deviations in the angle of the Purkinje cell dendrite) was compared with its adjoining patches (Fig. 3D) (p = 0.6 and 0.9 for the first and second patches, respectively) (supplemental material 2, available at www.jneurosci.org). Thus, the results obtained from the EPSC maps are comparable to those obtained when monitoring the activity of Purkinje cells extracellularly in that neither supports the notion that patches of granule cells containing ascending inputs are functionally distinct from those forming parallel fiber inputs.
Figure 3.
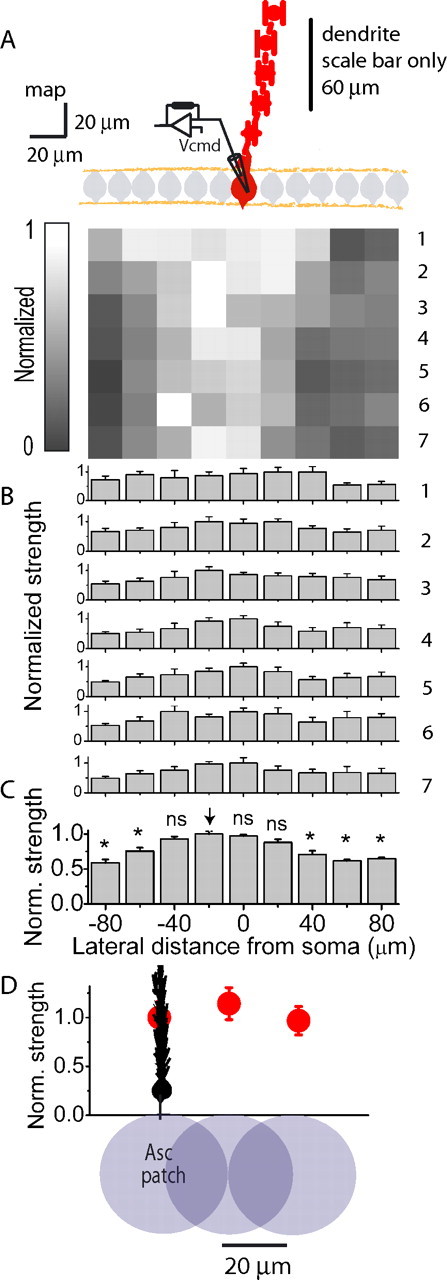
High-resolution mapping confirms the relative homogeneity of the granule cell population. A, The average normalized EPSC map and dendritic orientation (red) obtained from six Purkinje cells from experiments similar to that presented in Figure 2. B, A row-by-row analysis of the average normalized EPSC map shown in A. Each row was normalized to the largest value in that row. C, A column-by-column analysis of the average normalized EPSC map shown in A. Shown is the normalized average of the seven rows shown in A. * denotes statistical significance with respect to the column denoted by the arrow at p < 0.005. D, For each of the EPSC mapping experiments averaged in A above, two investigators independently determined the location of the “ascending” patch in the row closest to the Purkinje cell layer. The average peak EPSC amplitude of the position that corresponded to the location where granule cells form ascending synapses (Asc patch) was taken as one. The relative peak EPSC amplitudes of the adjoining patches located on either side of the ascending patch and the second adjacent pair located 40 μm away from the ascending patch were pooled and averaged. Data are presented as mean ± SEM.
Adult maps also display patch homogeneity
It is important to ascertain that the results obtained from juvenile (12–19 d old) cerebella are applicable to the mature brain. We thus generated extracellular and whole-cell voltage-clamp maps in slices from adult rats (2–3 months old).
Peak EPSC amplitude maps in adult cerebella were also similar to those obtained in juvenile animals (Fig. 4A–C). The average dendritic fields and EPSC maps obtained from five Purkinje cells in adult cerebella are shown in Figure 4B. Consistent with that obtained from peak EPSC maps in juveniles (Fig. 3C), patches of granule cells located within or in the immediate vicinity of the dendritic plane of the target Purkinje cell evoke EPSC amplitudes ∼1.25-fold larger than those resulting from activation of patches located 40 μm laterally (Fig. 4B), although this difference was not statistically significant (p = 0.5 and 0.9 on each side). Furthermore, when two investigators independently identified the ascending patch and compared its efficacy to that of its adjoining patch as was done for data reported in Figures 1G and 3D, the efficacy of the ascending patch was 1.2-fold greater (Fig. 4C) (p = 0.68). Similar data were obtained in mapping experiments where the activity of the Purkinje cell was monitored extracellularly.
Figure 4.
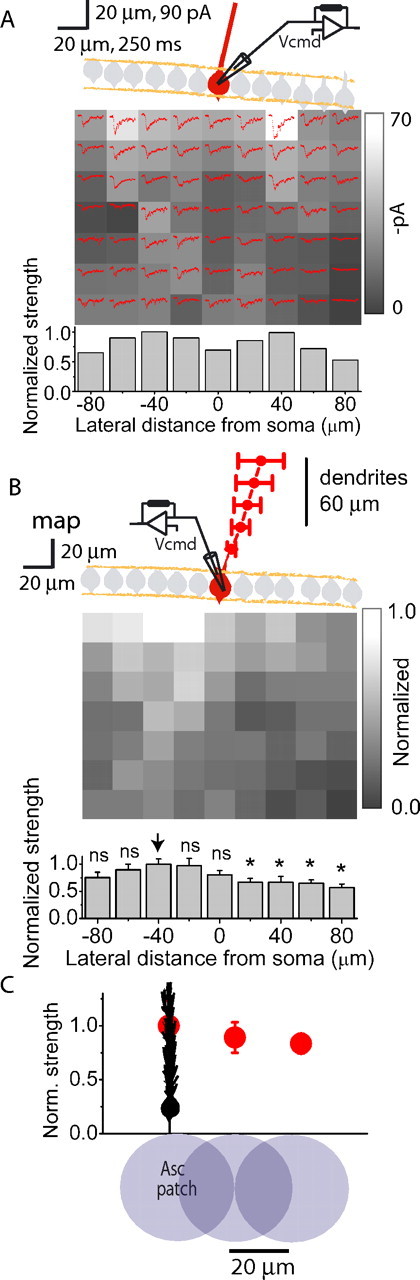
Adult maps also do not show powerful ascending granule cell patches. A, A single EPSC mapping experiment as shown in Figure 2 except in a slice obtained from an adult rat (2–3 months old). The dendritic plane of the voltage-clamped Purkinje cell is shown in red. The grayscale map shows the average magnitude of peak EPSC amplitudes resulting from glutamate photolysis at each location. Average of three EPSCs (red traces) is also shown for each position. Bottom, Peak EPSC amplitudes from every position in a column were averaged and normalized to the largest column value. B, Top, Average normalized EPSC map and dendritic orientation (red) obtained from five Purkinje cells in slices from adult rats. Bottom, A column-by-column analysis of the average normalized EPSC map shown above. Peak EPSC amplitudes from every position in a column were averaged and normalized to the largest column value. * denotes statistical significance with respect to the column denoted by the arrow at p < 0.05. C, Same as Figure 3D except from experiments performed in slices obtained from adult rats.
Granule cells that form parallel fibers can effectively increase the activity of Purkinje cells in vivo
Overall the data presented so far are inconsistent with the prediction that proximally located granule cell patches are severalfold more potent than laterally located ones. It has recently been shown that with fast inhibition blocked in vivo a patch of granule cells activated by a peripheral tactile stimulus can drive the firing of a laterally located Purkinje cell (Santamaria et al., 2007). Thus our data are consistent with the notion that the restricted activation of Purkinje cells observed in vivo is the consequence of feedforward inhibition and not due to the inherent inability of parallel fibers to drive Purkinje cell firing (Santamaria et al., 2007).
To complement our in vitro data, we directly examined whether patches of granule cells forming parallel fiber inputs can drive the activity of a Purkinje cell in vivo. We recorded from a Purkinje cell in an anesthetized mouse and electrically stimulated laterally located patches of granule cells 300 and 600 μm along the parallel fiber beam (Fig. 5A). With the topical application of 50 μm gabazine (SR95531) to block fast inhibitory synaptic transmission, activation of granule cells using a train of three stimuli at 100 Hz increased the firing of Purkinje cells to as high as ∼250 spikes/s (Fig. 5C,D). In all seven cells examined, using comparable stimulation intensities, activation of patches of granule cells located 300 or 600 μm lateral to the target Purkinje cell could markedly increase its firing rate. While we cannot rule out that in these experiments Purkinje cells were activated polysynaptically, both our in vitro and in vivo results are nonetheless consistent with the idea that in the absence of inhibition, granule cells forming ascending and parallel fiber inputs are comparable in their ability to drive Purkinje cell firing.
Figure 5.
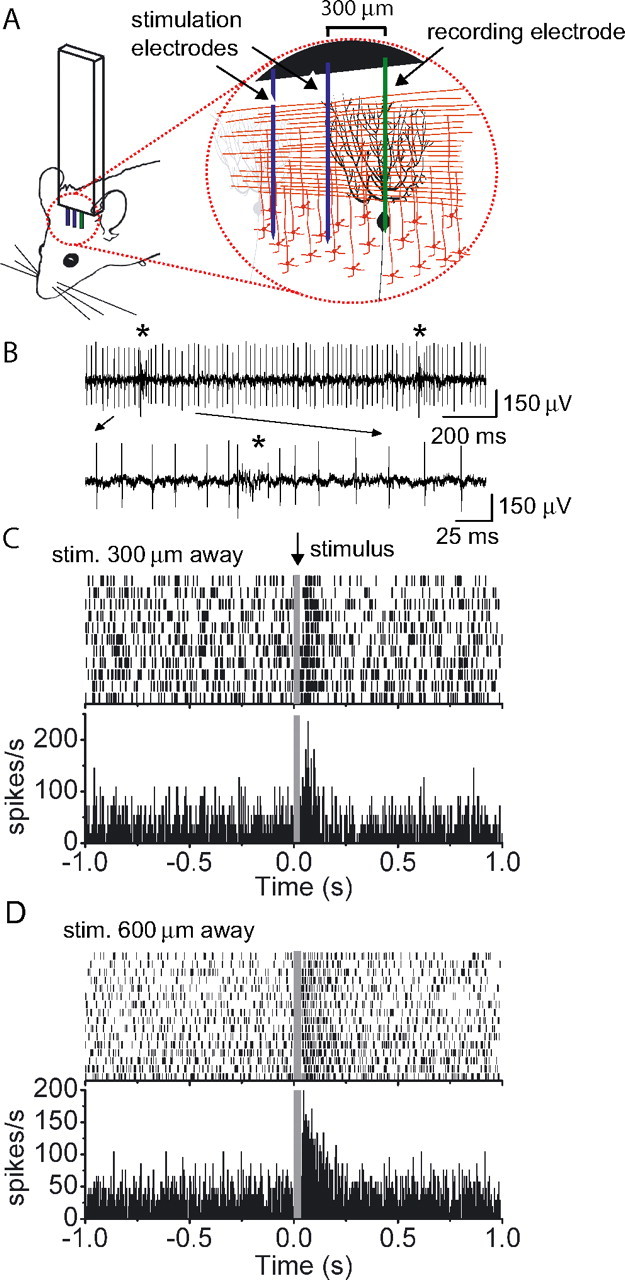
The activity of Purkinje cells in vivo can be driven by granule cells which only form parallel fibers. A, Extracellular recordings were made from Purkinje cells in vivo, and patches of granule cells located 300 or 600 μm away along the parallel fiber beam were electrically stimulated using a train of three pulses at 100 Hz. B, Raw data from a representative experiment illustrating the occurrence of complex spikes (asterisk) during recording from a Purkinje cell. The pause in simple spike firing following the complex spike as denoted by asterisks in the raw data trace is shown with an expanded time scale. C, Raster plot and the corresponding poststimulus time histogram (5 ms bins) showing the response of a Purkinje cell to the repeated activation of a patch of granule cells located 300 μm away along the parallel fiber beam. D, Same as C except granule cells located 600 μm away were activated.
Ascending and parallel fiber input EPSC amplitudes are comparable
The relative functional homogeneity of patches of granule cell inputs to a Purkinje cell shown above is at odds with the suggestion that EPSCs mediated by ascending inputs are significantly larger than those mediated by parallel fiber inputs. A common feature of studies reporting the presence of large ascending EPSC amplitudes is that granule cells were activated by electrical stimulation (Barbour, 1993; Isope and Barbour, 2002; Sims and Hartell, 2005). A challenge inherently associated with the electrical activation of granule cells even with loose-patch recordings is avoiding stimulation of other nearby axons (Barbour and Isope, 2000) such as mossy fibers or weakened climbing fibers undergoing pruning. Incidental activation of either of these fibers could be mistakenly interpreted as powerful ascending inputs. We thus estimated the apparent unitary ascending and parallel fiber EPSC amplitude by activating granule cells with glutamate photolysis to avoid this caveat.
A Purkinje cell was voltage clamped with a cesium-filled patch pipette and the amplitudes of granule cell evoked EPSCs were measured. The power of the laser was reduced and the intensity of the photolysis pulse adjusted to release low concentrations of glutamate such that few granule cells were brought to threshold, and thus both failures and small amplitude responses were obtained. For each experiment, a peak EPSC amplitude histogram was constructed and fit with a sum-of-Gaussians function to obtain the average size of the apparent unitary granule cell EPSC. This procedure is similar to, but distinct from, quantal analysis because the difference in the peaks provides the average size of the apparent unitary granule cell EPSC rather than the classical quantal size (Walter and Khodakhah, 2006).
To compare the average size of apparent unitary ascending and parallel fiber inputs, the photolysis location was chosen to activate granule cells that only make parallel fiber inputs (>100 μm lateral to the dendritic plane) or to activate granule cells that make ascending inputs (within the visualized dendritic plane) (Fig. 6A). Responses to >200 stimulations at the same intensity were recorded and used to generate amplitude histograms (Fig. 6B,C). For each experiment, a baseline noise histogram was also constructed (Fig. 6B,C) and its SD was used as a constraint when fitting amplitude histograms with sum-of-Gaussians functions (see Materials and Methods for details).
Figure 6.
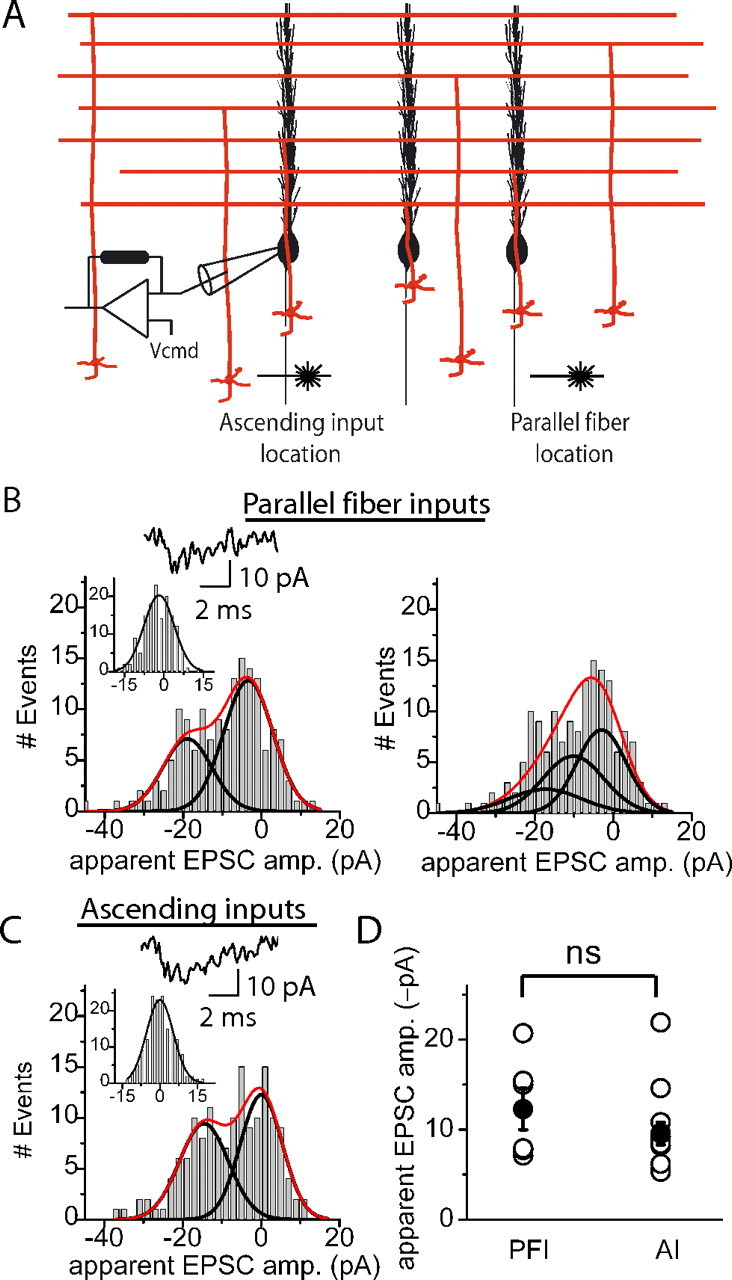
Apparent unitary EPSC amplitudes of parallel fiber and ascending inputs obtained with photolytic activation of granule cells are indistinguishable. A, Glutamate was photoreleased in the granule cell layer within the dendritic plane of the target Purkinje cell to activate ascending inputs and in the granule cell layer at least 100 μm lateral to the dendritic plane to activate parallel fiber inputs. B, Left, The top trace shows the response of a Purkinje cell to photolysis of glutamate onto granule cells which formed parallel fiber synapses. The absolute apparent unitary EPSC amplitude obtained from the sum-of-Gaussians fit to the amplitude histogram (R2 = 0.91, p = 0.9) was 15.5 pA. The inset shows the Gaussian fit to the baseline noise histogram. Right, The amplitude distribution shown in B was force fit using the sum of three Gaussians (1 for failures and 2 for responses, right panel) resulting in an absolute apparent unitary EPSC amplitude of 7.7 pA. When fitting the distribution using the sum of three Gaussians, R2 = 0.86 and p = 0.2. This suggests that 15.5 pA, and not 7.7 pA, is the amplitude that represents the apparent unitary response. C, As in B except the photolysis spot was positioned to activate granule cells giving rise to ascending inputs. The absolute apparent unitary EPSC amplitude obtained from the sum-of-Gaussians fit (R2 = 0.87,p = 0.9) to the amplitude histogram was 14.6 pA. D, Scatter plot of individual (open) and mean (filled) absolute apparent unitary granule cell EPSC amplitudes obtained with photolytic stimulation of the granule cell layer. The average absolute apparent unitary EPSC amplitude obtained with photolytic activation of granule cells giving rise to parallel fiber inputs (PFI) was 12.3 ± 2.3 pA (n = 6) and that giving rise to ascending inputs (AI) was 9.6 ± 1.2 pA (n = 13).
An experiment in which granule cells forming parallel fiber inputs were activated is shown in Figure 6B. Two populations of responses are evident from inspection of the amplitude histogram; one centered around −3.2 pA and a second around −18.7 pA (Fig. 6B). The distribution centered around −3.2 pA likely represents failures because it was fit well using a Gaussian function with the SD of the baseline noise histogram (Fig. 6B, inset). The entire distribution was fit with a sum-of-two-Gaussians function which yielded an R2 of 0.91 and an absolute peak-to-peak distance of 15.5 pA. This experiment was repeated in five other cells, and histograms were fit as delineated above. The goodness of fit (R2) was similar in all six cells (0.87 ± 0.04). These fits yielded amplitudes with a range of 7.1–20.7 pA and an average absolute apparent unitary EPSC amplitude of 12.3 ± 2.3 pA (Fig. 6D). In four of the six experiments, the amplitude histograms were fit with a sum of two Gaussians (one representing failures and one responses). The other two histograms were best fit with a sum-of-three-Gaussians function.
It is possible that the responses obtained were made of smaller apparent unitary events which were undetected because of the overlap of populations. However, we found that force-fitting the histograms with smaller apparent unitary amplitudes yielded poorer fits (Fig. 6B; for details, see supplemental material 4, available at www.jneurosci.org).
To obtain the ascending apparent unitary EPSC amplitude, the photolysis spot was placed in the granule cell layer within the visualized dendritic plane of the target Purkinje cell (Isope and Barbour, 2002; Sims and Hartell, 2005). For the experiment shown in Figure 6C, the entire amplitude distribution was fit well with a sum-of-two-Gaussians function (R2 = 0.87), yielding an average absolute apparent unitary EPSC amplitude of 14.6 pA. The R2 values were similar in the 13 cells examined (average 0.93 ± 0.02). In 10 of the 13 experiments, the amplitude histograms were fit with a sum-of-two-Gaussians function. The other three histograms were fit with a sum-of-three-Gaussians function. Similar to that found for the parallel fiber experiments, scrutiny of alternative force-fits suggests that 9.6 ± 1.2 pA indeed represents the average absolute apparent unitary ascending input EPSC amplitude (see supplemental material 4, available at www.jneurosci.org).
As shown in Figure 6D, there were no differences found between ascending and parallel fiber apparent unitary EPSC amplitudes obtained with photolysis. There was no correlation between the amplitudes of ascending or parallel fiber apparent unitary EPSCs and their rise times, suggesting that both sampled populations of inputs had comparable electrotonic lengths (rise time for ascending 0.82 ± 0.07 ms and for parallel fiber, 0.82 ± 0.06 ms, p = 0.99). Thus, the apparent unitary amplitude reported here can be used to compare the strength of the two inputs because the extent of filtering was comparable for both input types. The distribution of the individual ascending input amplitudes obtained from each cell (range 5.3–21.9 pA) and its average, 9.6 ± 1.2 pA with SD = 4.5 pA, was statistically indistinguishable (p = 0.3) from that obtained for parallel fiber inputs, 12.3 ± 2.3 pA with SD = 5.6 pA (range 7.1–20.7 pA) (Fig. 6D).
Averaging across both populations resulted in an absolute apparent unitary EPSC amplitude of 10.4 ± 1.1 pA with an SD = 4.9 pA. Consistent with the conclusion that the EPSC amplitudes represent apparent unitary amplitudes, the coefficient of variation of the EPSC amplitudes (0.47) is comparable to the coefficient of variation of the area of postsynaptic densities of the synapses formed by granule cells to Purkinje cells (0.3–0.5) obtained from electron microscopic evaluation (Harris and Stevens, 1988; Gundappa-Sulur et al., 1999; Xu-Friedman et al., 2001).
As described in detail above, our data thus far suggest that ascending and parallel fiber inputs have comparable apparent unitary EPSC amplitudes. However, despite this similarity, whether these inputs have similar strengths is also dependent on a number of additional factors, including the number of individual synapses that a single granule cell makes with each Purkinje cell (see supplemental material 5, available at www.jneurosci.org). Estimates of the number of synapses made with an individual Purkinje cell were obtained from evaluating the number of Gaussians fit to experimentally determined EPSC amplitude histograms for ascending and parallel fiber inputs. For parallel fiber and ascending inputs, the majority of experimentally obtained amplitude histograms (4 of 6 and 10 of 13) were fit with a sum-of-two-Gaussians function (one for responses and one for failures). Given these results, we estimate that on average parallel fiber and ascending inputs make ∼1.3 and 1.2 synapses with an individual Purkinje cell (see supplemental material 5, available at www.jneurosci.org). Thus, our data suggest that ascending and parallel fiber inputs have comparable strengths because they have similar apparent unitary EPSC amplitudes and make on average the same number of synapses with an individual Purkinje cell.
Discussion
Of fundamental importance to theories of cerebellar function, and a topic of much debate, is whether ascending and parallel fiber inputs perform different functions within the circuitry of the cerebellar cortex. Isope and Barbour (2002) suggested that powerful ascending connections are rare, but they nonetheless constitute privileged inputs because they have much higher connection probabilities. Sims and Hartell (2005) subsequently reported that powerful ascending inputs were far more prevalent than suggested by Isope and Barbour (2002), and that they released transmitter with higher mean release probabilities and mean quantal amplitudes than parallel fiber synapses. Thus, while traditional theories of cerebellar function assumed all inputs were comparable, recently it was suggested that “ascending axon synapses should be considered as an entirely separate element of cortical signal processing to parallel fiber synapses” (Sims and Hartell, 2005). However, our direct examination of the efficacy of patches of granule cells in driving Purkinje cell firing unambiguously revealed a relatively homogenous population; patches of granule cells positioned to make ascending inputs were as efficacious in driving Purkinje cell firing as adjoining patches positioned to make only parallel fiber inputs. Consistent with this observation, in vivo the firing of Purkinje cells could be driven to high rates by the activation of patches of granule cells forming parallel fiber inputs. Combined with the finding that ascending and parallel fiber inputs have comparable strengths, our results are not consistent with the suggestion that ascending and parallel fiber synapses constitute separate elements of signal processing, but support traditional theories of cerebellar function.
Ascending and parallel fiber input strengths are comparable
To delineate the basis for the comparable efficacies of patches of granule cells containing ascending inputs and those containing only parallel fibers, we reexamined ascending and parallel fiber apparent unitary EPSC amplitudes. We activated granule cells with glutamate photolysis, an approach which avoids the incidental activation of climbing or mossy fibers. In addition to the results of mapping experiments, this analysis also led us to conclude that the ascending and parallel fiber inputs had comparable strengths. This conclusion is based on the finding that they have equal apparent unitary EPSC amplitudes and make on average the same number of synapses with an individual Purkinje cell.
The value reported here for the average amplitude of the granule cell synaptic input is comparable to those obtained by Barbour (1993) and Isope and Barbour (2002), although a detailed comparison is made difficult by the fact that their reported amplitudes contained failures. Our results are in contrast to the estimates reported in a recent study which used variance–mean analysis to determine the quantal amplitude and the number of release sites at parallel fiber and ascending synapses (Sims and Hartell, 2005). On the basis of this analysis the authors concluded that individual parallel fiber inputs contained six to seven release sites. Given that parallel fibers make one and rarely two synaptic contacts, they proposed that all of these release sites are present at a single parallel fiber synapse (Sims and Hartell, 2005). In contrast to this suggestion, anatomical examination shows that 90% of parallel fiber synapses contain only a single release site (Xu-Friedman et al., 2001). To account for their data, Sims and Hartell (2005) also had to assume that simultaneous multivesicular release at this synapse results in EPSC amplitudes that increase in proportion to the number of vesicles released. These conclusions are at odds with the finding that because of receptor saturation, multivesicular release only marginally, and not linearly, increases the EPSC amplitude at the parallel fiber synapse (Foster et al., 2005). Thus, although variance–mean analysis in principle provides additional information, the estimates obtained in this study are inconsistent. This inconsistency might be the consequence of the fact that variance–mean analysis is based on the assumption that all of the variance in EPSC amplitude is the consequence of the variability in the number of quanta released from an activated synapse (Korn et al., 1991; Clements and Silver, 2000). However, the EPSCs used for variance–mean analysis described above were obtained from experiments in which tens of axons were activated by extracellular electrical stimulation. Even if on average the same number of axons were activated from trial to trial, it is difficult to be sure that the same axons were stimulated each time. In fact, it is also quite likely that different numbers of axons were activated with each stimulation. Thus one might expect that considerable variability in the EPSC amplitude could be attributed to the fact that different numbers and/or different fibers may have been activated from trial to trial. The same complications are also associated with the estimates similarly obtained for ascending synapses, which compelled them to conclude that ascending inputs contain >10 release sites (Sims and Hartell, 2005). Not only is this suggestion incompatible with the known anatomy, but it also necessitates a failure rate of <0.003 (see supplemental material 6, available at www.jneurosci.org), which is even far below the 0.1 failure rate reported by Isope and Barbour (2002).
Parallel fiber and ascending input EPSC amplitudes and information processing
Parallel fiber and ascending inputs have received much attention because of the consequences that their relative weights may have for information processing by the circuitry of the cerebellar cortex (Llinas, 1982; Barbour, 1993; Isope and Barbour, 2002; Santamaria et al., 2002; Santamaria and Bower, 2005; Sims and Hartell, 2005, 2006; Marcaggi and Attwell, 2007; Lu et al., 2009). If the weight of an ascending input is severalfold larger than that of a parallel fiber input, then the ascending input could play a differential role in relaying information to Purkinje cells. Interestingly, ascending and parallel fiber synapses are largely segregated across the Purkinje cell dendritic tree with ascending synapses contacting only small diameter dendrites (Lu et al., 2009). Despite this anatomical segregation, our findings that ascending and parallel fiber inputs have comparable somatic EPSC amplitudes and rise times suggest that, in the absence of inhibition, these two inputs can be used interchangeably to drive the activity of a Purkinje cell.
In addition to differences in synaptic strength, it has also been suggested that ascending and parallel fiber inputs differ in their ability to undergo plasticity (Sims and Hartell, 2005, 2006). This issue is currently under debate because comparable experiments suggest that both ascending and parallel fibers are equally modifiable (Marcaggi and Attwell, 2007). Instead of differences in ascending or parallel fiber properties, the latter studies suggest that the pronounced parallel fiber plasticity is because glutamate spillover is much greater when parallel fibers are activated as a beam (Marcaggi and Attwell, 2007). While our data do not address this issue directly, our finding that ascending and parallel fiber inputs have comparable strengths is more in line with the latter proposal.
Beam versus patchy Purkinje cell activation pattern
At the center of classic theories of cerebellar function is the beam hypothesis, which suggests that activation of granule cells by mossy fibers drives the activity of Purkinje cells along the beam of parallel fibers (Eccles et al., 1967; Marr, 1969; Albus, 1971; Eccles, 1973; Ito, 1984). However, many in vivo experiments have failed to show a row of activated Purkinje cells with physiological stimulation paradigms (Bell and Grimm, 1969; Eccles et al., 1972; Bower and Woolston, 1983). Instead, what is found is that in vivo Purkinje cells are driven mainly by underlying patches of granule cells (Shambes et al., 1978; Bower and Woolston, 1983; Bower and Kassel, 1990). It was originally proposed that this activation pattern of Purkinje cells was the consequence of powerful ascending inputs formed by the underlying granule cells (Llinas, 1982). However, the same pattern of Purkinje cell activation could be obtained if feedforward inhibition prevented the propagation of excitatory drive along the beam of parallel fibers. Our findings that the strengths of parallel fiber and ascending inputs made onto Purkinje cells are comparable, and that in the absence of inhibition in vivo parallel fibers can drive the activity of Purkinje cells, refute the former and supports the latter hypothesis. Moreover, beams of driven Purkinje cells can be seen following sensory stimulation in vivo when inhibition is blocked; a patch of granule cells activated by the same peripheral tactile stimulus can drive the firing of an overlying Purkinje cell and a Purkinje cell located ∼760 μm away to similar rates (Santamaria et al., 2007). Despite the systematic decrease in the connection probability of granule cells with Purkinje cells as a function of distance discussed above, this study thus suggests that ascending and parallel fiber inputs can be used interchangeably to linearly drive the activity of a Purkinje cell. Furthermore, as suggested (Santamaria et al., 2007), differential activation of feedforward inhibition by these two input pathways to a given Purkinje cell appears to allow for an additional layer of information processing by the cerebellar cortex.
Footnotes
We thank Dr. Adam Kohn for help with in vivo recordings.
References
- Albus JS. A theory of cerebellar function. Math Biosci. 1971;10:25–61. [Google Scholar]
- Barbour B. Synaptic currents evoked in Purkinje cells by stimulating individual granule cells. Neuron. 1993;11:759–769. doi: 10.1016/0896-6273(93)90085-6. [DOI] [PubMed] [Google Scholar]
- Barbour B, Isope P. Combining loose cell-attached stimulation and recording. J Neurosci Methods. 2000;103:199–208. doi: 10.1016/s0165-0270(00)00318-6. [DOI] [PubMed] [Google Scholar]
- Bell CC, Grimm RJ. Discharge properties of Purkinje cells recorded on single and double microelectrodes. J Neurophysiol. 1969;32:1044–1055. doi: 10.1152/jn.1969.32.6.1044. [DOI] [PubMed] [Google Scholar]
- Bower JM, Kassel J. Variability in tactile projection patterns to cerebellar folia crus IIA of the Norway rat. J Comp Neurol. 1990;302:768–778. doi: 10.1002/cne.903020409. [DOI] [PubMed] [Google Scholar]
- Bower JM, Woolston DC. Congruence of spatial organization of tactile projections to granule cell and Purkinje cell layers of cerebellar hemispheres of the albino rat: vertical organization of cerebellar cortex. J Neurophysiol. 1983;49:745–766. doi: 10.1152/jn.1983.49.3.745. [DOI] [PubMed] [Google Scholar]
- Braitenberg V, Atwood RP. Morphological observations on the cerebellar cortex. J Comp Neurol. 1958;109:1–33. doi: 10.1002/cne.901090102. [DOI] [PubMed] [Google Scholar]
- Canepari M, Nelson L, Papageorgiou G, Corrie JE, Ogden D. Photochemical and pharmacological evaluation of 7-nitroindolinyl-and 4-methoxy-7-nitroindolinyl-amino acids as novel, fast caged neurotransmitters. J Neurosci Methods. 2001;112:29–42. doi: 10.1016/s0165-0270(01)00451-4. [DOI] [PubMed] [Google Scholar]
- Chadderton P, Margrie TW, Häusser M. Integration of quanta in cerebellar granule cells during sensory processing. Nature. 2004;428:856–860. doi: 10.1038/nature02442. [DOI] [PubMed] [Google Scholar]
- Clements JD, Silver RA. Unveiling synaptic plasticity: a new graphical and analytical approach. Trends Neurosci. 2000;23:105–113. doi: 10.1016/s0166-2236(99)01520-9. [DOI] [PubMed] [Google Scholar]
- Diño MR, Mugnaini E. Distribution and phenotypes of unipolar brush cells in relation to the granule cell system of the rat cochlear nucleus. Neuroscience. 2008;154:29–50. doi: 10.1016/j.neuroscience.2008.01.035. [DOI] [PMC free article] [PubMed] [Google Scholar]
- Eccles JC. The cerebellum as a computer: patterns in space and time. J Physiol. 1973;229:1–32. doi: 10.1113/jphysiol.1973.sp010123. [DOI] [PMC free article] [PubMed] [Google Scholar]
- Eccles JC, Ito M, Szenthagothai J. The cerebellum as a neuronal machine. Heidelberg: Springer; 1967. [Google Scholar]
- Eccles JC, Sabah NH, Schmidt RF, Táboríková H. Integration by Purkyne cells of mossy and climbing fiber inputs from cutaneous mechanoreceptors. Exp Brain Res. 1972;15:498–520. doi: 10.1007/BF00236405. [DOI] [PubMed] [Google Scholar]
- Foster KA, Crowley JJ, Regehr WG. The influence of multivesicular release and postsynaptic receptor saturation on transmission at granule cell to Purkinje cell synapses. J Neurosci. 2005;25:11655–11665. doi: 10.1523/JNEUROSCI.4029-05.2005. [DOI] [PMC free article] [PubMed] [Google Scholar]
- Gundappa-Sulur G, De Schutter E, Bower JM. Ascending granule cell axon: an important component of cerebellar cortical circuitry. J Comp Neurol. 1999;408:580–596. doi: 10.1002/(sici)1096-9861(19990614)408:4<580::aid-cne11>3.0.co;2-o. [DOI] [PubMed] [Google Scholar]
- Harris KM, Stevens JK. Dendritic spines of rat cerebellar Purkinje cells: serial electron microscopy with reference to their biophysical characteristics. J Neurosci. 1988;8:4455–4469. doi: 10.1523/JNEUROSCI.08-12-04455.1988. [DOI] [PMC free article] [PubMed] [Google Scholar]
- Harvey RJ, Napper RM. Quantitative studies on the mammalian cerebellum. Prog Neurobiol. 1991;36:437–463. doi: 10.1016/0301-0082(91)90012-p. [DOI] [PubMed] [Google Scholar]
- Isope P, Barbour B. Properties of unitary granule cell→Purkinje cell synapses in adult rat cerebellar slices. J Neurosci. 2002;22:9668–9678. doi: 10.1523/JNEUROSCI.22-22-09668.2002. [DOI] [PMC free article] [PubMed] [Google Scholar]
- Ito M. The cerebellum and neural control. New York: Raven; 1984. [Google Scholar]
- Jaeger D, Bower JM. Prolonged responses in rat cerebellar Purkinje cells following activation of the granule cell layer: an intracellular in vitro and in vivo investigation. Exp Brain Res. 1994;100:200–214. doi: 10.1007/BF00227191. [DOI] [PubMed] [Google Scholar]
- Jörntell H, Ekerot CF. Properties of somatosensory synaptic integration in cerebellar granule cells in vivo. J Neurosci. 2006;26:11786–11797. doi: 10.1523/JNEUROSCI.2939-06.2006. [DOI] [PMC free article] [PubMed] [Google Scholar]
- Khodakhah K, Ogden D. Fast activation and inactivation of inositol trisphosphate-evoked Ca2+ release in rat cerebellar Purkinje neurones. J Physiol. 1995;487:343–358. doi: 10.1113/jphysiol.1995.sp020884. [DOI] [PMC free article] [PubMed] [Google Scholar]
- Korn H, Fassnacht C, Faber DS. Is maintenance of LTP presynaptic? Nature. 1991;350:282. doi: 10.1038/350282a0. [DOI] [PubMed] [Google Scholar]
- Llinas R. General discussion: radial connectivity in the cerebellar cortex. A novel view regarding the functional organization of the molecular layer. In: Palay SL, Chan-Palay V, editors. The cerebellum: new vistas. Berlin: Springer; 1982. pp. 189–194. [Google Scholar]
- Lu H, Esquivel AV, Bower JM. 3D electron microscopic reconstruction of segments of rat cerebellar Purkinje cell dendrites receiving ascending and parallel fiber granule cell synaptic inputs. J Comp Neurol. 2009;514:583–594. doi: 10.1002/cne.22041. [DOI] [PubMed] [Google Scholar]
- Marcaggi P, Attwell D. Short- and long-term depression of rat cerebellar parallel fibre synaptic transmission mediated by synaptic crosstalk. J Physiol. 2007;578:545–550. doi: 10.1113/jphysiol.2006.115014. [DOI] [PMC free article] [PubMed] [Google Scholar]
- Marr D. A theory of cerebellar cortex. J Physiol. 1969;202:437–470. doi: 10.1113/jphysiol.1969.sp008820. [DOI] [PMC free article] [PubMed] [Google Scholar]
- Mugnaini E. The histology and cytology of the cerebellar cortex. In: Larsell O, Jansen J, editors. The comparative anatomy and histology of the human cerebellum: the human cerebellum, cerebellar connections, and cerebellar cortex. Minneapolis: University of Minnesota; 1972. pp. 201–262. [Google Scholar]
- Napper RM, Harvey RJ. Number of parallel fiber synapses on an individual Purkinje cell in the cerebellum of the rat. J Comp Neurol. 1988;274:168–177. doi: 10.1002/cne.902740204. [DOI] [PubMed] [Google Scholar]
- Nunzi MG, Shigemoto R, Mugnaini E. Differential expression of calretinin and metabotropic glutamate receptor mGluR1alpha defines subsets of unipolar brush cells in mouse cerebellum. J Comp Neurol. 2002;451:189–199. doi: 10.1002/cne.10344. [DOI] [PubMed] [Google Scholar]
- Palay SL, Chan-Palay V. Cerebellar cortex. Berlin: Springer; 1974. [Google Scholar]
- Pichitpornchai C, Rawson JA, Rees S. Morphology of parallel fibres in the cerebellar cortex of the rat: an experimental light and electron microscopic study with biocytin. J Comp Neurol. 1994;342:206–220. doi: 10.1002/cne.903420205. [DOI] [PubMed] [Google Scholar]
- Rancz EA, Ishikawa T, Duguid I, Chadderton P, Mahon S, Häusser M. High-fidelity transmission of sensory information by single cerebellar mossy fibre boutons. Nature. 2007;450:1245–1248. doi: 10.1038/nature05995. [DOI] [PMC free article] [PubMed] [Google Scholar]
- Russo MJ, Mugnaini E, Martina M. Intrinsic properties and mechanisms of spontaneous firing in mouse cerebellar unipolar brush cells. J Physiol. 2007;581:709–724. doi: 10.1113/jphysiol.2007.129106. [DOI] [PMC free article] [PubMed] [Google Scholar]
- Santamaria F, Bower JM. Background synaptic activity modulates the response of a modeled Purkinje cell to paired afferent input. J Neurophysiol. 2005;93:237–250. doi: 10.1152/jn.00458.2004. [DOI] [PubMed] [Google Scholar]
- Santamaria F, Jaeger D, De Schutter E, Bower JM. Modulatory effects of parallel fiber and molecular layer interneuron synaptic activity on Purkinje cell responses to ascending segment input: a modeling study. J Comput Neurosci. 2002;13:217–235. doi: 10.1023/a:1020266315730. [DOI] [PubMed] [Google Scholar]
- Santamaria F, Tripp PG, Bower JM. Feedforward inhibition controls the spread of granule cell-induced Purkinje cell activity in the cerebellar cortex. J Neurophysiol. 2007;97:248–263. doi: 10.1152/jn.01098.2005. [DOI] [PubMed] [Google Scholar]
- Sekerková G, Diño MR, Ilijic E, Russo M, Zheng L, Bartles JR, Mugnaini E. Postsynaptic enrichment of Eps8 at dendritic shaft synapses of unipolar brush cells in rat cerebellum. Neuroscience. 2007;145:116–129. doi: 10.1016/j.neuroscience.2006.11.061. [DOI] [PMC free article] [PubMed] [Google Scholar]
- Shambes GM, Gibson JM, Welker W. Fractured somatotopy in granule cell tactile areas of rat cerebellar hemispheres revealed by micromapping. Brain Behav Evol. 1978;15:94–140. doi: 10.1159/000123774. [DOI] [PubMed] [Google Scholar]
- Sims RE, Hartell NA. Differences in transmission properties and susceptibility to long-term depression reveal functional specialization of ascending axon and parallel fiber synapses to Purkinje cells. J Neurosci. 2005;25:3246–3257. doi: 10.1523/JNEUROSCI.0073-05.2005. [DOI] [PMC free article] [PubMed] [Google Scholar]
- Sims RE, Hartell NA. Differential susceptibility to synaptic plasticity reveals a functional specialization of ascending axon and parallel fiber synapses to cerebellar Purkinje cells. J Neurosci. 2006;26:5153–5159. doi: 10.1523/JNEUROSCI.4121-05.2006. [DOI] [PMC free article] [PubMed] [Google Scholar]
- Sultan F. Distribution of mossy fibre rosettes in the cerebellum of cat and mice: evidence for a parasagittal organization at the single fibre level. Eur J Neurosci. 2001;13:2123–2130. doi: 10.1046/j.0953-816x.2001.01593.x. [DOI] [PubMed] [Google Scholar]
- Takács J, Markova L, Borostyánköi Z, Görcs TJ, Hámori J. Metabotrop glutamate receptor type 1a expressing unipolar brush cells in the cerebellar cortex of different species: a comparative quantitative study. J Neurosci Res. 1999;55:733–748. doi: 10.1002/(SICI)1097-4547(19990315)55:6<733::AID-JNR8>3.0.CO;2-8. [DOI] [PubMed] [Google Scholar]
- Walter JT, Khodakhah K. The linear computational algorithm of cerebellar Purkinje cells. J Neurosci. 2006;26:12861–12872. doi: 10.1523/JNEUROSCI.4507-05.2006. [DOI] [PMC free article] [PubMed] [Google Scholar]
- Walter JT, Khodakhah K. The advantages of linear information processing for cerebellar computation. Proc Natl Acad Sci U S A. 2009;106:4471–4476. doi: 10.1073/pnas.0812348106. [DOI] [PMC free article] [PubMed] [Google Scholar]
- Xu-Friedman MA, Harris KM, Regehr WG. Three-dimensional comparison of ultrastructural characteristics at depressing and facilitating synapses onto cerebellar Purkinje cells. J Neurosci. 2001;21:6666–6672. doi: 10.1523/JNEUROSCI.21-17-06666.2001. [DOI] [PMC free article] [PubMed] [Google Scholar]