Abstract
Objective:
We aimed to compare quality of life (QOL) in women and men after ischemic stroke or TIA, and to determine the incremental impact of demographic, socioeconomic, clinical, and stroke-specific effects on longitudinal QOL.
Methods:
We assessed QOL in patients with ischemic stroke or TIA at 3 and 12 months postdischarge in the Adherence eValuation After Ischemic stroke–Longitudinal Registry using the European Quality of Life–5 Dimensions (EQ-5D) instrument. We generated multivariable linear regression models to evaluate the association between sex and EQ-5D while sequentially adjusting for sociodemographic, clinical, and stroke-related variables. We also used a proportional odds model to assess sex differences in the change in EQ-5D scores from 3 to 12 months.
Results:
A total of 1,370 patients were included, 53.7% male, median age 65 years (interquartile range 56–77 years). Women had significantly lower QOL at 3 months (unadjusted EQ-5D 0.81 in women vs 0.84 in men; p < 0.001) and 12 months (0.83 vs men 0.84; p < 0.001) poststroke. After multivariable adjustment for sociodemographic, clinical, and stroke-related factors, women continued to have lower QOL at 3 months (mean difference −0.036; p = 0.003) and at 12 months (mean difference −0.022; p = 0.046). Women fared worse in the dimensions of mobility, pain/discomfort, and anxiety/depression at 3 and 12 months. There were no sex differences in change in EQ-5D score from 3 to 12 months.
Conclusion:
Women have worse QOL than men up to 12 months after stroke, even after adjusting for important sociodemographic variables, stroke severity, and disability.
Because stroke has dropped from the third to the fourth leading cause of death,1 increasing attention should be given to improving quality of life (QOL) for stroke survivors. Several patient factors, including age, socioeconomic status, stroke severity, mood, and sex (particularly societal roles), may influence QOL after stroke.2–4 Multiple studies,5–14 but not all,15–18 have shown that women have worse QOL after stroke than men, particularly in the domains of mental and physical function.5,6,10,14 The timing and longitudinal assessment of QOL may be important, as sex differences may be greater early after stroke, then diminish over the long term with rehabilitation and recovery.19 Whether there are truly differences in QOL for men and women independent of these factors is uncertain.
Our aims in this analysis were to (1) compare QOL in men and women at 3 and 12 months, (2) compare the change in QOL over time between men and women, and (3) determine the incremental impact of demographic, socioeconomic, clinical, and stroke-specific effects on longitudinal QOL measured poststroke.
METHODS
The Adherence eValuation After Ischemic stroke–Longitudinal (AVAIL) Registry is a national, multicenter, longitudinal registry of ischemic stroke and TIA patients enrolled at Get With The Guidelines–Stroke (GWTG–Stroke) hospitals. The rationale and methods for this registry have been described in detail.20 Briefly, eligible patients had a primary diagnosis of ischemic stroke or TIA, were older than 18 years, directly admitted through the emergency department, able to sign informed consent or had a legally authorized representative, their clinical data were collected as part of the GWTG–Stroke program, and were discharged alive.
At baseline, data collected via the GWTG–Stroke Registry, living status, working and marital status, self-reported adequacy of household income, ambulatory status, education level, and medications at hospital discharge were collected and sent to the coordinating center.
Questionnaires at 3 and 12 months were performed via telephone by centrally located and trained, bilingual interviewers at the coordinating center. QOL was measured using the European Quality of Life–5 Dimensions (EQ-5D) instrument.21 The EQ-5D is a generic, not disease-specific, QOL instrument that elicits a health state description in 5 dimensions (mobility, self-care, usual activities, depression/anxiety, and pain).21 The EQ-5D has been validated for stroke.22 For each of the 5 dimensions of the EQ-5D, there are 3 response categories: no impairment, some/moderate, and extreme impairment. Scores are normalized and continuous so that 1 (maximum score) equals perfect health and a minimum negative score is −0.11. Death is included as a health state and scored 0.23 EQ-5D information was only collected from patients who could directly answer the questions from the interviewers. When a proxy respondent informed the interviewer that the stroke patient had died during the follow-up period, this individual was assigned a score of 0 as per the instrument validation.23 EQ-5D index scores were calculated using US population-based methods publicly available online.24 Other measures included disability (modified Rankin Scale [mRS]), and Patient Health Questionnaire–8 for depression severity.25,26 Number of all-cause and stroke-related hospitalizations were also collected.
A participant was lost to follow-up only after multiple contact attempts were unsuccessful and the time from discharge was more than 639 days or the subject/proxy refused. Patients excluded from the analysis dataset are shown in figure 1.
Figure 1. Flow diagram of enrollment, follow-up, and analysis for AVAIL subjects.
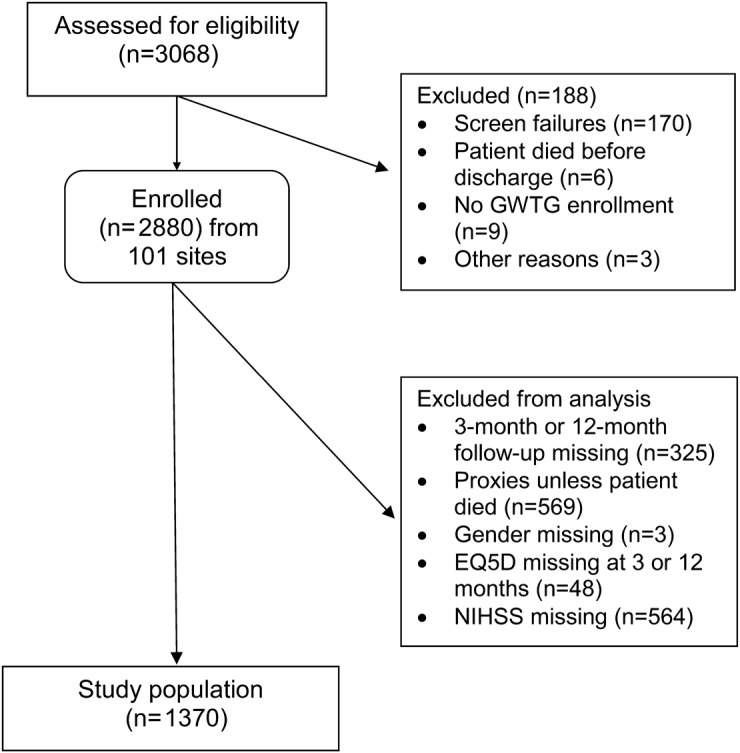
AVAIL = Adherence eValuation After Ischemic stroke–Longitudinal; EQ-5D = European Quality of Life–5 Dimensions; GWTG–Stroke = Get With The Guidelines–Stroke; NIHSS = NIH Stroke Scale.
Standard protocol approvals, registrations, and patient consents.
Each participating site obtained institutional review board approval before screening subjects for AVAIL. Written informed consent was obtained from all participants or their legal representatives.
Statistical analysis.
Descriptive statistics (Pearson χ2 tests for categorical variables, and Wilcoxon rank-sum tests for continuous, nonnormally distributed variables) for baseline characteristics and outcomes were compared for men vs women at 3 and 12 months. Prespecified variables included initial NIH Stroke Scale (NIHSS) and 3-month Patient Health Questionnaire–8 (median scores), mRS (good outcome <3 vs poor outcome ≥3), persistence with secondary prevention medications,27 utilization of rehabilitation, and rehospitalization for recurrent stroke or all causes.
Sex differences in EQ-5D scores at 3 months were generated using a multivariable linear regression model. To determine the incremental confounding effects of groups of variables on sex differences, we used a 4-step sequential modeling strategy. Step 1 was an unadjusted model with sex only; step 2 included sex plus demographic variables (age, race, and marital status); step 3 included step 2 variables plus additional sociodemographic factors (education, baseline living and working status, self-reported adequate income, and insurance status); step 4 included step 3 plus clinical factors (stroke vs TIA, number of cardiovascular risk factors, number of medications prescribed at discharge, and NIHSS score). Clinically important confounding was defined as a 10% change in the regression coefficient for sex.28
A similar approach was used for the analysis of the 12-month EQ-5D data except that an additional fifth step in the model included step 4 plus the following variables collected at the 3-month interview: persistence with medications (all vs not all medications at discharge compared with 3-month medication use), rehabilitation use, recurrent stroke, mRS score (measure of disability), living situation, and working status at 3 months. Change in self-reported adequacy of household income from 3 to 12 months (specified in 4 groups: adequate at both time points, not adequate at both time points, change from adequate to not adequate, or change from not adequate to adequate). We did not adjust for the EQ-5D score at 3 months in this model. Sensitivity analyses included those with missing NIHSS score and excluded those who died using the same methodology for both models. In addition, we analyzed EQ-5D and sex stratified by TIA or stroke, and mobility dimensions by sex, stratified by age.
To analyze change in QOL over time, minimally important difference in EQ-5D was defined as 0.07.29 We then analyzed whether each participant had improvement (increase of ≥0.07), worsening (decrease of ≥0.07), or had no change (≤0.07) in QOL from 3 to 12 months using an ordinal logistic regression model. We used a proportional odds approach to model the effect of sex (female vs male) across these 3 ordinal levels of change (i.e., improved, no change, worsened). This model assumes that the odds ratio (OR) describing the sex difference in the change in QOL over time is proportional (i.e., the same) across all possible dichotomizations of the outcome variable. In other words, the odds are the same for the comparison between improved EQ-5D vs no change or worsened EQ-5D (combined) as it is for improved or no change in EQ-5D (combined) vs worsened EQ-5D. The adjusted model included the same variables as was included in step 5 of the 12-month model (i.e., demographic, socioeconomics, clinical, and 3-month variables). All statistics were performed with SAS 9.2 (SAS Institute, Cary, NC).
RESULTS
Figure 1 displays the eligibility, enrollment, and the final study population of 1,370 participants. There was no significant difference in baseline characteristics in the 19.6% of the population who did not have NIHSS score recorded compared with those who did (data not shown). Twenty-nine patients (2.1%) in the study population died during follow-up. There were 325 patients (11.3%) who could not be contacted (lost to follow-up). These participants had lower levels of education, inadequate household income, were less likely married, more likely discharged to an institution, and discharged on more medications than the analysis cohort.
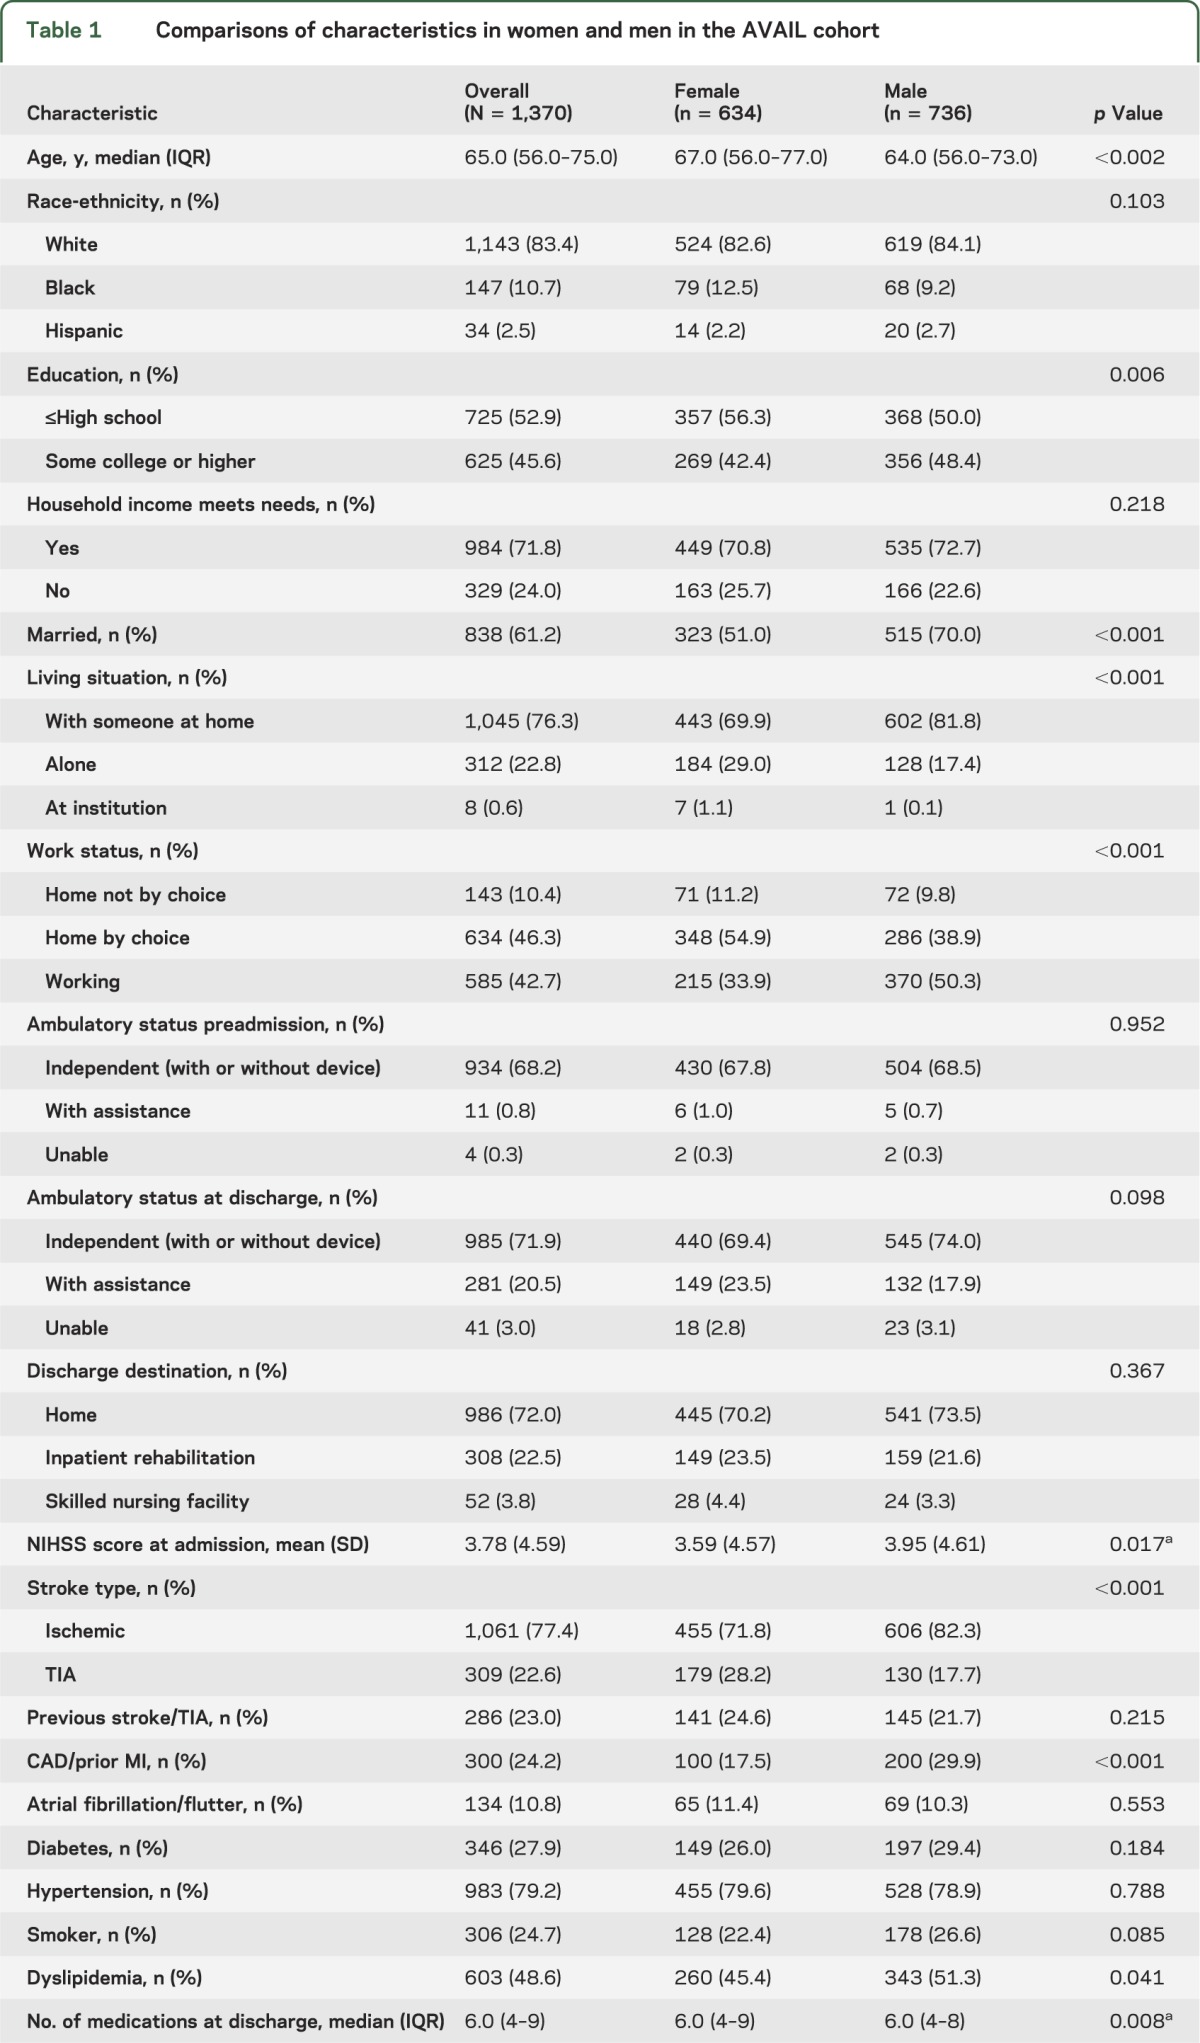
Women were older than men, less likely to be married, less likely to have college-level education, more likely to be living alone, and more likely to not be working (by choice). Men were more likely to have a history of coronary artery disease/prior myocardial infarction, and dyslipidemia, and women were more likely to have had a TIA. A higher proportion of women had greater disability at 3 months, and more severe depression (table 1).
Table 1.
Comparisons of characteristics in women and men in the AVAIL cohort
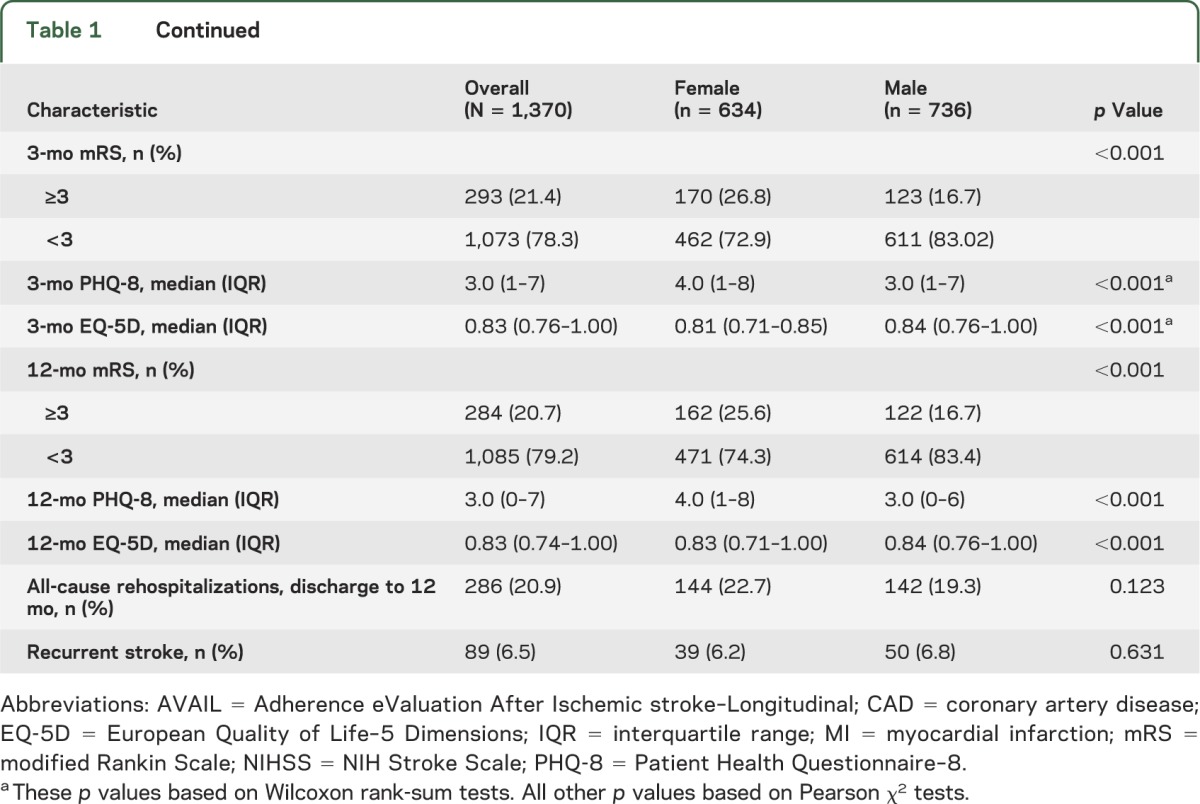
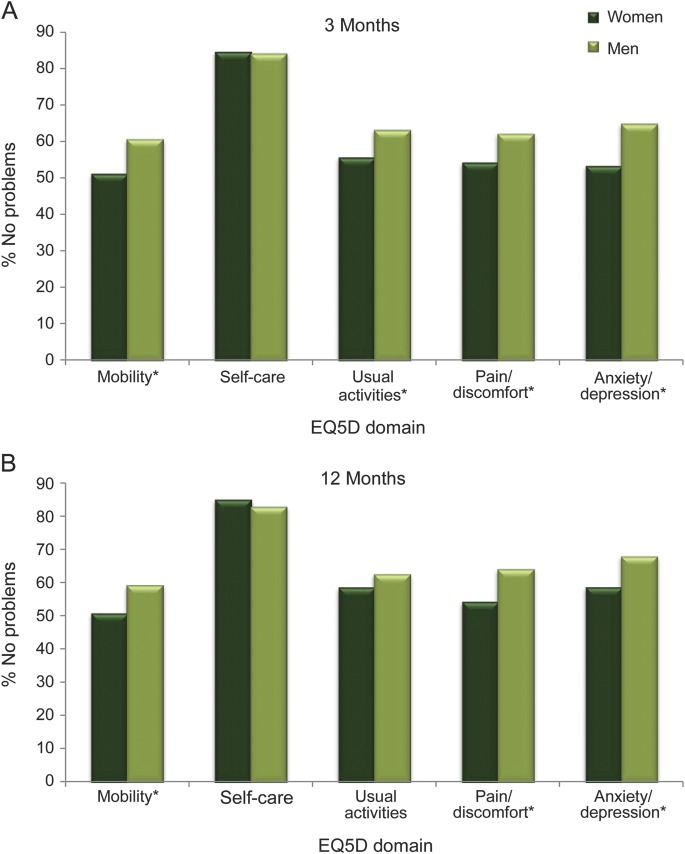
At 3 months, women had significantly lower QOL (table 1). Assessment of the individual domains of the EQ-5D at 3 months showed that women were more likely than men to report problems with mobility, usual activities, pain/discomfort, and anxiety and depression (figure 2A).
Figure 2. EQ-5D and the proportion with no problems for each dimension in men and women.
(A) 3 months. (B) 12 months. EQ-5D = European Quality of Life–5 Dimensions. *p < 0.007.
At 12 months, women had lower EQ-5D scores than men, but the magnitude of the unadjusted EQ-5D differences were diminished. A higher proportion of men than women reported no problems in the domains of mobility, pain, and anxiety/depression, but there was no longer a difference in usual activities (figure 2B).
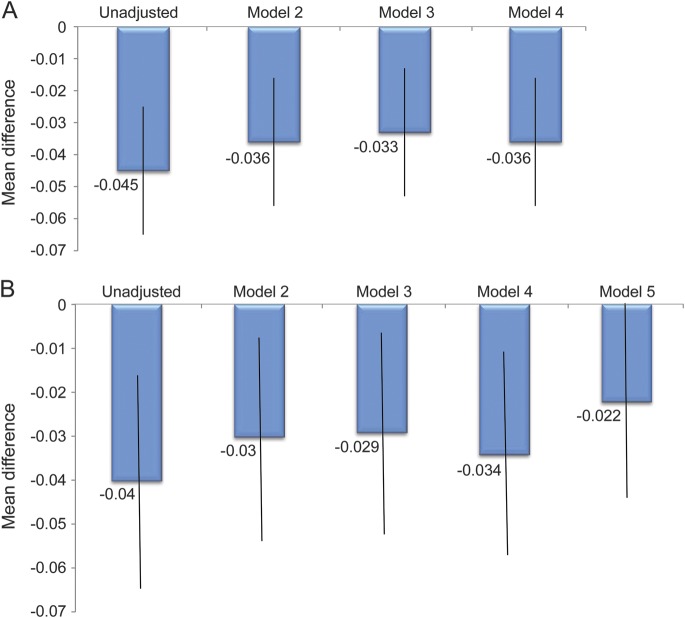
Multivariable modeling of EQ-5D at 3 months showed that at each sequential model (representing a larger set of potential confounding variables), female sex was independently associated with worse QOL (figure 3A and table 2). Using our definition of meaningful confounding, age, race, and marital status produced the largest change in the mean sex difference (20%), whereas adding socioeconomic variables (step 3), or clinical variables (step 4) did not result in any further substantial changes in the regression coefficient for sex (figure 3A and table 2). Excluding those who died (n = 29) had no substantial effect on the models at any step.
Figure 3. Mean difference (women to men) in multivariable models of EQ-5D.
(A) 3-month models. Model 2: sex, age, race, marital status; model 3: model 2 plus education, baseline living and work status,* adequate income,* and insurance; model 4: model 3 plus stroke vs TIA, number of risk factors, number of medications prescribed at discharge,* and NIHSS score.* *p < 0.007 in model 4. (B) 12-month models. Model 2: Sex,† age, race, marital status; model 3: model 2 plus education, baseline living and work status,* adequate income, and insurance; model 4: model 3 plus stroke vs TIA, number of risk factors, number of medications prescribed at discharge,* and NIHSS score.* Model 5: model 4 plus 3-month living and work status; adequate income unchanged baseline to 3 months*; recurrent stroke,* modified Rankin Scale score ≥3,* had rehabilitation,* and medication persistence, all at 3 months.* †p = 0.046, and *p < 0.008 in model 5. EQ-5D = European Quality of Life–5 Dimensions; NIHSS = NIH Stroke Scale.
Table 2.
Multivariable sequential modeling of 3-month EQ-5D
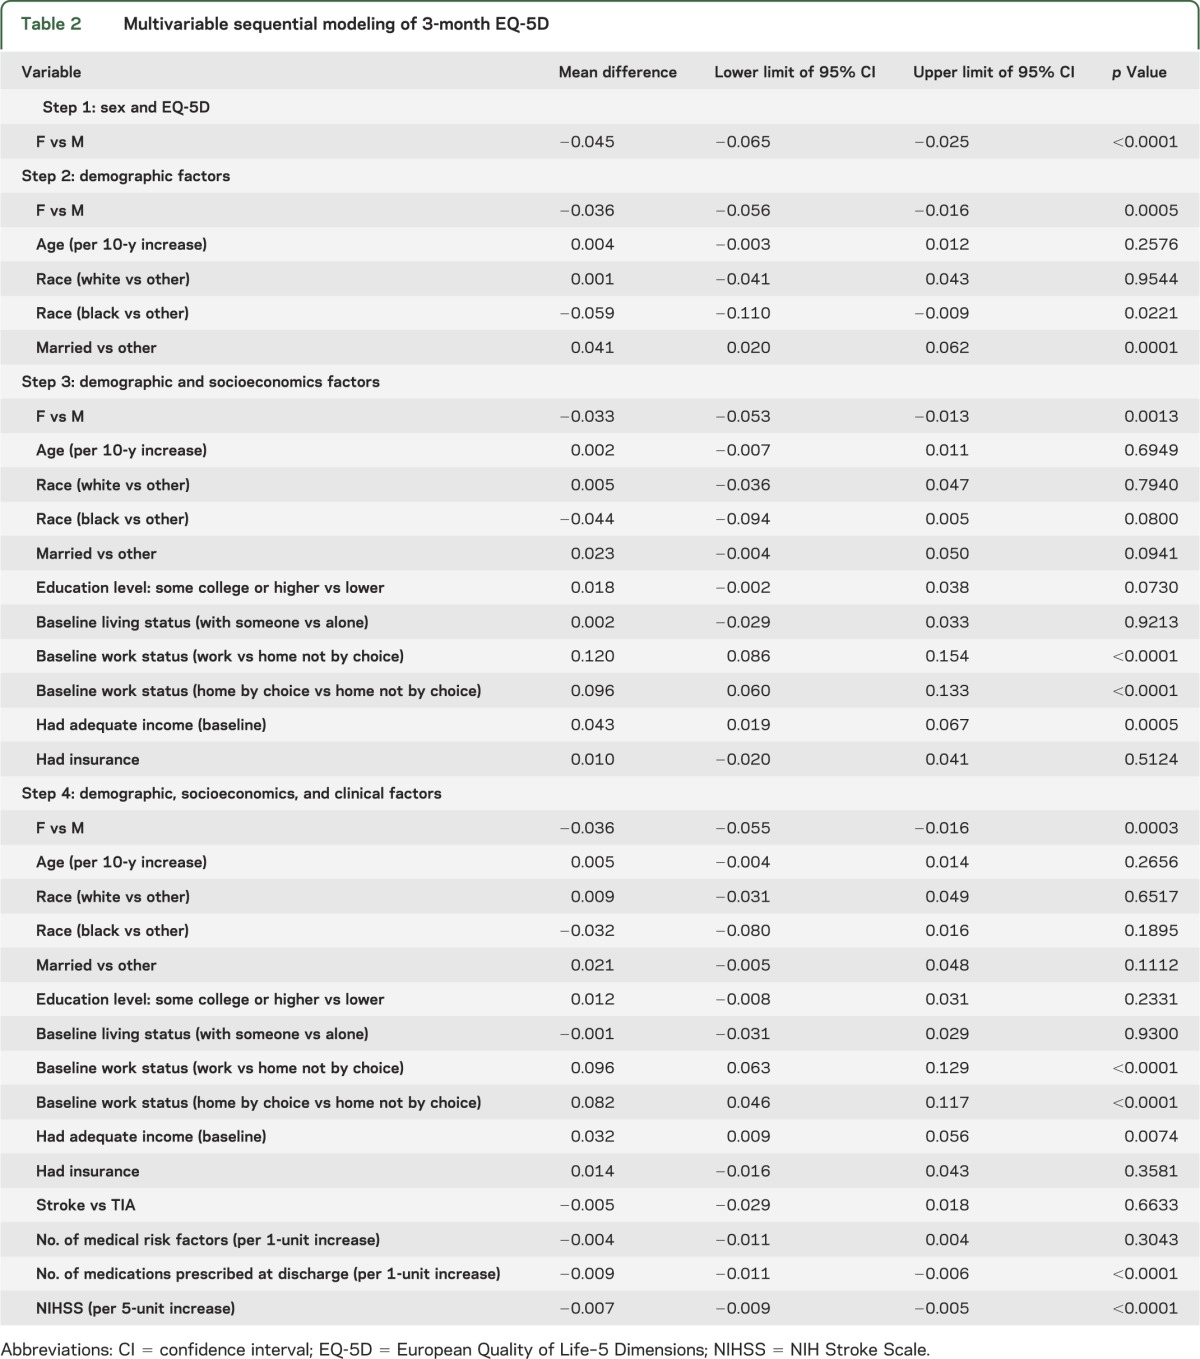
Modeling at 12 months also showed that age, race, and marital status were meaningful confounders (25% change; figure 3B, and table e-1 on the Neurology® Web site at Neurology.org). Further attenuation of the sex effect (35% change) occurred with the addition of 3-month variables (living status, work status, recurrent stroke, disability, and medication persistence; figure 3B and table e-1), suggesting that these variables are also meaningful confounders of sex differences in QOL long term.
The EQ-5D indices were unchanged from 3 to 12 months in 50.7% (50.0% women and 51.2% men), increased in 25.3% (25.4% women and 25.1% men), and decreased in 24.1% (24.6% women and 23.6% men) of the overall study population. The χ2 test for the proportional odds assumption was 0.2077 (p = 0.648; unadjusted proportional OR 0.981; 95% confidence interval [CI] 0.803–1.200), meaning the assumption of proportional odds held. After adjustment for the same variables in the final fifth step of the 12-month model, the proportional OR for the sex difference (female vs male) in the change in QOL from 3 to 12 months was 0.95 (95% CI 0.767–1.175; p = 0.634) indicating that there was no significant effect of sex on the change in EQ-5D over time.
DISCUSSION
QOL after stroke is a vitally important outcome for survivors. We summarized the studies that assessed sex and QOL (table e-2), which showed that the majority of studies reported worse QOL in women even after adjustment for age and other sociodemographic and functional status variables.2,3,5–7,10–14 However, only one study used the EQ-5D for the QOL measure,11 and none of these studies included the combination of sociodemographic, clinical, stroke-related, and intermediate 3-month variables for longer-term QOL. Therefore, our results improve upon prior published studies.19
The AVAIL data allowed our analysis to include covariates that are important predictors of stroke outcomes (such as stroke severity), as well as potential confounders of the impact of sex on QOL (such as sociodemographic factors). We found that the incremental impact of clinical variables attenuated the mean difference in EQ-5D at both time points. Age, race, and marital status led to the largest attenuation of the sex effect on EQ-5D at 3 months. Marital status was the major confounder resulting in a 20% attenuation of sex difference (data not shown). In contrast, socioeconomic (step 2) and clinical (step 3) factors were not significant confounders. At 12 months, we found evidence of confounding of the sex and EQ-5D relationship after we adjusted for 3-month working status, adequacy of income from 3 to 12 months, and having a recurrent stroke or moderate disability, although the sex difference was still significant. These results serve to fill important gaps related to sex differences in poststroke QOL overall, while considering the timing of the assessments.
With the EQ-5D, we present possible insights into the mechanisms for sex differences in QOL after stroke. Women had worse mobility at 3 months, but in subsequent sensitivity analyses, we found that the difference was only significant in those older than 75 years (61% of women vs 49% of men had some difficulties walking; p = 0.036), emphasizing the importance of age-related factors on mobility. A study from Korea showed that women have worse disability (mRS scores) at 3 and 12 months poststroke after adjustment for age and stroke severity.30 The usual activities dimension of the EQ-5D was also worse in women in AVAIL at 3 months, which may reflect mobility, and/or the ability to perform activities of daily living (ADL). The Framingham Heart Study cohort showed more impairment in ADL in women vs men 3 months after stroke.31 Similarly, 3-month follow-up of a stroke cohort found that women were less likely to achieve ADL independence compared with men (adjusted OR 0.37, 95% CI 0.19–0.87).5
One possible explanation for the difference in mobility and functional ADL may be that women may have more limitations in muscle function that affect physical recovery, as shown in a rehabilitation cohort matched for stroke severity between women and men.32 Given the significance of 3-month disability on 12-month EQ-5D in the current analysis, the reduced ability of women to recover physically may be an important driver of the differences in longer-term QOL.
The reasons for pain or discomfort dimension of the EQ-5D were not ascertained, but could be attributable to stroke- or nonstroke-related conditions. Headaches, spasticity, or frozen/stiff joints could directly result from the stroke, for example. Other pain complaints could be attributable to age-related changes, such as arthritis or muscle soreness. This is clearly an area that should be explored in future studies so that specific interventions could be developed and tested.
Although sex was not independently related to depression in a separate analysis of the AVAIL cohort,33 several studies have shown depression to be more common in women after stroke, and that it is highly correlated with QOL.18,34,35 Women may be more likely to report incomplete recovery and greater need for help than men, despite achieving high function with ADL, and depressed mood may be one reason for this inconsistency.36 Based on results of these self-reported outcomes after stroke, it is possible that women may have higher expectations for recovery, or worse coping or adaptation strategies.37 Caregiver support may be a major factor in QOL, although it remains unclear as to whether the sex of the caregiver makes a difference in the QOL of stroke patients.38
There were significant sex differences in EQ-5D scores, whether diagnosed with TIA or stroke. However, the sex-by-stroke type interaction term was not significant (data not shown). This result may be related to prestroke differences in QOL, or because factors other than residual physical disability influence QOL, such as sociodemographic factors, comorbidities, depression, anxiety, or perhaps fear of an impending stroke.
We found no significant sex differences in the change in EQ-5D scores from 3 to 12 months. However, it is important to note that the minimally important difference for EQ-5D in a stroke population has not been determined. Overall, QOL declined over time when compared with stroke-free controls in the REGARDS (Reasons for Geographic and Racial Differences in Stroke) Study, but there were no sex differences found in their QOL measure (12-Item Short Form Health Survey).16 Other longitudinal studies of stroke survivors have shown that men had worse QOL between 3 and 12 months17 or that QOL improved from 4 to 16 months, but less so in men vs women.18 Differences in populations, QOL measures used, and criteria/definition of QOL change may explain the disparate results between our analysis and these other longitudinal studies.
There are several unique strengths to this study. The rich data collection allowed us to adjust for multiple categories of factors in our sequential modeling. We assessed change in EQ-5D over time, which is important because short-term measurement of QOL may not translate into long-term QOL. AVAIL also had a very low attrition rate (11.3%).
However, there are several limitations. First, a large group of patients (approximately 20%) were excluded because of missing NIHSS scores. In a sensitivity analysis, we generated models of 3- and 12-month EQ-5D that included these patients with missing NIHSS scores. There was no significant change in the sex differences in the 3-month model, which was most likely to be influenced by initial stroke severity; however, the 12-month model showed further attenuation of sex differences (mean difference −0.015, p = 0.1 vs −0.022, p = 0.05 in the model of nonmissing NIHSS scores). Exclusion of this subpopulation does not alter our overall conclusions. We also acknowledge that our cohort represents those with mild stroke, but these patients still have a substantial risk of poor outcome.39 The EQ-5D instrument may not capture instrumental ADL, such as the ability to use a telephone or remote control, a very important facet of QOL. We did not obtain EQ-5D data from proxies, thereby excluding the most impaired stroke survivors. Important for our assessment of sex differences in EQ-5D, we did not have a stroke-free comparison group to determine sex differences beyond those with stroke, and we did not collect QOL data relevant to the prestroke period. This may be important because in general population cohorts, women have been shown to have worse QOL than men (EQ-5D 0.88 for men and 0.86 for women).40 Sex differences in QOL prestroke could partially explain the difference observed poststroke. Going forward, longitudinal cohorts that collect QOL and functional status before incident stroke could potentially address this problem. We also recognize that the attenuation of the sex differences after adjustment for 3-month variables in the 12-month QOL model may be because these variables act as mediators rather than confounders.28 Lastly, the EQ-5D includes a component for self-rated health status (visual analog scale from 0 to 100), but this could not be used with our telephone-based collection of this instrument.
Women have worse QOL than men up to 12 months after stroke, even after adjusting for important sociodemographic variables and stroke severity. Although the EQ-5D is not a stroke-specific QOL instrument, our results suggest that further research on mobility, pain or discomfort, and anxiety/depression may allow a clearer understanding for how to improve QOL after stroke in women.
Supplementary Material
ACKNOWLEDGMENT
The authors acknowledge Laura Drew, RN, and Judy Stafford, MS, for their invaluable contributions to the AVAIL Registry enrollment and analyses.
GLOSSARY
- ADL
activities of daily living
- AVAIL
Adherence eValuation After Ischemic stroke–Longitudinal
- CI
confidence interval
- EQ-5D
European Quality of Life–5 Dimensions
- GWTG–Stroke
Get With The Guidelines–Stroke
- mRS
modified Rankin Scale
- NIHSS
NIH Stroke Scale
- OR
odds ratio
- QOL
quality of life
Footnotes
Supplemental data at Neurology.org
AUTHOR CONTRIBUTIONS
Dr. Bushnell is co-principal investigator for the AVAIL Registry, and for this analysis, she had a substantive role in the design and conceptualization of the study, interpretation of the data, and drafting and revising the manuscript. Dr. Reeves participated in the design and conceptualization of the study, interpretation of the data, and drafting and revising the manuscript. Ms. Zhao and Dr. Pan aided in the design, conceptualization, and interpretation of the analysis, and drafting of the manuscript. Dr. Prvu-Bettger aided in the interpretation of the data, and drafting and revising the manuscript. Ms. Zimmer had a role in the acquisition of the data, study supervision, data interpretation, and revising the manuscript. Dr. Olson had a role in data interpretation, and revising the manuscript. Dr. Peterson had a substantive role in the design and conceptualization of the study, obtaining funding, interpretation of the data, and drafting and revising the manuscript.
STUDY FUNDING
The AVAIL Registry was funded by an unrestricted grant from Bristol-Myers Squibb/Sanofi Joint Partnership. AVAIL analyses were also supported in part by the Agency for Healthcare Research and Quality (U18HS016964). The content does not necessarily represent the official views of the Agency for Healthcare Research and Quality.
DISCLOSURE
C. Bushnell: during the active funding period of AVAIL from 2006 to 2009, Dr. Bushnell received research salary support from Bristol-Myers Squibb/Sanofi Joint Partnership. She received research salary support funding from NIH/National Institute of Neurological Disorders and Stroke KO2 NS058760. M. Reeves, X. Zhao, W. Pan, J. Prvu-Bettger, and L. Zimmer report no disclosures relevant to the manuscript. D. Olson received research funding from Covidien, Medtronic, Hospira Medical, and Integra NeuroCare. E. Peterson received research salary and/or grant support from Ortho-McNeil-Janssen Pharmaceuticals, Inc., Bristol-Myers Squibb, Eli Lilly & Company, Johnson & Johnson, Merck & Co., Sanofi-Aventis, American Heart Association, American College of Cardiology, and the Society of Thoracic Surgeons. He received payment for consulting services from Boehringer Ingelheim, AstraZeneca, Genentech, Johnson & Johnson, Ortho-McNeil-Janssen Scientific Affairs, LLC, Pfizer, Sanofi-Aventis, and WebMD. Go to Neurology.org for full disclosures.
REFERENCES
- 1.Roger VL, Go AS, Lloyd-Jones DM, et al. Heart disease and stroke statistics—2012 update: a report from the American Heart Association. Circulation 2012;125:e2–e220 [DOI] [PMC free article] [PubMed] [Google Scholar]
- 2.Sturm JW, Donnan GA, Dewey HM, et al. Quality of life after stroke: the North East Melbourne Stroke Incidence Study (NEMESIS). Stroke 2004;35:2340–2345 [DOI] [PubMed] [Google Scholar]
- 3.Patel MD, McKevitt C, Lawrence E, Rudd AG, Wolfe CD. Clinical determinants of long-term quality of life after stroke. Age Ageing 2007;36:316–322 [DOI] [PubMed] [Google Scholar]
- 4.Delcourt C, Hackett M, Wu Y, et al. Determinants of quality of life after stroke in China: the ChinaQUEST (QUality Evaluation of Stroke care and Treatment) Study. Stroke 2011;42:433–438 [DOI] [PubMed] [Google Scholar]
- 5.Gargano JW, Reeves MJ. Sex differences in stroke recovery and stroke-specific quality of life: results from a statewide stroke registry. Stroke 2007;38:2541–2548 [DOI] [PubMed] [Google Scholar]
- 6.Gray L, Sprigg N, Bath P, et al. Sex differences in quality of life in stroke survivors: data from the Tinzaparin in Acute Ischaemic Stroke Trial (TAIST). Stroke 2007;38:2960–2964 [DOI] [PubMed] [Google Scholar]
- 7.Franzén-Dahlin A, Laska AC. Gender differences in quality of life after stroke and TIA: a cross-sectional survey of out-patients. J Clin Nurs 2012;21:2386–2391 [DOI] [PubMed] [Google Scholar]
- 8.Gokkaya NK, Aras MD, Cakci A. Health-related quality of life of Turkish stroke survivors. Int J Rehabil Res 2005;28:229–235 [DOI] [PubMed] [Google Scholar]
- 9.Cadilhac DA, Dewey HM, Vos T, Carter R, Thrift AG. The health loss from ischemic stroke and intracerebral hemorrhage: evidence from the North East Melbourne Stroke Incidence Study (NEMESIS). Health Qual Life Outcomes 2010;8:49. [DOI] [PMC free article] [PubMed] [Google Scholar]
- 10.Almborg AH, Ulander K, Thulin A, Berg S. Discharged after stroke: important factors for health-related quality of life. J Clin Nurs 2010;19:2196–2206 [DOI] [PubMed] [Google Scholar]
- 11.Franceschini M, La Porta F, Agosti M, Massucci M. Is health-related quality of life of stroke patients influenced by neurological impairments at one year after stroke? Eur J Phys Rehabil Med 2010;46:389–399 [PubMed] [Google Scholar]
- 12.Leach MJ, Gall SL, Dewey HM, Macdonell RAL, Thrift AG. Factors associated with quality of life in 7-year survivors of stroke. J Neurol Neurosurg Psychiatry 2011;82:1365–1371 [DOI] [PubMed] [Google Scholar]
- 13.Hochstenbach JB, Anderson PG, van Limbeek J, Mulder TT. Is there a relation between neuropsychologic variables and quality of life after stroke? Arch Phys Med Rehabil 2001;82:1360–1366 [DOI] [PubMed] [Google Scholar]
- 14.Singhpoo K, Charerntanyarak L, Ngamroop R, et al. Factors related to quality of life of stroke survivors. J Stroke Cerebrovasc Dis 2012;21:776–781 [DOI] [PubMed] [Google Scholar]
- 15.Kauhanen ML, Korpelainen JT, Hiltunen P, Nieminen P, Sotaniemi KA, Myllylä VV. Domains and determinants of quality of life after stroke caused by brain infarction. Arch Phys Med Rehabil 2000;81:1541–1546 [DOI] [PubMed] [Google Scholar]
- 16.Haley WE, Roth DL, Kissela B, Perkins M, Howard G. Quality of life after stroke: a prospective longitudinal study. Qual Life Res 2011;20:799–806 [DOI] [PMC free article] [PubMed] [Google Scholar]
- 17.Muus I, Petzold M, Ringsberg KC. Health-related quality of life among Danish patients 3 and 12 months after TIA or mild stroke. Scand J Caring Sci 2010;24:211–218 [DOI] [PubMed] [Google Scholar]
- 18.Jönsson AC, Lindgren I, Hallström B, Norrving B, Lindgren A. Determinants of quality of life in stroke survivors and their informal caregivers. Stroke 2005;36:803–808 [DOI] [PubMed] [Google Scholar]
- 19.Gall SL, Tran PL, Martin K, Blizzard L, Srikanth V. Sex differences in long-term outcomes after stroke functional outcomes, handicap, and quality of life. Stroke 2012;43:1982–1987 [DOI] [PubMed] [Google Scholar]
- 20.Bushnell C, Zimmer L, Schwamm L, et al. The Adherence eValuation After Ischemic Stroke Longitudinal (AVAIL) Registry: design, rationale, and baseline patient characteristics. Am Heart J 2009;157:428–435 [DOI] [PubMed] [Google Scholar]
- 21.EuroQol Group. EuroQol: a new facility for the measurement of health-related quality of life. Health Policy 1990;16:199–208 [DOI] [PubMed] [Google Scholar]
- 22.Dorman PJ, Waddell F, Slattery J, Dennis M, Sandercock P. Is the EuroQol a valid measure of health-related quality of life after stroke? Stroke 1997;28:1876–1882 [DOI] [PubMed] [Google Scholar]
- 23.Shaw JW, Johnson JA, Coons SJ. US valuation of the EQ-5D health states: development and testing of the D1 valuation model. Med Care 2005;43:203–220 [DOI] [PubMed] [Google Scholar]
- 24.Calculating the U.S. Population-based EQ-5D Index Score [online]. Rockville, MD: Agency for Healthcare Research and Quality; 2005. Available at: http://www.ahrq.gov/rice/EQ5Dscore.htm. Accessed February 20, 2013. [Google Scholar]
- 25.Spitzer R, Kroenke K, Williams J. Patient Health Questionnaire Study Group: validity and utility of a self-report version of PRIME-MD: the PHQ primary care study. JAMA 1999;282:1737–1744 [DOI] [PubMed] [Google Scholar]
- 26.Kroenke K, Strine TW, Spitzer RL, Williams JB, Berry JT, Mokdad AH. The PHQ-8 as a measure of current depression in the general population. J Affect Disord 2009;114:163–173 [DOI] [PubMed] [Google Scholar]
- 27.Bushnell C, Zimmer L, Pan W, et al. Persistence with stroke prevention medications 3 months after hospitalization. Arch Neurol 2010;67:1456–1463 [DOI] [PMC free article] [PubMed] [Google Scholar]
- 28.Rothman KJ, Greenland S. Modern Epidemiology, 2nd ed. Philadelphia: Lippincott-Raven; 1998 [Google Scholar]
- 29.Walters SJ, Brazier JE. Comparison of the minimally important difference for two health state utility measures: EQ-5D and SF-6D. Qual Life Res 2005;14:1523–1532 [DOI] [PubMed] [Google Scholar]
- 30.Kim JS, Lee KB, Roh K, Ahn MY, Hwang HW. Gender differences in the functional recovery after acute stroke. J Clin Neurol 2010;6:183–188 [DOI] [PMC free article] [PubMed] [Google Scholar]
- 31.Petrea RE, Beiser AS, Seshadri S, Kelly-Hayes M, Kase CS, Wolf PA. Gender differences in stroke incidence and poststroke disability in the Framingham Heart Study. Stroke 2009;40:1032–1037 [DOI] [PMC free article] [PubMed] [Google Scholar]
- 32.Paolucci S, Bragoni M, Coiro P, et al. Is sex a prognostic factor in stroke rehabilitation? A matched comparison. Stroke 2006;37:2989–2994 [DOI] [PubMed] [Google Scholar]
- 33.Husseini NE, Goldstein LB, Peterson ED, et al. Depression and antidepressant use after stroke and transient ischemic attack. Stroke 2012;43:1609–1616 [DOI] [PubMed] [Google Scholar]
- 34.Taylor-Piliae RE, Hepworth JT, Coull BM. Predictors of depressive symptoms among community-dwelling stroke survivors. J Cardiovasc Nurs 2012;28:460–467 [DOI] [PubMed] [Google Scholar]
- 35.White CL, McClure LA, Wallace PM, et al. The correlates and course of depression in patients with lacunar stroke: results from the Secondary Prevention of Small Subcortical Strokes (SPS3) Study. Cerebrovasc Dis 2011;32:354–360 [DOI] [PMC free article] [PubMed] [Google Scholar]
- 36.Chong JY, Lee HS, Boden-Albala B, Paik MC, Sacco RL. Gender differences in self-report of recovery after stroke: the Northern Manhattan Study. Neurology 2006;67:1282–1284 [DOI] [PubMed] [Google Scholar]
- 37.Donnellan C, Hevey D, Hickey A, O’Neill D. Defining and quantifying coping strategies after stroke: a review. J Neurol Neurosurg Psychiatry 2006;77:1208–1218 [DOI] [PMC free article] [PubMed] [Google Scholar]
- 38.Tiegs T, Heesacker M, Ketterson T, et al. Coping by stroke caregivers: sex similarities and differences. Top Stroke Rehabil 2006;13:52–62 [DOI] [PubMed] [Google Scholar]
- 39.Khatri P, Conaway MR, Johnston KC. Ninety-day outcome rates of a prospective cohort of consecutive patients with mild ischemic stroke. Stroke 2012;43:560–562 [DOI] [PMC free article] [PubMed] [Google Scholar]
- 40.Cherepanov D, Palta M, Fryback DG, Robert SA. Gender differences in health-related quality-of-life are partly explained by sociodemographic and socioeconomic variation between adult men and women in the US: evidence from four US nationally representative data sets. Qual Life Res 2010;19:1115–1124 [DOI] [PMC free article] [PubMed] [Google Scholar]
Associated Data
This section collects any data citations, data availability statements, or supplementary materials included in this article.


