Abstract
Background
Transdermal alcohol monitoring is a noninvasive method that continuously gathers transdermal alcohol concentrations (TAC) in real time; thus, its use is becoming increasingly more common in alcohol research. In previous studies, we developed models that use TAC data to estimate peak breath alcohol concentration (BrAC) and standard units consumed when the rate of consumption was tightly controlled.
Participants
Twenty-two healthy participants aged 21 to 52 who reported consuming alcohol on 1–4 days per week were recruited from the community. The final study sample included n = 11 men and n = 8 women. Both TAC and BrAC were monitored while each participant drank one, two, three, four and five beers in the laboratory on five separate days. In contrast to previous studies, a self-paced alcohol administration procedure was used.
Results
While there was considerable variation in the times it took to consume each beer, key TAC parameters were not affected by pace of drinking. TAC data were then used in combination with the previously derived equations and estimated peak BrAC and standard units of alcohol consumed.
Conclusions
Transdermal alcohol monitoring can be used to reliably estimate peak BrAC and standard number of units consumed regardless of the rate of consumption, further demonstrating its usefulness in clinical research.
Keywords: Transdermal Alcohol Monitoring, Binge Drinking, Alcohol Abuse, Breath and Blood Alcohol Concentration
INTRODUCTION
Transdermal alcohol monitoring devices use electrochemical means to detect alcohol expired through the skin. They provide a noninvasive method for continuously measuring transdermal alcohol concentrations in real-time (e.g., Leffingwell et al., 2013; Marques and McKnight 2009; Sakai et al., 2006; Swift, 2000, 2003; Swift et al., 1992). Primarily used in the criminal justice system, the use of transdermal alcohol monitoring has become increasingly more common in clinical research (e.g., Ayala et al., 2009; Barnett et al., 2011; Dougherty et al., 2012; Dougherty et al., under review; Hill-Kapturczak et al., in press; Leffingwell et al., 2013). We have conducted studies designed to increase the utility of the data gathered through transdermal alcohol monitoring devices and to explore their clinical efficacy.
Our laboratory has, by examining the relationship between alcohol consumption and resultant transdermal alcohol concentrations (TAC), derived methods to objectively quantify actual drinking behavior. We reported that transdermal alcohol monitoring data can be used to estimate both the peak breath alcohol concentrations achieved (Dougherty et al., 2012; Hill-Kapturczak et al., 2014) and the number of standard drinks of alcohol consumed during an episode of drinking (Dougherty et al., under review). The TAC parameters important to the estimation of both the breath alcohol levels and number of standard units were PeakTAC and Time-to-PeakTAC levels. One limitation of those previous studies was that they controlled the pace of alcohol consumption, and as a result, may not reflect the variable rates of drinking seen in the real world. Therefore, the current study used a self-paced alcohol drinking procedure to achieve individual variations in rates of alcohol consumption. We sought to determine if variation in the rate of drinking affected the parameters used in our previously derived formulas to estimate peak breath alcohol level and the number of standardized drinks of alcohol consumed.
MATERIALS AND METHODS
Participants
A total of 22 healthy participants aged 21 to 52 who reported consuming alcohol on 1–4 days per week were recruited from the community through internet, radio, and flyer advertisements. Exclusion criteria were: a body mass index < 18 or > 30 kg/m2, a current or past Axis I psychiatric disorder, pregnancy, poor medical health, current or past substance dependence, and a positive urine-drug test for drugs of abuse (cocaine, opiates, methamphetamines, barbiturates, benzodiazepines, THC). Additionally, potential participants must have reported a drinking episode in the previous 30 days that would produce a level of intoxication similar to those expected in the current study. The Institutional Review Board at The University of Texas Health Science Center at San Antonio reviewed and approved the experimental protocol.
Recruitment and Study Design
Respondents underwent an initial phone screening; potentially eligible individuals were invited to the laboratory for written informed consent and more detailed eligibility screening. At this screening visit, study personnel collected data including substance abuse history and characterized alcohol consumed during the last 28 days. Each participant underwent a physical examination (including a medical history) and psychiatric screening using the Structured Clinical Interview for DSM-IV-TR Axis I Disorders: Research Version, Non-Patient Edition (First et al., 2001). Each also provided a urine sample for drug and pregnancy testing.
Once enrolled, participants arrived at the laboratory at 7:30 a.m. on five consecutive days and provided a urine sample for drug and pregnancy testing before consuming alcohol. Breath samples were taken upon arrival to ensure sobriety. On the first day, participants were fitted with a transdermal alcohol monitor, which was worn continuously until study completion. After alcohol consumption in the laboratory (which started at 9:00 a.m.), participants were required to stay until their TAC readings were ≤ 0.005 g/dl (TAC monitoring described below), approximately three hours after breath alcohol concentration (BrAC) fell to 0.000 (BrAC monitoring described below). Participants were instructed to fast after midnight each day, and a meal was provided after BrAC levels reached 0.000 or 4:00 p.m. at the latest. Participants also abstained from drinking outside the laboratory until study completion as verified by the TAC monitors each morning.
Alcohol Administration
Participants drank one beer on the first day, five on the second day, and then consumed a decreasing number of beers on each consecutive day (i.e., 1, 5, 4, 3, and 2 beers). Typically, the dosing started on a Monday and was completed on Friday. This order was chosen to avoid higher levels of intoxication on Fridays and the potential effects on rates of self-paced drinking (i.e., participants altering their drinking rate so that they could be released earlier). Consumption was self-paced; participants were told they could drink as slowly or quickly as desired. Controlling the number of drinks but allowing time to vary allowed us to examine the drinking rate parameter within the context of constant numbers of standard drinks as done in our previous studies. Study staff recorded the time it took participants to complete each beer. Participants consumed 12 oz. Corona beers (Grupo Modelo S.A.B. de C.V., Mexico City, Mexico); each contains 4.6% alcohol by volume (16.3 ml of alcohol and equal to 0.92 standard units of alcohol; NIAAA, 2010).
Breath Alcohol Concentration (BrAC) Monitoring
BrAC was measured every 15 minutes during the first four hours after consuming the first beer using portable breathalyzers (Dräger Alcotest 6810, Irving, TX). The readouts of the Dräger Alcotest 6810 are estimated percent blood alcohol concentrations (% BAC). After four hours, readings were then taken every 30 minutes. Participants rinsed their mouths with water twice before giving a breath sample, and a new disposable mouthpiece was used for each measurement.
Transdermal Alcohol Concentration (TAC) Monitoring
Secure Continuous Remote Alcohol Monitors (SCRAM-II™, Alcohol Monitoring Systems Inc., Highlands Ranch, CO) were used to measure TAC and takes readings approximately every 30 minutes. This device includes both infrared and temperature sensors to detect tampering with the device. For current analyses, TAC data included Peak TAC (the highest TAC value recorded during a drinking episode), Time-to-Peak TAC (the time in minutes from the last 0.000 g/dl TAC recording to the first peak TAC recording in a drinking episode), and AUC (area under the TAC curve).
Data Analysis
Repeated-measures ANOVA was used to examine the effects of sex, number of beers consumed, and their interaction on the total time taken to consume all beers for any given day and the average time taken to consume each beer, separately, throughout the day. Sex-related differences in actual BrAC and/or TAC were examined by independent samples t-tests with unequal variance assumption. Peak BrAC (Hill-Kapturczak et al., 2014) and standardized units of alcohol consumed (Dougherty et al., under review) were estimated from TAC data using previously published equations. In brief, estimated peak BrAC (eBrAC) was calculated as follows: eBrAC = 0.02158 + 0.3940 * PeakTAC + 0.000149 * Time-to-PeakTAC - 0.00366 * Sex - 0.1887 * PeakTAC * Sex. The estimated number of standard units or drinks (eUnits) was calculated as follows: eUnits = 0.6990 + 0.006317 * Time-To-PeakTAC + 0.09735 * AUC - 0.00097 * AUC * AUC + 0.08492 * AUC * Sex - 0.00223 * AUC *AUC * Sex. On days where TAC data remained 0, estimations were also recorded as 0; sex was coded as Men = 1, Women = 0. Paired-sample Student’s t-tests were used to test for significant differences between actual and estimated data. SAS Proc Mixed (SAS Release 9.2, SAS Institute, Inc., Cary, NC) was used to examine the effect of consumption rate (measured by minutes to complete the last beer) on the estimations of peak BrAC and standardized units of alcohol consumed after adjusting for the estimated peak BrAC (i.e., eBrAC) and estimated number of standard units of drinks (i.e., eUnits) using the previously published equations. A marginal R2 was used to summarize the amount of variance in actual peak BrAC levels or standardized units of alcohol consumed explained by the fixed factors in the final mixed-effects model (Nakagawa and Schielzeth, 2013).
RESULTS
We enrolled 22 participants into the study. Data from two male participants were excluded due to faulty transdermal alcohol monitoring devices, and one female participant withdrew for personal reasons. As a result, the final study sample included n = 11 men and n = 8 women; participants’ characteristics are shown in Table 1. Our sample was primarily Caucasian. Significant sex differences indicated females self-reported drinking fewer drinks per drinking event and were more likely to be of Hispanic ethnicity than their male counterparts. Males were of greater body weight (not shown), but the BMI differences were only marginally significant (p = .067).
Table 1.
Demographic Characteristics
| Characteristic | Men (n = 11)
|
Women (n = 8)
|
Total (n = 19)
|
p | |||
|---|---|---|---|---|---|---|---|
| M | SD | M | SD | M | SD | ||
| Age (Years) | 27.0 | 7.0 | 26.9 | 5.5 | 26.9 | 6.2 | .967 |
| Education (Years) | 10.8 | 5.7 | 14.0 | 4.4 | 11.3 | 5.3 | .567 |
| Body Mass Index | 26.0 | 3.2 | 23.2 | 2.7 | 24.8 | 3.2 | .067 |
| Alcohol (Drinks/Week) | 21.5 | 10.1 | 14.0 | 9.2 | 18.4 | 10.2 | .115 |
| Drinking Days/Week | 2.5 | 0.8 | 2.8 | 0.9 | 2.6 | 0.9 | .468 |
| Drinks/Drinking Event | 8.7 | 3.3 | 4.8 | 2.1 | 7.0 | 3.3 | .006 |
| Race* | |||||||
| (AI/AA/C/O) | 0/1/9/1 | 1/0/5/2 | 1/1/14/3 | .213 | |||
| Ethnicity† | |||||||
| (H/N) | 3/8 | 6/2 | 9/10 | .040 | |||
Note.
Race is represented as the frequency of individuals in each group identifying as American Indian (AI), African-American (AA), Caucasian (C), or Other (O).
Ethnicity is represented as the frequency of individuals in each group identifying as Hispanic (H) or Non-Hispanic (N).
Individual Variations in Alcohol Consumption
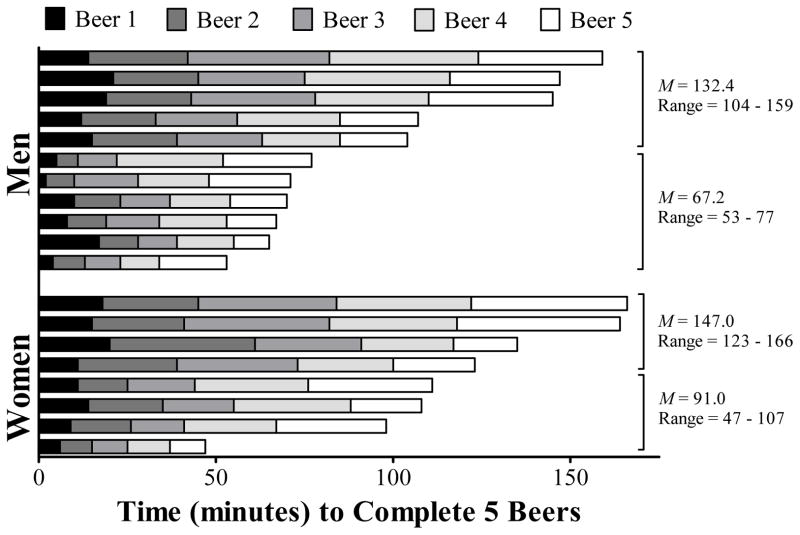
Participants consumed alcohol at widely different rates. The total amount of time it took individuals to consume each beer on the day where 5 beers were consumed is shown in Figure 1. The time to complete all five beers ranged from 47 minutes to 166 minutes; a 3-fold range in drinking rates was observed among both men and women (coefficient of variation = 0.35). Also within each sex, the lower median half drank beers approximately 2 times faster than the upper median half. Thus, a reasonable range of drinking rates was observed by the self-paced drinking procedure (see Table 2 for the minimum, maximum, and quartile times to drink all beers for each of the study days for each sex). Generally, the pattern of a range of drinking times existed for both sexes but tended to increase as a function of the number of beers consumed.
Figure 1.
Variation in participants’ average time to complete five beers, ordered from slowest to quickest. Means and ranges for the quickest and slowest halves are also provided.
Table 2.
Total Minutes Required to Complete Drinking Each Day
| Men (n = 11)
|
Women (n = 8)
|
p | |||||||||
|---|---|---|---|---|---|---|---|---|---|---|---|
| Min | Q1 | Mdn | Q3 | Max | Min | Q1 | Mdn | Q3 | Max | ||
| Day 1 | 3 | 5 | 8 | 13 | 26 | 3 | 6 | 10 | 12 | 13 | .901 |
| Day 2 | 13 | 21 | 30 | 53 | 139 | 12 | 25 | 39 | 51 | 131 | .711 |
| Day 3 | 20 | 34 | 48 | 95 | 126 | 15 | 43 | 53 | 58 | 170 | .934 |
| Day 4 | 36 | 51 | 82 | 99 | 145 | 27 | 67 | 91 | 102 | 168 | .534 |
| Day 5 | 53 | 67 | 77 | 145 | 159 | 47 | 103 | 117 | 150 | 166 | .186 |
Note. Comparisons across distributions were completed using the nonparametric Mann-Whitney U test for independent samples.
Characteristics of Alcohol Consumption as a Function of the Number of Beers Consumed
Participants’ consumption rates varied as a function of the total number of beers consumed. Repeated-measures ANOVA indicated that the total time taken to consume all beers on each day did not differ between men and women [F(1,17) = 0.25, p = 0.63], nor did the average time it took to drink each beer [F(1,17) = 0.12, p = 0.74] when all days were considered. As expected, repeated-measures ANOVA showed that the total time taken to consume all beers each day was significantly different across the five days [F(4,67) = 62.1, p < 0.001] indicating that it took longer to consume more beers which would normally be expected. The average time to complete each beer became progressively shorter as the number of beers increased [F(4,67) = 9.19, p < 0.001]. The interaction between sex and the number of beers consumed was not significant for the rate-related outcomes (p = 0.39 for total time taken to consume all beers, p = 0.75 for average time taken to consume one beer), indicating that individual differences in rate were not related to sex.
Actual Peak BrAC and Peak TAC Levels
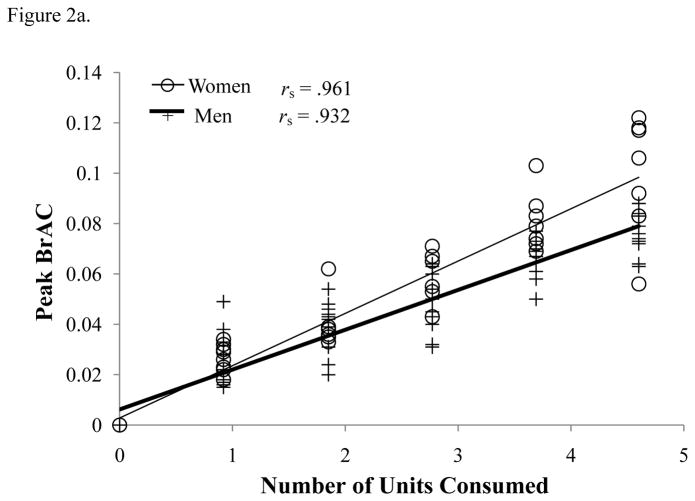
Peak BrAC levels (Figure 2a) showed a significantly positive relationship with the number of beers consumed (F(1,73) = 421.91, p < 0.001); women had a higher slope than men (F(1,73) = 23.89, p < 0.001). Post-hoc contrasts between sexes showed women had higher peak BrAC levels at beer 4 [t(13.239) = 2.976, p= .011] and beer 5 [t(8.271) = 2.788, p= .023], but not at beers 1–3.
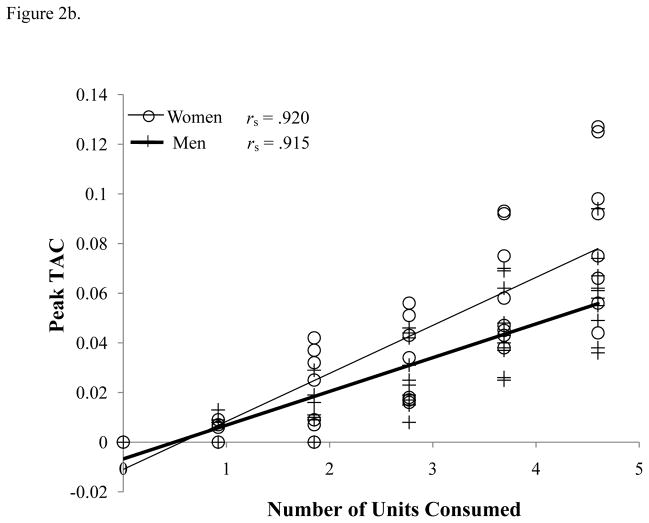
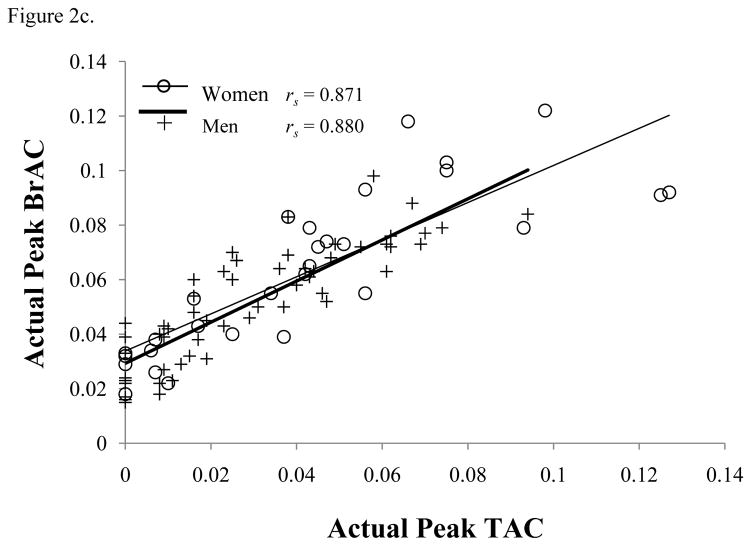
Figure 2.
(a) Actual Peak BrAC (% BAC) and (b) Peak TAC (g/dl) for each number of units of alcohol consumed, and (c) associations between actual peak BrAC (% BAC) and peak TAC (g/dl) levels. All Spearman’s correlations are significant (p < .001).
Peak TAC levels (Figure 2b) also showed a significant positive relationship with the number of beers consumed [F(1,73) = 236.98, p < 0.001]; again, women had a higher slope than men [F(1,73) = 12.22, p = 0.001]. The contrasts of sex at each beer showed marginally significant difference at beer 5 [t(9.844) = 2.175, p = 0.055]. There were a number of cases where individuals had no positive TAC readings on the 1 and 2 beer days, 12 (7 men and 5 women) and 3 (2 men and 1 woman), respectively.
Both sexes showed significant correlations between peak TAC and peak BrAC [F(1,73) = 160.03, p < 0.001], demonstrating that transdermal monitoring significantly correlated with BrAC (see Figure 2c). There were no significant differences in slope between sexes [F(1,73) = 0.35, p = 0.56].
Estimating BrAC and Standardized Units Consumed
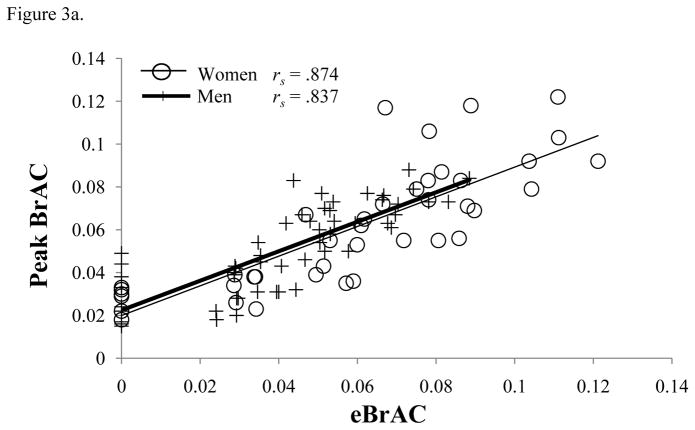
We then applied our previously derived model to calculate eBrAC using the current TAC data. A plot of actual peak BrAC as a function of eBrAC is shown in Figure 3a. In the mixed-effects regression model across all subjects and all days, eBrAC accounts for 70% of the variance in actual peak BrAC (R2 = 0.70) validating its predictive validity in an independent sample. Although eBrAC tended to underestimate the actual peak BrAC at the lower BrAC levels it overestimated the actual peak BrAC at the higher BrAC levels (intercept = 0.02, 95% CI: 0.01 to 0.01, p < .001 for testing intercept = 0; slope = 0.74, 95% CI: 0.66 to 0.83, p < .001 for testing slope = 1). There were no differences in slope between sexes (p = 0.56).
Figure 3.
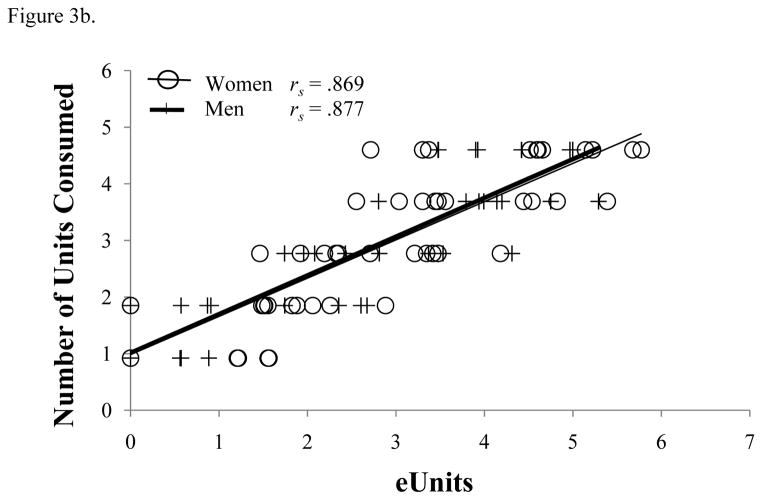
Scatterplot of association between the (a) actual peak BrAC (% BAC) and estimated BrAC (eBrAC) and (b) actual units consumed with the estimated units consumed (eUnits). Data are all values collected from all participants across all drinking days. All Spearman’s correlations are significant (p < .001).
We also tested our previously-derived model to estimate the number of units of alcohol consumed. A plot of actual units consumed verses eUnits is shown in Figure 3b. eUnits explained 79% (R2 = 0.79) of the variance in the actual number of units consumed, although eUnits underestimated the actual units consumed at all drink levels (intercept = 0.76, 95% CI: 0.47 to 1.04, p < .001 for testing intercept = 0; slope = 1.22, 95% CI: 1.12 to 1.33, p < .001 for testing slope = 1). There were no differences in slope between sexes (p = 0.17).
Estimations Were Unaffected by Variation in Rates of Alcohol Consumption
The previous equations to compute eBrAC and eUnits were collected under controlled drinking rates and did not consider natural variation in the rate of alcohol consumption. Therefore, we used mixed effects models to examine: 1) whether the rate of alcohol consumption (measured by the average time it took to drink each beer on each day) provided independent predictive information about actual peak BrAC (or actual standard units of alcohol consumed) after adjusting for the calculated eBrAC (or eUnits); and 2) whether adding the rate of alcohol consumption as an additional predictor explained more variance in actual peak BrAC (or actual standard units of alcohol consumed) than using eBrAC (or eUnits) alone. After adjusting for eBrAC, the rate of alcohol consumption was not independently associated with actual peak BrAC (p = 0.41) and did not improve the goodness-of-fit of the model. Similarly, after adjusting for eUnits, although the rate of consumption was significantly associated with actual standard units of alcohol consumed (p < 0.001), it improved the goodness-of-fit of the model only slightly (R2 was increased by 2%).
DISCUSSION
This study was designed to determine whether self-paced variations in the rate of alcohol consumption affected the ability of our predictive equations to use TAC data to estimate peak BrAC levels and the number of standard drinks consumed. To allow for variations in consumption rates, we used a procedure that allowed participants (n = 11 men and 8 women) to drink alcohol at their own pace. This procedure produced individual variations covering a 3-fold range in the rates of consumption. Both BrAC and TAC increased linearly as a function of the number of standard drink units consumed, as previously reported (Hill-Kapturczak et al., 2014). Despite these variations in drinking rate, we found that inter-individual differences in the rate of alcohol consumption neither affected the ability of our previously-derived equations to estimate peak BrAC (Hill-Kapturczak et al., 2014) or the total number of standard units of alcohol consumed (Dougherty et al., 2014), nor did adding the rate of consumption parameter significantly improve the goodness-of-fit to the model prediction.
The variability observed in drinking patterns was expected and highlights some validity to using our predictive models under more naturalistic conditions where variations in drinking rate do occur. A recent study by Leeman and colleagues (2013), used a self-administration procedure conducted in a drinking establishment and observed wide-ranging individual differences in the quantities of alcohol consumed while others (Bernosky-Smith et al., 2012), have related rates of consumption in self-administration procedures to the amount of drinking and risk-taking behaviors observed in driving simulators. These studies support the idea that individual differences observed in the laboratory may extend to alcohol-related problems in the real world. Thus, we suggest that the data presented herein support the possible utility of the predictive formulas derived from our laboratory to use TAC data as a method to measure the topographical patterns of drinking (e.g., rates, amounts consumed, and peak levels of intoxication) in more naturalistic settings.
Although the current study is novel, there are some limitations. This was a controlled study where participants were required to drink varying numbers of beers in a predetermined sequence during the morning hours. While variations in drinking rates were observed, the controlled environment and timing of alcohol administration may have impacted the pace of consumption and certainly, longer spans of time or larger amounts of alcohol will occur in the natural environment outside the experimental laboratory. Additionally, participants were not allowed to consume food or other beverages during most of the experimental day, which will affect the rate of absorption of alcohol (or perhaps rates of self-administration). Moreover, the current study used a sample of participants who were predominately Caucasian/Hispanic with a body mass index > 18 but <30 kg/m2 and who had no history of psychiatric disturbance, pregnancies, medical conditions, or any substance abuse or dependence. It is important to note that although women and men in the current study did not differ in their reports of pre-experimental drinking amounts, differences in baseline drinking patterns likely would explain at least part of the observed rates of alcohol consumption. Though future studies could examine a larger range of alcohol consumption in a wider population to make these results more generalizable, there are limits to the both the amount of alcohol and variations in rate that are possible in controlled laboratory settings indicating that the natural extension of this work is to move into the outpatient environment where these variables are less constrained. It is also worth noting that similar to our previous study (Hill-Kapturczak et al., 2014), in a substantial percentage of cases (63%) no positive TAC readings occurred after drinking only one beer, and 16% after drinking two beers (with a higher percentage of men failing to achieve a positive TAC reading than women). However, there were positive TAC readings for all participants when three or more beers were consumed. This suggests that while transdermal alcohol monitoring may not be adequate in situations where the goal is to confirm abstinence, it may be more appropriate in cases where research or clinical interventions focus on achieving moderation of drinking.
CONCLUSION
We have completed a series of laboratory studies that proved our ability to use TAC data to estimate clinically relevant parameters, including peak BrAC levels and the total number of standard drink units consumed. Estimations derived from TAC data were accurate when men and women drank: (a) predetermined amounts of alcohol at rates that produced similar BrAC levels (Dougherty et al., 2012); (b) equal numbers of beers at the same pace, yielding sex-related differences in BrAC levels (Hill-Kapturczak et al., in press); and (c) significantly varying individual rates of consumption. Collectively, these studies have laid the groundwork necessary for estimating both peak BrAC and standard number of units consumed, and permit confidence in the ability of our formulas to estimate these parameters in more naturalistic and clinically relevant settings. Our ongoing and planned future studies are focusing on transitioning this technology to such outpatient settings. This approach will be an important advancement because forensically—and in more clinical applications of transdermal alcohol monitoring—outcomes have only been related to exceeding TAC criteria indicating the presence or absence of drinking. Current health guidelines indicate that moderate drinking can occur at a lower risk, defined as up to 3 drinks per day for women but no more than 7 drinks per week, and up to 4 drinks per day for men, no more than 14 drinks per week (NIAAA, 2013). These newly developed procedures will allow us to conduct interventions using these monitors that focus on achieving levels of drinking that fall within these guidelines that are defined by peak BrAC and number of units consumed per week.
Acknowledgments
The authors appreciate the supportive functions performed by our valued colleagues, Cameron Hunt, Krystal Shilling, Phillip Brink, and Norma Ketchum. Research reported in this publication was supported by the National Institute on Alcohol Abuse and Alcoholism of the National Institutes of Health [R01AA14988]. The research was also supported in part by the National Institute of Drug Abuse [T32DA031115] for postdoctoral training for Dr. Lake. The content is solely the responsibility of the authors and does not necessarily represent the official views of the National Institutes of Health. Dr. Dougherty also gratefully acknowledges support from a research endowment, the William and Marguerite Wurzbach Distinguished Professorship.
Footnotes
None of the authors has conflicting interests concerning this manuscript.
References
- Ayala J, Simons K, Kerrigan S. Quantitative determination of caffeine and alcohol in energy drinks and the potential to produce positive transdermal alcohol concentrations in human subjects. J Anal Tox. 2009;33:27–33. doi: 10.1093/jat/33.1.27. [DOI] [PubMed] [Google Scholar]
- Barnett NP, Tidey J, Murphy JG, Swift R, Colby SM. Contingency management for alcohol use reduction: a pilot study using a transdermal alcohol sensor. Drug Alcohol Depend. 2011;118:391–399. doi: 10.1016/j.drugalcdep.2011.04.023. [DOI] [PMC free article] [PubMed] [Google Scholar]
- Bernosky-Smith KA, Aston ER, Liguori A. Rapid drinking is associated with increases in driving-related risk-taking. Human Psychopharmacol. 2012;27:622–625. doi: 10.1002/hup.2260. [DOI] [PMC free article] [PubMed] [Google Scholar]
- Dougherty DM, Charles NE, Acheson A, John S, Furr RM, Hill-Kapturczak N. Comparing the detection of transdermal and breath alcohol concentrations during periods of alcohol consumption ranging from moderate drinking to binge drinking. Exp Clin Psychopharmacol. 2012;20:373–381. doi: 10.1037/a0029021. [DOI] [PMC free article] [PubMed] [Google Scholar]
- Dougherty DM, Hill-Kapturczak N, Liang Y, Karns TE, Lake SL, Cates SE, Roach JD. The potential clinical utility of transdermal alcohol monitoring data to esitmate the number of alcohol drinks consumed. Addict Disord Their Treat. 2014a doi: 10.1097/ADT.0000000000000060. [DOI] [PMC free article] [PubMed] [Google Scholar]
- First MB, Spitzer RL, Givvon M, Williams JBW. Structured Clinical Interview for DSM-IV-TR Axis I Disorders, Research Version, Non-patient Edition (SCID-I/NP) New York: Biometrics Research, New York State Psychiatric Institute; 2001. [Google Scholar]
- Hill-Kapturczak N, Roach JD, Liang Y, Karns TE, Cates SE, Dougherty DM. Accounting for sex-related differences in the estimation of breath alcohol levels using transdermal alcohol monitoring. Psychopharmacol. 2014 doi: 10.1007/s00213-014-3644-9. [DOI] [PMC free article] [PubMed] [Google Scholar]
- Leeman RF, Corbin WR, Nogueira C, Krishnan-Sarin S, Potenza MN, O’Malley SS. A human alcohol self-administration paradigm to model individual differences in impaired control over alcohol use. Exp Clin Psychopharmacol. 2013;21:303–314. doi: 10.1037/a0033438. [DOI] [PMC free article] [PubMed] [Google Scholar]
- Leffingwell TR, Cooney NJ, Murphy JG, Luczak S, Rosen G, Dougherty DM, Barnett NP. Continuous objective monitoring of alcohol use: twenty-first century measurement using transdermal sensors. Alcohol Clin Exp Res. 2013;37:16–22. doi: 10.1111/j.1530-0277.2012.01869.x. [DOI] [PMC free article] [PubMed] [Google Scholar]
- Marques PR. Levels and types of alcohol biomarkers in DUI and clinic samples for estimating workplace alcohol problems. Drug Test Anal. 2012;4:76–82. doi: 10.1002/dta.384. [DOI] [PMC free article] [PubMed] [Google Scholar]
- Marques PR, McKnight AS. Field and laboratory alcohol detection with 2 types of transdermal devices. Alcohol Clin Exp Res. 2009;33:703–711. doi: 10.1111/j.1530-0277.2008.00887.x. [DOI] [PubMed] [Google Scholar]
- Nakagawa S, Schielzeth H. A general and simple method for obtaining R2 from generalized linear mixed-effects models. Meth Ecol Evol. 2013;4:133–142. [Google Scholar]
- NIAAA . [Accessed September 12, 2013];Rethinking drinking. 2010 Available at www.niaaa.nih.gov.
- NIAAA . [Accessed September 12, 2013];Understanding the impact of alcohol on human health and well-being. 2013 Available at www.niaaa.nih.gov.
- Sakai JT, Mikulich-Gilertson SK, Long RJ, Crowley TJ. Validity of transdermal alcohol monitoring: fixed and self-regulated dosing. Alcohol Clin Exp Res. 2006;19:1547–1549. doi: 10.1111/j.1530-0277.2006.00004.x. [DOI] [PubMed] [Google Scholar]
- Swift RM. Transdermal alcohol measurement for estimation of blood alcohol concentration. Alcohol Clin Exp Res. 2000;24:422–423. [PubMed] [Google Scholar]
- Swift RM. Direct measurement of alcohol and its metabolites. Addiction. 2003;98(Suppl 2):73–80. doi: 10.1046/j.1359-6357.2003.00605.x. [DOI] [PubMed] [Google Scholar]
- Swift RM, Martin CS, Swette L, LaConti A, Kackley N. Studies on a wearable, electronic, transdermal alcohol sensor. Alcohol Clin Exp Res. 1992;16:721–725. doi: 10.1111/j.1530-0277.1992.tb00668.x. [DOI] [PubMed] [Google Scholar]


