Abstract
Background
Genetic variation in chemosensory genes can explain variability in individual’s perception of and preference for many foods and beverages. To gain insight into variable preference and intake of alcoholic beverages, we explored individual variability in the responses to sampled ethanol. In humans, ethanol elicits sweet, bitter and burning sensations. Here, we explore the relationship between variation in ethanol sensations and polymorphisms in genes encoding bitter taste receptors (TAS2Rs) and a polymodal nociceptor (TRPV1).
Methods
Caucasian participants (n=93) were genotyped for 16 SNPs in TRPV1, 3 SNPs in TAS2R38 and 1 SNP in TAS2R13. Participants rated sampled ethanol on a generalized Labeled Magnitude Scale. Two stimuli were presented: a 16% ethanol whole mouth sip-and-spit solution with a single time-point rating of overall intensity, and a cotton swab saturated with 50% ethanol on the circumvallate papillae (CV) with repeated ratings made over 3 minutes. Area under the curve (AUC) was calculated for the time-intensity data.
Results
The ethanol whole mouth solution had overall intensity ratings near ‘very strong’. Burning/stinging had the highest mean AUC values, followed by bitterness and sweetness. Whole mouth intensity ratings were significantly associated with burning/stinging and bitterness AUC values on the CV. Three TRPV1 SNPs (rs224547, rs4780521, rs161364) were associated with ethanol sensations on the CV, with two (rs224547 and rs4780521) exhibiting strong linkage disequilibrium. Additionally, the TAS2R38 SNPs rs713598, rs1726866, and rs10246939 formed a haplotype, and were associated with bitterness on the CV. Lastly, overall intensity for whole mouth ethanol associated with the TAS2R13 SNP rs1015443.
Conclusions
These data suggest genetic variations in TRPV1 and TAS2Rs influence sensations from sampled ethanol and may potentially influence how individuals initially respond to alcoholic beverages.
Keywords: bitterness, burn, ethanol, taste phenotype, TRPV1
Introduction
Taste strongly influences food intake (Glanz et al., 1998, IFIC, 2011), including alcohol consumption (Barber and Grichting, 1987, Moore and Weiss, 1995). Ethanol activates olfactory, taste and chemesthetic receptors, and each modality is carried centrally by different nerves; these inputs individually and jointly affect the percept evoked by ethanol. Ethanol reportedly elicits sweet and bitter sensations in humans (Mattes and DiMeglio, 2001) and in mice (Blizard, 2007). Sour and salty sensations have also been reported, but with much lower intensities than bitter or sweet (Mattes and DiMeglio, 2001). Ethanol also activates sweet taste fibers in non-human primates (Hellekant et al., 1997) and rodents (Lemon et al., 2004). Regarding alcohol behaviors, individual differences in bitterness and sweetness are predictors of alcohol liking and intake in young adults (Lanier et al., 2005).
Multiple studies have linked variation in TAS2R bitter receptor genes to alcohol intake. Duffy and colleagues reported TAS2R38 haplotypes are associated with alcoholic intake, with AVI homozygotes (who perceive less bitterness from the bitter compound propylthiouracil) consuming significantly more alcoholic beverages than heterozygotes or PAV homozygotes (Duffy et al., 2004a), a finding which was subsequently replicated in a separate cohort (Hayes et al., 2011). In a high-risk familial cohort (COGA), Wang and colleagues found the same haplotype associated with maximum number of drinks ever consumed within a 24-hour period in African-Americans (Wang et al., 2007). More recently, Dotson et al (2012) reported associations between TAS2R38 and TAS2R13 polymorphisms and alcohol intakes derived from the Alcohol Use Disorders Identification Test (AUDIT) in head and neck cancer patients. These differences in intake are presumably driven by differences in perceived intensity that lead to lower liking (Hayes et al., 2013b, Duffy et al., 2009, Duffy, 2007). However, this interpretation is complicated by previous reports where TAS2R38 haplotypes fail to explain variation in sensations from ethanol (Duffy et al., 2004a) or blended whisky (Hayes et al., 2011). Mattes and DiMeglio (2001) observed variable ethanol thresholds and suprathreshold ratings of ethanol across individuals, but these differences did not associate with phenylthiocarbamide detection thresholds (another taste phenotype commonly associated with TAS2R38 genotype) (Kim et al., 2003). This suggests ethanol may differentially activate bitter receptors beyond TAS2R38, consistent with other data (Dotson et al., 2012, Hinrichs et al., 2006). Of the handful of human TAS2Rs previously reported to contain functional SNPs, only three (TAS2R13, TAS2R16, and TAS2R38) have been implicated with regard to alcohol intake or dependence in prior literature (Dotson et al., 2012, Hinrichs et al., 2006, Duffy et al., 2004a). Due to an extremely low minor allele frequency, the relevant SNP in TAS2R16 is largely irrelevant in European-Americans, so we confined our analyses here to putatively functional variants in TAS2R38 and TAS2R13.
In addition to bitter and sweet sensations, ethanol also causes irritation commonly described as burning or stinging (Green, 1987, Green, 1988). Burning sensations in the mouth are due, in part, to activation of the transient receptor potential vanilloid receptor 1 (TRPV1). TRPV1 (formerly VR1) is activated by noxious heat, capsaicin (Tominaga et al., 1998, Caterina et al., 1999) and ethanol (Trevisani et al., 2002), even at relatively low concentrations (0.1–3% v/v). TRPV1 is a multimodal nociceptor activated by chemical and thermal stimuli, resulting in a substance P dependent signal cascade that eventually culminates in sensations described as burning. In rodent derived tissue culture, the release of substance P increases with increasing concentrations of ethanol (Trevisani et al., 2002). When the trpv1 gene is knocked out in mice, knockouts have a higher preference for ethanol and consume more ethanol than wild-type mice (Blednov and Harris, 2009). Collectively, these data suggest the TRPV1 receptor likely plays a roll in the perception and acceptability of ethanol.
The objectives of the present study were to determine if polymorphisms in a) TRPV1 associate with the perception of ethanol, specifically ethanol burn, and polymorphisms in b) TAS2R38, and c) TAS2R13 may explain differences in bitterness of ethanol. Previously, ethanol intensity has been shown to associate with propylthiouracil tasting (Duffy et al., 2004a, Bartoshuk et al., 1993, Prescott and Swain-Campbell, 2000), but due to multiple sensations elicited from ethanol, we anticipated that measuring bitter and burning sensations separately would help elucidate the influence of both bitter taste receptors and heat/pain receptors on alcohol sensations, and potentially intake.
2. Materials and Methods
2.1 Overview
This study consisted of four sessions, each scheduled at least one week apart. All sessions (~1 hour each) were completed one-on-one in our laboratory with a member of the research team. During the first session, informed consent was obtained and participants were given a brief explanation of the study aims: to quantify the influence of specific genes on the sensations from capsaicin, piperine and ethanol. Measures of alcohol use, misuse or abuse were not collected, and no special emphasis was given to alcohol related behaviors. Ethanol was not tasted in the first session; the stimuli presented in session 1 have been reported elsewhere (Allen et al., 2013, Byrnes and Hayes, 2013), and are not described here for brevity. Upon completing session 1, participants were screened to determine if they were eligible to participate in sessions 2, 3 and 4. Eligibility for sessions 2–4 was based on visibility of the individual’s circumvallate papillae and the ability to tolerate stimulation with a wetted swab without gagging. Of participants who qualified, 130 individuals returned to complete all four sessions.
2.2 Participants
Participants, 18 to 45 years old, were recruited from the Pennsylvania State University campus and surrounding area. Those interested in participating completed an online survey to determine if they met inclusion criteria. Qualifications include: not pregnant or breastfeeding, non-smoker, no tongue, cheek or lip piercings, no known smell or taste defect, no hyperactive thyroid, no history of chronic pain, and willingness to provide a salivary DNA sample. Of the participants who completed sessions 2–4 (total n=130), the majority reported European ancestry (n=93), with 18 reporting Asian ancestry and 2 reporting African ancestry; 17 individuals declined to provide ancestry. Due to potential differences in allele frequencies across ancestry and the possibility of population stratification, all of the results here are restricted to individuals of European ancestry, resulting in a cohort of 58 women and 35 men with a mean age of 25 (±0.69 SEM) years.
2.3 Psychophysical Scaling of Test stimuli
A generalized Labeled Magnitude Scale (gLMS) was used to collect psychophysical ratings for stimuli (Hayes et al., 2013a, Snyder et al., 2004). This scale ranges from 0 to 100 and asks participants to rate the intensity they experience relative to the ‘strongest imaginable sensation of any kind’ (100). Adjective labels on the scale include: no sensation, barely detectable, weak, moderate, strong, and very strong, located at 0, 1.4, 6, 17, 35, and 51 respectively. This scale is believed to enhance the validity of comparisons across individuals, as compared to visual analog scales (Bartoshuk et al., 2003, Bartoshuk et al., 2004).
In sessions 2–4, participants were given instructions, identical to those provided during session 1, reorienting them to the scale. This included explanation of the top anchor, ‘strongest imaginable sensation of any kind’, as well as reminding participants that they should click anywhere along the scale and to not let whether or not they like/dislike the sample to influence their intensity ratings. Before rating any sampled stimuli, participants completed a warm-up session where they rated 15 remembered sensations using a gLMS (e.g. (Hayes et al., 2013a)).
2.4 Test Stimuli and Protocol
Following orientation, sessions 2–4 began by presenting 5 stimuli (sucrose, citric acid, NaCl, MSG/IMP, and quinine) on 4 quadrants of the tongue (right and left tip, right and left CV) in a rotating fashion. Samples were presented in a blocked counterbalanced order, with all 5 stimuli being presented each day for a total of 20 samples (each of the 5 tastants in each of the 4 quadrants). After 10 applications, the participant took a break and performed a different task. All five tastants were presented before the same stimulus was presented again.
Participants completed a multiple attribute time intensity (MATI) task for a single irritant after the 10 spatial stimuli described above. Each day consisted of a different irritant, with the irritant remaining constant throughout the session. The irritants presented in this study consisted of ethanol, piperine, and capsaicin; only ethanol results will be discussed here. A 50% v/v ethanol stimulus was presented to the posterior tongue by touching two saturated ‘buddy-taped’ cotton swab applicators on either their left or right CV for 10 seconds. Intensity ratings were collected every 30 seconds for a total of 3 minutes. Intensity ratings for six qualities were collected (sweetness, bitterness, sourness, burning/stinging, umami/savory and saltiness); the order of the attributes was fixed. Participants were asked to keep their tongue away from the roof of their mouth for the entire 3 minutes and to keep their lips closed to minimize evaporative cooling. Participants were not allowed to rinse for the 3-minute duration. Following the MATI task, there was a four-minute break where participants were allowed to rinse with mouth temperature reverse osmosis (RO) water. Following the first MATI task, 10 additional spatial stimuli were applied, and then the second MATI task was completed for the CV papillae on the opposite side. Next, Best Estimated Thresholds (BETs) were collected using the three alternative forced choice (3-AFC) method described in ASTM E-679; these data are not reported here, as detection thresholds do not predict ingestive behavior (Lucas et al., 2011, Duffy et al., 2004b). The final task within the session involved swishing a 15mL sample of 16% v/v ethanol in the mouth for 5 seconds. Upon spitting out the sample, the participant rated the ‘overall intensity’ on a gLMS.
The single time point spatial data for the prototypical tastants serve as a negative control here; analysis of a superset of the present data (from (Feeney and Hayes, 2014)) indicate the means for the side tastes/sensations for each tastant were extremely low. For example, mean bitterness for sucrose, citric acid and sodium chloride were 0.3, 3.0, 2.2, respectively. Similarly, mean burning/stinging were 0.35, 1.08, and 0.80. In contrast, means for the expected qualities of each (e.g. sourness for citric acid) were all 13 or higher (just below ‘moderate’ on a gLMS). While the single point rating is slightly different than the MATI ratings for irritants in terms of participant demand, it suggests participants successfully distinguished between the various qualities in the rating task.
For a complete description of all of the phenotyping methods across sessions, please refer to the supplemental material.
2.6 Genetic Analysis
DNA was collected using Oragene salivary collection kits per manufacturer instructions (Genotek Inc, Ontario, Canada). To maximize coverage of TRPV1 (chr 17) variation, a tag SNP approach was used with tag SNPs identified in HapMap using the CEU reference population: rs4790521, rs4790522, rs224547, rs4790151, rs161364, rs8065080, rs150908, rs224534, rs222747, rs150846, rs161386, rs222749, rs7217945, rs161381, rs17707155, and rs222741). Additionally, bitter taste receptors SNPs in TAS2R13 (chr 12; rs1015443) and TAS2R38 (chr 7; rs713598, rs1726866, and rs10246939) were chosen based on previous literature. Genotypes were determined using Sequenom MassARRAY technology (Sequenom, San Diego, CA). Primers were purchased from Integrated DNA Technologies (Coralville, Iowa, USA). Genotypes were automatically assigned via MassARRAY software (Sequenom). Two technicians independently inspected all genotypes and 15% of samples were rerun to ensure reliability.
2.7 Statistical Analysis
Data were analyzed using SAS 9.2 (Cary, NC). For MATI data, area-under-the-curve (AUC) was calculated as a summary measure. To test AUC values for individual SNPs, analysis of variance (ANOVA) was performed via proc mixed, and posthoc comparisons were made via the Tukey-Kramer method. For SNPs that showed significant associations with AUC ratings, repeated measures ANOVAs were conducted for bitter and burning/stinging ratings using time as a repeated factor via proc mixed. If the SNP-by-time interaction was significant, means for the two most extreme groups at each time point were compared using unadjusted t-tests via the LSMEANS option.
Haploview (Barrett et al., 2005) was used to examine the extent of linkage disequilibrium (LD) between each SNP. Haplotype blocks were defined according to Solid Spine of LD criteria (Barrett et al., 2005). LD plots show rounded R-squared values in individual squares.
3. Results
On the posterior tongue (i.e. on the circumvallate papillae), burning/stinging was the predominant quality for the swab saturated with 50% v/v ethanol, followed by bitterness and sweetness. Means were taken from the ratings for the left and right circumvallate papillae, and the AUC across time was calculated for each participant. Burning/stinging AUCs and bitter AUCs were positively correlated (R2=11%; p=0.0013). Sweetness and burning/stinging AUCs were significantly correlated (R2=6.0%; p=0.0183); however sweetness AUCs were not significantly correlated with bitter AUC (p=0.2). For the whole mouth sip and spit procedure using 16% v/v ethanol in water, overall intensity means fell near ‘very strong’ on the gLMS (47.0±2.1 SEM). Whole mouth ratings of ‘overall intensity’ for 16% ethanol were also associated with both bitterness and burning/stinging AUCs from 50% ethanol swabs on the CV (R2= 4.8%; p=0.034 and R2= 4.5%; p=0.042, respectively).
Figure 1 shows the linkage disequilibrium (LD) for the TRPV1 SNPs. R2 values were reported and haplotypes were generated using Solid Spine of LD criteria (Barrett et al., 2005). Overall, 6 haplotypes were generated showing strong LD between neighboring SNPs, with the exception of rs150908, rs150846, and rs222741, all of which are located within the intronic region. Of the 16 TRPV1 SNPs included in the genetic analysis (shown in figure 1), 3 SNPs exhibited a minor allele frequency (MAF) below 0.25 in our cohort: rs222741, rs161381 and rs222749. As these genotypes had too few participants to perform meaningful statistical analysis due to low sample number in the minor allele group, they were excluded from further analysis. The SNPs used in the present analysis are outlined in Table 1.
Figure 1.
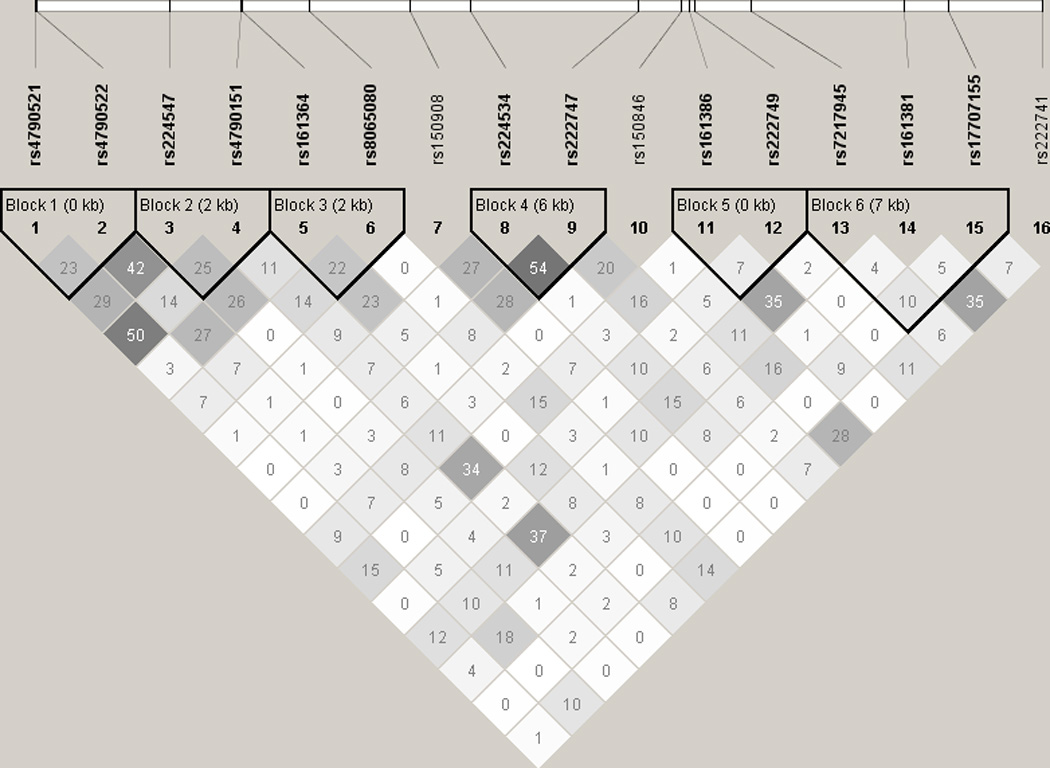
LD plot (r2) for 16 TRPV1 SNPs from 93 participants of European Ancestry. Darker grey indicates higher r2 values.
Table 1.
List of TRPV1 SNPs included in the analysis. P values are generated via ANOVA. The reported p values are unadjusted.
| Reported p-values | ||||||||||
|---|---|---|---|---|---|---|---|---|---|---|
| AUC ratings: | ||||||||||
| Receptor | chr. | SNP ID | call rate | HWE p-value |
maj/min allele |
MAF | SNP location |
EtOH WM |
Burn | Bitter |
| TRPV1 | 17 | rs4790521 | 97.9% | 0.71 | T/C | 0.37 | 3' UTR | 0.35 | 0.19 | 0.0033 |
| TRPV1 | 17 | rs4790522 | 98.9% | 0.95 | C/A | 0.42 | 3' UTR | 0.12 | 0.79 | 0.50 |
| TRPV1 | 17 | rs224547 | 98.9% | 0.57 | A/G | 0.43 | Intronic | 0.07 | 0.054 | 0.0044 |
| TRPV1 | 17 | rs4790151 | 98.9% | 1.0 | G/A | 0.3 | Intronic | 0.16 | 0.84 | 0.35 |
| TRPV1 | 17 | rs161364 | 98.9% | 0.39 | C/T | 0.3 | Intronic | 0.63 | 0.0021 | 0.30 |
| TRPV1 | 17 | rs8065080 | 96.8% | 0.96 | T/C | 0.37 | Ile585Val | 0.17 | 0.70 | 0.43 |
| TRPV1 | 17 | rs150908 | 95.7% | 0.07 | G/A | 0.35 | Intronic | 0.80 | 0.53 | 0.33 |
| TRPV1 | 17 | rs224534 | 98.9% | 0.56 | G/A | 0.37 | Thr469Ile | 0.17 | 0.94 | 0.49 |
| TRPV1 | 17 | rs222747 | 96.8% | 0.56 | C/G | 0.28 | Met315Ile | 0.48 | 0.78 | 0.74 |
| TRPV1 | 17 | rs150846 | 96.8% | 1.0 | C/T | 0.39 | Intronic | 0.22 | 0.86 | 0.55 |
| TRPV1 | 17 | rs161386 | 98.9% | 0.59 | C/T | 0.38 | Intronic | 0.88 | 0.62 | 0.23 |
| TRPV1 | 17 | rs7217945 | 98.9% | 0.28 | G/A | 0.28 | Intronic | 0.83 | 0.06 | 0.27 |
| TRPV1 | 17 | rs17707155 | 98.9% | 0.58 | C/T | 0.26 | Intronic | 0.78 | 0.91 | 0.39 |
| TAS2R13 | 12 | rs1015443 | 98.5% | 0.28 | C/T | 0.35 | Ser259Asn | 0.04 | 0.98 | 0.36 |
| TAS2R38 | 7 | rs713598 | 98.4% | 0.37 | G/C | 0.49 | Ala49Pro | 0.32 | 0.87 | 0.0048 |
| TAS2R38 | 7 | rs1726866 | 97.7% | 0.53 | C/T | 0.50 | Val262Ala | 0.86 | 0.57 | 0.21 |
| TAS2R38 | 7 | rs10246939 | 98.5% | 0.73 | C/T | 0.48 | Ile296Val | 0.87 | 0.68 | 0.055 |
MAF, minor allele frequency; HWE, Hardy-Weinberg equilibrium; EtOH WM, ethanol whole mouth sample 16%v/v.
Exploratory Genotype-Phenotype associations based on AUC scores over time
An intronic TRPV1 SNP rs224547 (chr. 17) was associated with the summary AUC scores for both bitterness and burning/stinging from 50% v/v ethanol applied to the circumvallate papillae. Burning/stinging AUC scores were associated with rs224547 genotype (F(89,2)=3.02; p=0.0539). The AA homozygotes (n=32) had the greatest mean AUC with 936.68 (±132.70 SEM) compared to the AG heterozygotes (n=40) who had the smallest mean area of 505.03 (±118.69) with the GG homozygotes (n=20) having a mean area of 772.69 (±167.86). Bitterness AUC scores were also significant for rs224547 (F(89,2)=5.76; p=0.0044) and in the same direction as burning/stinging values, with the AA homozygotes having the highest mean area. The AA homozygotes reported the greatest mean area, 687.54(±108.92), with the heterozygotes having a mean of 256.22(±97.42). The GG homozygotes had the smallest area for bitterness: 186.75(±137.77).
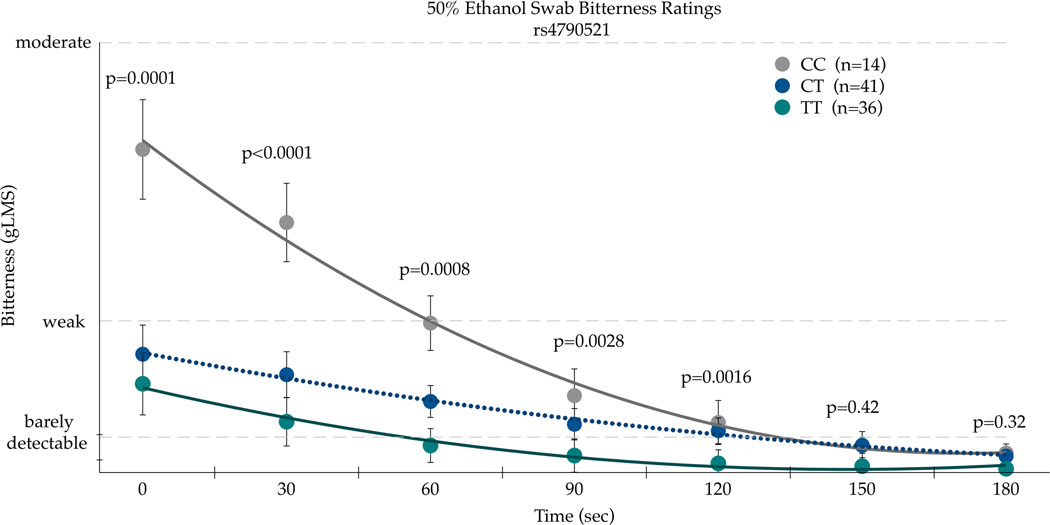
A second TRPV1 SNP, rs4790521, was also a significant predictor of bitterness AUC ratings of 50% v/v ethanol on the circumvallate papillae (F(88,2)=6.09; p=0.0033). This finding is not surprising as rs4790521 is in strong linkage disequilibrium with rs224547, as shown in Figure 1. The CC homozygotes (n=14) had the highest mean area for bitterness: 860.09(±164.70). The CT homozygotes (n=41) had a mean area of 419.45(±96.25), with the TT homozygotes (n=36) with the lowest mean area of 185.73(±102.71).
A third TRPV1 SNP, rs161364, also associated with the AUC burning/stinging ratings for 50% v/v ethanol on the circumvallate papillae (F(89,2)=6.61; p=0.0021). The TT homozygotes (n=7) had a mean area of 1528.93(±273.59), which was significantly greater (p=0.001) than the CT heterozygotes (n=37), who had a mean area of 476.55(±119.00). The CC (n=48) homozygotes had a mean area of 746.95(±104.48), which was significantly lower than the TT homozygotes (p=0.03); the CC homozygotes did not differ from the CT heterozygotes (746.95 versus 476.55; p=0.15).
TRPV1 SNPs associate with the perception of ethanol
Two SNPs that were significant for the summary AUC estimate across time for the 50% v/v ethanol swab (rs224547 and rs4790521) were analyzed further to explore effects across time; bitterness and burning/stinging at each time point (0,30,60,90,120,150 and 180 seconds) were tested via repeated measures ANOVA. The third significant TRPV1 SNP, rs161364, was not analyzed further across time due to due to low frequency of the TT homozygotes (n=7).
In repeated measures ANOVA on the bitterness ratings, the time by SNP interaction was significant for the TRPV1 rs4790521 SNP [F(12,528)=3.51, p<0.001], as shown in Figure 2a. In the first two minutes after application (i.e. at 0, 30, 60, 90, and 120 seconds), bitterness ratings were significantly different across rs4790521 genotype, with the TT homozygotes giving significantly higher ratings than the CC homozygotes. However, as bitterness decayed after 120 seconds, genotype no longer associated with bitterness, presumably due to floor effects. In repeated measures ANOVA on the burning/stinging ratings, we observed significant main effects for SNP [F(2,88)=5.36, p=0.0064)], and time [F(6,528)=25.71, p<0.0001); the time by SNP interaction for the rs4790521 SNP was not significant [F(12,528)=0.53; p=0.89]. Nonetheless, the pattern was similar to the bitter results as the TT homozygotes tended to report the lowest sensations.
Figure 2.
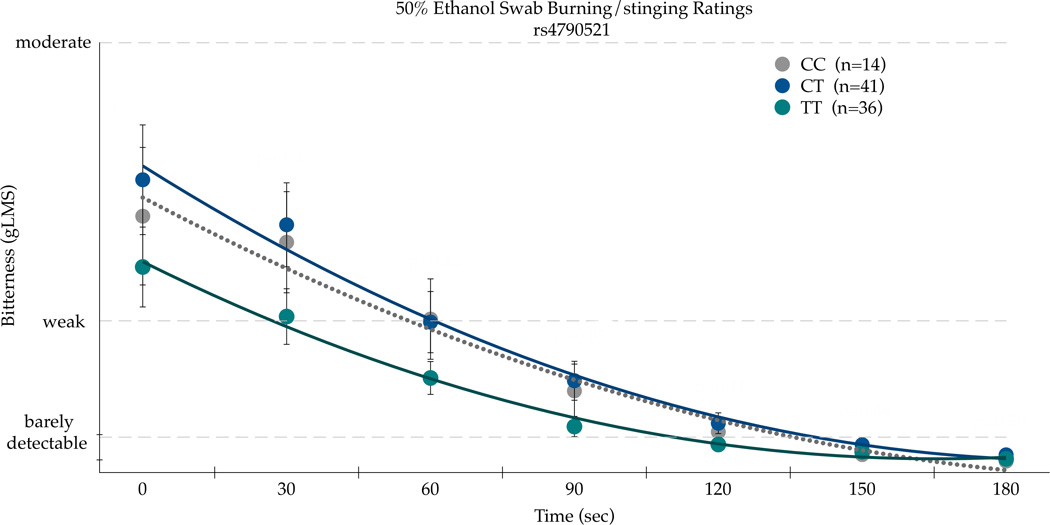
Bitterness (a) and Burning/Stinging (b) from 50 % ethanol applied to the posterior tongue differs by the TRPV1 SNP rs4790521 SNP in repeated measures ANOVA (see text for details). Points are arithmetic means with bars showing the standard error of the mean. P-values indicate unadjusted t-tests at each time point comparing the two groups of homozygotes to decompose the significant time by SNP interaction.
The second significant SNP in the AUC analysis for bitterness and burn, rs224547, was subsequently analyzed across time. In repeated measures ANOVA for bitterness, there was a main effect of SNP [F(2,89)=21.40, p<0.0001] and time [F(6,534)=13.33; p<0.0001], but the influence of the rs224547 SNP did not differ over time [F(12,534)=0.13, p=0.99]. As shown in Figure 3a, the AA homozygotes consistently reported more bitterness than the GG homozygotes. In repeated measures ANOVA on the burning/stinging ratings (Figure 3b), there was a main effect of the rs224547 SNP [F(2,89)=9.10; p=0.0003] and time [F(6,534)=31.14; p<0.0001], but the influence of this SNP did not differ over time, as the interaction was not significant [F(12,534)=0.83, p=0.62].
Figure 3.
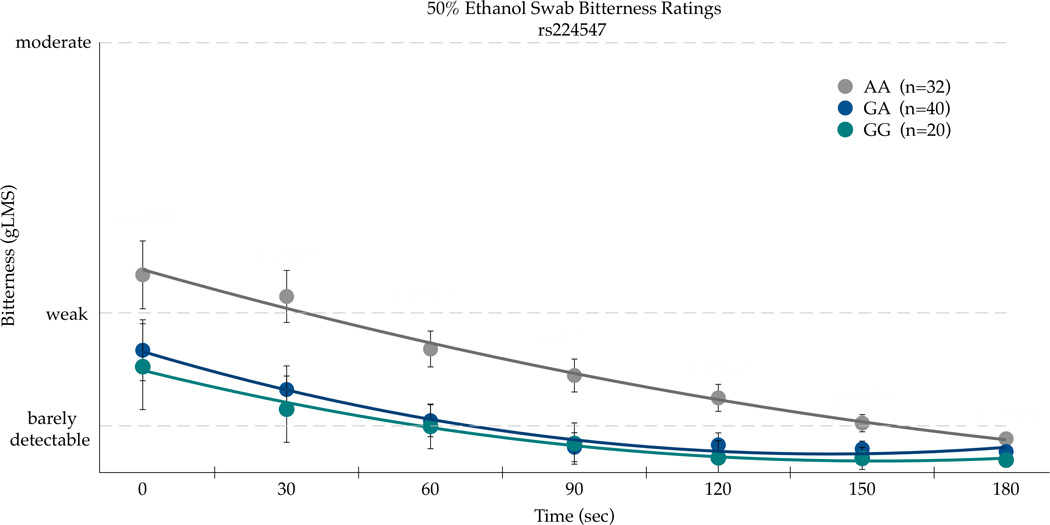
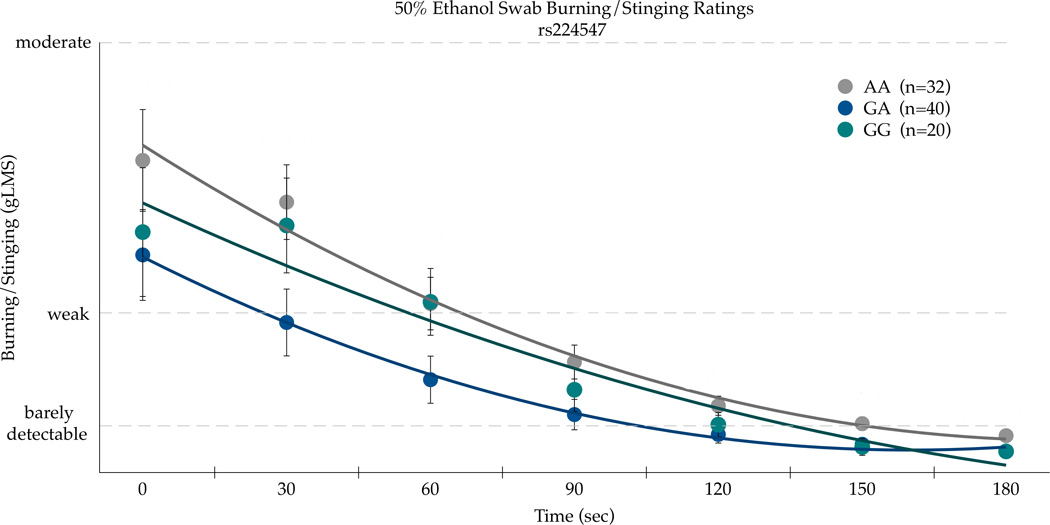
Bitterness (a) and Burning/Stinging (b) from 50% ethanol on the posterior tongue differ by the rs224547 SNP in TRPV1 in repeated measures ANOVA (see text for details). Points are arithmetic means with bars showing the standard error of the mean.
In contrast to the time course data on the posterior tongue, none of the TRPV1 SNPs tested explained differences in ‘overall intensity’ ratings of a whole mouth sip and spit solution of 16% v/v ethanol.
TAS2R SNPs associate with the perception of ethanol
Three SNPs in TAS2R38 (chr. 7, rs713598, rs1726866, and rs10246939, resulting in A49P, V262A, and I296V, respectively) were explored for their association with ethanol bitterness. There was a significant association with A49P (rs713598) with AUC bitterness values for the 50% ethanol swab on the CV [F(2,89)=3.13;p=0.048]. The Pro49Pro homozygotes (n=18) reported the most bitterness (717.9±149.2); heterozygotes (n=49) and the Ala49Ala homozygotes (n=24) had similar mean areas (240.5±90.4 and 255.2±126.6, respectively). The second SNP Val262Ala (rs1726866) was not associated (p=0.21) with bitterness AUC, whereas the third SNP Ile296Val (rs10246939) was associated with bitterness AUC [F(2,89)=3.00;p=0.0549]. The Val296Val homozygotes (n=19) had the greatest bitterness AUC (696.1±145.4), followed by the heterozygotes (n=50) (345.7±89.6), while the Ile296Ile homozygotes (n=23) reported the least bitterness (238.04±132.2). Accordingly, these three SNPs were chosen for further analysis to explore associations between genotype and mean bitterness on the CV over time (Figure 4).
Figure 4.
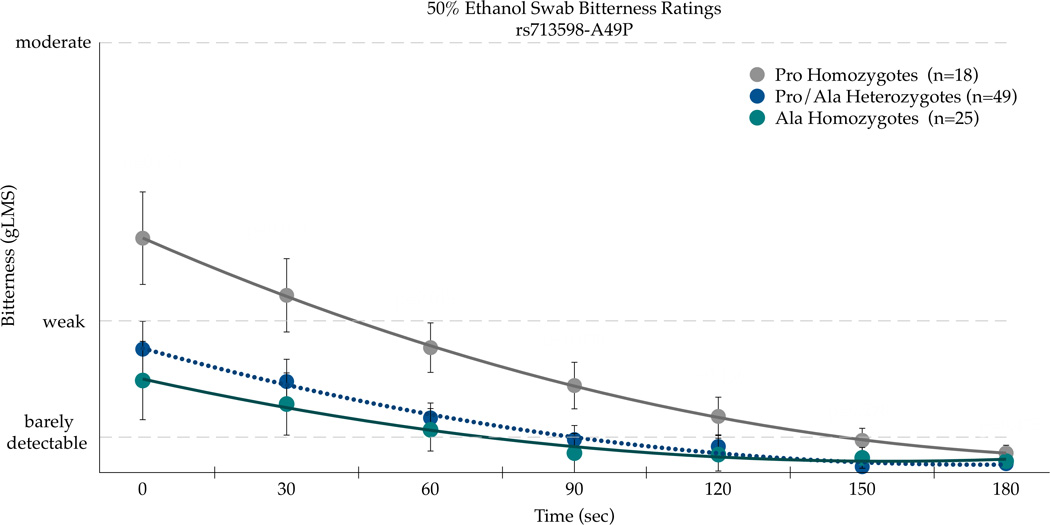
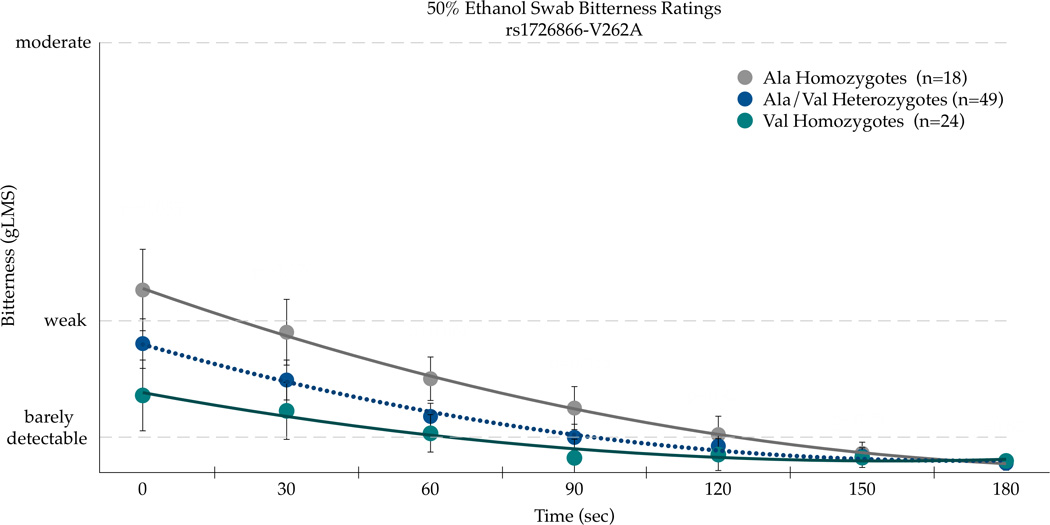
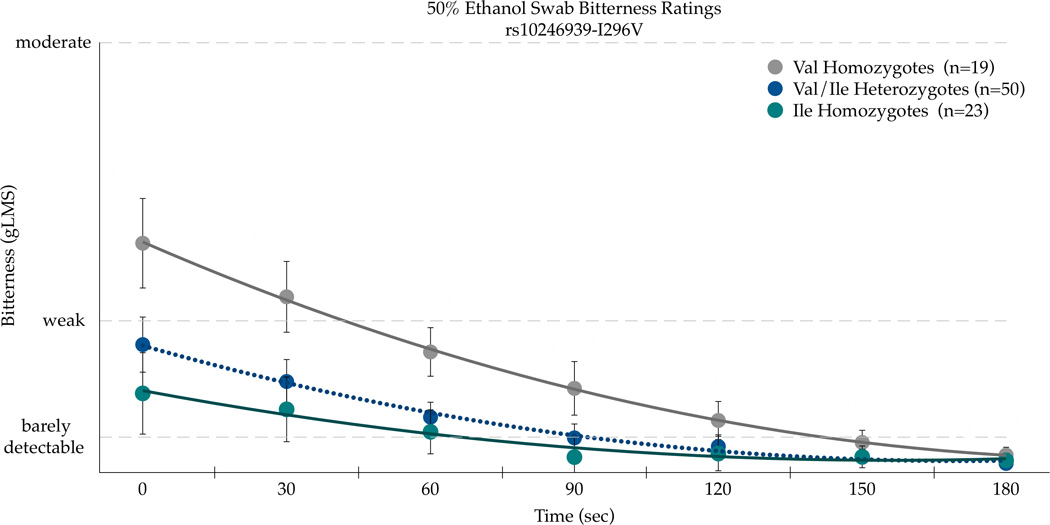
Bitterness from 50 % ethanol applied to the posterior tongue differs by the TAS2R38 SNPs rs713598 (a), rs1726866 (b), and rs10246939 (c) in repeated measures ANOVAs (see text for details). Points are arithmetic means with bars showing the standard error of the mean.
Repeated measures ANOVA indicated the main effects of Ala49Pro genotype [F(2,89)=13.40, p<0.0001] and time [F(6,534)=14.84, p<0.0001] were associated with bitterness, although the SNP effect did not vary across time as the time by SNP interaction was not significant [F(12,534)=1.0, p=0.44]. As shown in Figure 4a, the Pro49 homozygotes experienced greater bitterness than Ala49 homozygotes. A similar pattern was observed for Val262Ala (Figure 4b), with significant main effects of genotype [F(2,88)=6.50, p=0.0023] and time (F(5,528)=14.12, p<0.0001) for bitterness. The time by genotype interaction was not significant for Val262Ala [F(12,528)=0.76, p=0.69], indicating the effect of genotype did not change over time. As shown in Figure 4b, the Ala262 homozygotes reported more bitterness. The Ile296Val SNP in TAS2R38 showed a similar pattern as the Ala49Pro and Val262Ala SNPs; the main effects of genotype [F(2,89)=12.96, p<0.0001] and time [F(6,534)=14.07, p<0.0001] were significant for bitterness, and the effect of genotype did not differ over time [F(12,534)=1.13, p=0.34]. As shown in Figure 4c, the Val296 homozygotes reported more bitterness than the Ile296 homozygotes. In summary, the consistency across these three SNPs is to be expected due to high linkage disequilibrium (Kim et al., 2003). However, due to the novel association with ethanol sensations described here, we report each separately as prior site directed mutagenesis studies that indicate the relative importance of each site for propylthiouracil may not generalize to ethanol.
In contrast to the time course data, these same three SNPs (rs713598, rs1726866, and rs10246939, resulting in A49P, V262A, and I296V) were not associated with the ‘overall intensity’ ratings of whole mouth 16% ethanol (p=0.32; p=0.86; and p=0.87, respectfully).
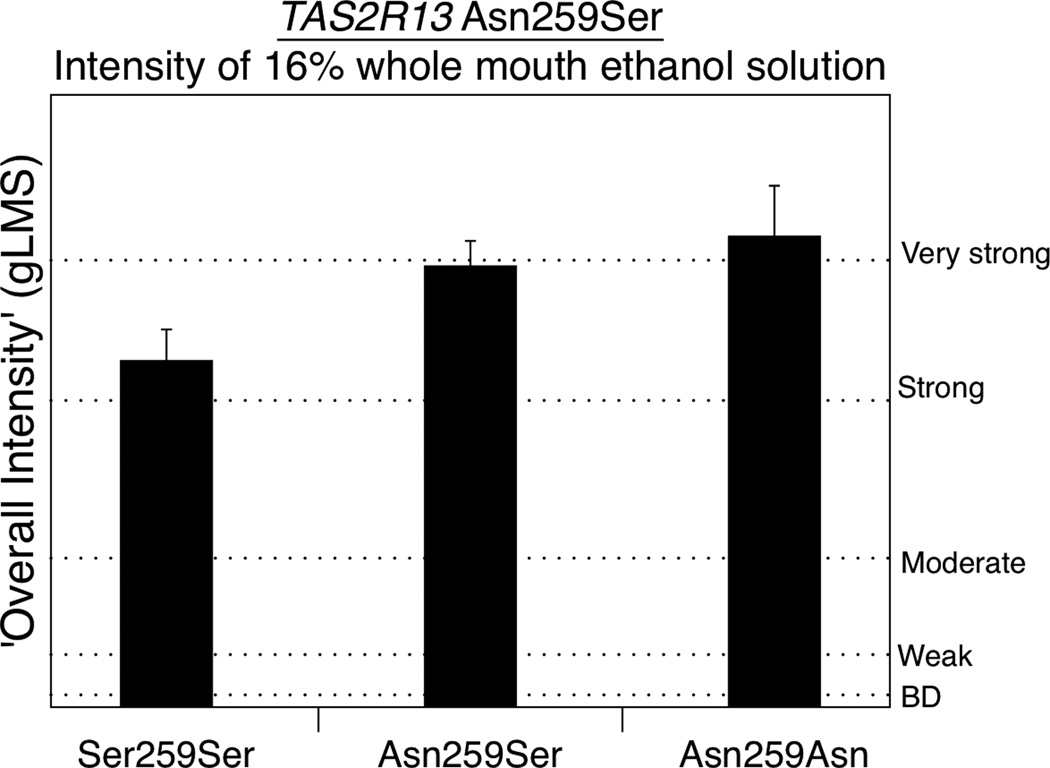
Finally, Asn259Ser (rs1015443), a SNP in the bitter taste receptor TAS2R13 (chr. 12) previously implicated with regard to alcohol intake (Dotson et al., 2012) was significantly associated with ‘overall intensity’ ratings of whole mouth 16% ethanol (F(2,89)=3.31;p=0.041). The Asn homozygotes (n=12) reported having the highest mean ratings 52.7(±5.8), with the heterozygotes (n=49) rating 50.3(±2.9) and the Ser homozygotes (n=31) reporting the least intensity 39.5(±3.6). Although AUC ratings for bitterness and burning/stinging were not significant (Table 1), we performed a repeated measures ANOVA for the MATI data due to significant associations between Asn259Ser and whole mouth intensity ratings. There were significant main effect of genotype [F(2,89)=4.05, p=0.021] and time [F(6,534)=11.16, p<0.0001] for bitterness; however, the interaction of time and SNP was not significant [F(12,534)=0.4, p=0.96] (not shown).
4. Discussion
In our cohort, burning/stinging was reported to be the predominate sensation for a 50% ethanol solution applied to the circumvallate papillae, followed by bitterness and sweetness. Summary measures of burning/stinging across time (AUC values) were significantly correlated with summary measures of bitterness across time. Additionally ‘overall intensity’ ratings of a whole mouth 16% ethanol solution at a single time point were significantly associated with summary measures of burning/stinging and bitterness over time. Collectively, this suggests those who experience more burn from ethanol also experience more bitterness.
Due to ethanol activating TRPV1 in vitro (Trevisani et al., 2002), there is reason to believe that polymorphisms in TRPV1 might alter the perceived burn from ethanol if the SNPs are functional. The TRP box, a 6-mer region located near the channel gate (C terminus domain) found in all TRP channels, has shown to be key in TRPV1 function (Valente et al., 2008, García-Sanz et al., 2007, Gaudet, 2010). This same finding has been shown for TRPM8 for activation from menthol (Bandell et al., 2006). Mutations within the TRP box in TRPV1 eliminate response to 1uM capsaicin in vitro (Valente et al., 2008). Valente and colleagues (2008) hypothesize reduced activation is due to maintaining the gate in a closed state. TRPV1 SNPs rs4790521 and rs224547 exhibit strong LD and surround the TRP box. These two SNPs may be in LD with polymorphisms within the TRP box.
Differences in the burning/stinging of ethanol associated with the TRPV1 SNP rs224547, with AA homozygotes experiencing greater burning/stinging compared to GG homozygotes. However, we did not expect this SNP to associate with bitterness, as was also observed here. Moreover, the TRPV1 SNP rs4790521 was also found to be associated with bitter AUC ratings, with CC homozygotes reporting significantly more bitterness within the first minute of the CV being exposed to 50% ethanol. While unexpected, previous reports suggest that bitter and burn sensations are perceptually similar, even though they are thought to be transduced through separate pathways. Lim and Green (2007) reported bitterness from quinine was more similar to the burn from capsaicin than the other prototypical tastes (sour, salty and sweet), suggesting that these two sensations are similar, serving as part of a ‘chemofensor complex’ (Green, 2012). Other evidence shows the prototypical burning stimulus capsaicin evokes bitterness in some individuals (Green and Hayes, 2004, Lawless and Stevens, 1984, Green and Schullery, 2003). Additionally, non-nutritive sweeteners activate TRPV1 in vitro (Riera, 2007, Riera et al., 2008) and are often described as bitter by humans (e.g. (Allen et al., 2013)). Collectively, these data might suggest a simple labeled line receptor-percept hypothesis may be overly reductionist, as burn and bitterness may not be as independent as previously believed. However, this explanation is complicated by the weak phenotypic association observed between burning and stinging, and bitterness in our phenotypic data. Alternatively, we cannot rule out that the genotype-phenotype associations observed here could potentially be an artifact caused by the fixed order of the scales (Green et al., 2010, Bennett et al., 2012), semantic confusion between attributes (Bennett et al., 2012), affective dumping, or some combination thereof. That is, participants always rated sweetness, followed by bitterness and sourness before burning/stinging, which may bias participants toward dumping aversive sensations into the first aversive attribute available to them (bitterness versus burning). Additional work is needed to clarify the relationship between TRPV1 and aversive sensations. Nonetheless, present data suggest that sensations from sampled ethanol vary as a function of genetics, consistent with the idea that variation in chemosensory genes can influence ingestive behavior (Hayes et al., 2013b).
These findings suggest that individuals with AA genotype for SNP rs224547 and/or CC genotype for rs4790521 may potentially associate with reduced alcoholic consumption if they perceive greater bitterness and/or burn from alcohol, which would be expected to deter consumption of alcoholic beverages, at least initially before dependence and reward related associations develop. Present results should be considered provisional until replicated, and additional work testing whether these SNPs associate with alcohol use is warranted.
The TRPV1 SNP rs161364 was significantly associated with burning AUC ratings. The C allele carriers (CC and CT) did not differ from each other, but the TT homozygotes were different from both groups of C allele carries. This suggests the C allele may be associated with decreased function. However, due to the low frequency of TT individuals, we caution that this finding needs to be replicated to determine the possible functionality of this SNP.
Variations in bitter taste receptor genes have been shown to explain reported bitterness from a wide range of compounds and foods (reviewed by (Hayes et al., 2013b)). Here, we report the perceived bitterness from 50% ethanol on the posterior tongue was significantly associated with the TAS2R38 SNPs rs713598 (A49P), rs172866 (Val262A) and rs10246939 (I296V). This is not surprising, as bitter sensations have been reported previously from ethanol (e.g. (Scinska et al., 2000, Mattes and DiMeglio, 2001)), and alcoholic beverages (e.g. (Lanier et al., 2005)). Previous work exploring relationships between taste perception and PROP phenotype reported that individuals who perceived propylthiouracil (PROP) as being more bitter also reported greater irritation for ethanol solutions than individuals who reported no bitterness from PROP (Bartoshuk et al., 1993). Since 2003, it has been widely accepted that the perception of PROP is largely explained by three SNPs in TAS2R38 (Duffy et al., 2004a, Meyerhof et al., 2010, Hayes et al., 2008, Bufe et al., 2005) as they exhibit strong linkage disequilibrium (Kim et al., 2003). Polymorphism in TAS2R38 are associated with food intake via differential sensations (see (Feeney, 2011, Duffy et al., 2010) and polymorphisms in other TAS2Rs have also associated with differences in the sensations from foods and beverages. For example TAS2R19 variation associates with the bitterness of quinine, while SNPs in TAS2R9 and TAS2R31 associate with the bitterness from acesulfame K. Accordingly, it should not be surprising that the bitterness of ethanol associates with variation in TAS2R genes that encode bitter taste receptors.
Previously, SNPs in another bitter receptor gene, TAS2R13, were found to associate with alcohol intake frequency in a cohort of head and neck cancer patients. Dotson and colleagues (Dotson et al., 2012) reported that rs1015443 CC homozyogtes reported greater frequency of drinking days, drinks per drinking day, and heavy episodic drinking. Here, we provide evidence the same SNP associates with the overall intensity of whole mouth ethanol, with the CC homozygotes reporting lower ratings than heterozygotes or TT homozygotes.
5. Limitations and conclusions
Previous work associates SNPs in TAS2R13 and TAS2R38 with alcohol intake, and it is assumed differential intake results from differences in sensation. Here, we provide the first evidence ethanol sensations differ with these TAS2R polymorphisms. However, one must also keep in mind the differences between ethanol and alcoholic beverages, as our participants did not sample alcoholic beverages, only ethanol diluted with water. Spirits, beer and wine contain sensory active compounds beyond just ethanol, and these compounds may suppress bitterness (via perceptual masking) or add additional bitterness (e.g. hops). For the whole mouth 16% ethanol solution used here, only ‘overall intensity’ ratings were collected, so we cannot distinguish between separate percepts like burning and bitterness when regions beyond the circumvallate, like the palate or anterior tongue, are stimulated. Also, this stimulus was delivered via a sip and spit method, so involvement of the pharynx was minimal. Genetic association studies are by definition quasi-experimental (since one cannot randomly assign to genotype); therefore associations may reflect the impact of unmeasured third variables (genetic or otherwise). While limiting the study to Caucasians reduces the threat of population stratification, it does not completely control for this possibility. The novel results reported here should be considered provisional until such a time as they may be replicated in a larger sample. Nonetheless, present data suggest a relationship between sensations from ethanol and genetic variation in TAS2Rs and possibly TRPV1.
Supplementary Material
Figure 5.
Ratings of ‘overall intensity’ from a 16% whole mouth sip and spit ethanol solution differs by the rs1015443 SNP in TAS2R13 in one-way ANOVA. Bars are arithmetic means ±standard error of the mean.
Acknowledgments
The authors thank Emma Feeney, Nadia Byrnes, and Meghan Kane for assisting in psychophysical data collection, and Samantha Bennett for assistance with protocol development. We also thank our participants for their time and participation.
Funding
Supported by National Institutes of Health grants from the National Institute National of Deafness and Communication Disorders to JEH [DC01904] and the National Center for Research Resources to JEM [RR023457], and Shared equipment grants (ShEEP) from the Medical Research Service of the Department of Veteran Affairs to JEM. ALA was also supported by the National Center for Advancing Translational Sciences via UL1 [TR000127] and TL1 [TR000125] grants. The views expressed in this article are those of the authors and do not necessarily reflect the position or policy of the Department of Veterans Affairs.
Footnotes
Conflict of interest
The authors have no conflict of interest to declare.
References
- Allen AL, McGeary JE, Knopik VS, Hayes JE. Bitterness of the Non-nutritive Sweetener Acesulfame Potassium Varies With Polymorphisms in TAS2R9 and TAS2R31. Chemical Senses. 2013;38:379–389. doi: 10.1093/chemse/bjt017. [DOI] [PMC free article] [PubMed] [Google Scholar]
- Bandell M, Dubin AE, Petrus MJ, Orth A, Mathur J, Hwang SW, Patapoutian A. High-throughput random mutagenesis screen reveals TRPM8 residues specifically required for activation by menthol. Nature neuroscience. 2006;9:493–500. doi: 10.1038/nn1665. [DOI] [PubMed] [Google Scholar]
- Barber JG, Grichting WL. The assessment of drug attitudes among university students using the short form of the drug attitude scale. Substance Use & Misuse. 1987;22:1033–1039. doi: 10.3109/10826088709109696. [DOI] [PubMed] [Google Scholar]
- Barrett J, Fry B, Maller J, Daly M. Haploview: analysis and visualization of LD and haplotype maps. Bioinformatics. 2005;21:263–265. doi: 10.1093/bioinformatics/bth457. [DOI] [PubMed] [Google Scholar]
- Bartoshuk LM, Conner E, Grubin D, Karrer T, Kochenbach K, Palcso M, Al E. PROP supertasters and the perception of ethyl alcohol. Chemical senses. 1993;18:526–527. [Google Scholar]
- Bartoshuk LM, Duffy VB, Fast K, Green BG, Prutkin J, Snyder DJ. Labeled scales (eg, category, Likert, VAS) and invalid across-group comparisons: what we have learned from genetic variation in taste. Food Quality and Preference. 2003;14:125–138. [Google Scholar]
- Bartoshuk LM, Duffy VB, Green BG, Hoffman HJ, Ko CW, Lucchina LA, Marks LE, Snyder DJ, Weiffenbach JM. Valid across-group comparisons with labeled scales: the gLMS versus magnitude matching. Physiology & Behavior. 2004;82:109–114. doi: 10.1016/j.physbeh.2004.02.033. [DOI] [PubMed] [Google Scholar]
- Bennett SM, Zhou L, Hayes JE. Using Milk Fat to Reduce the Irritation and Bitter Taste of Ibuprofen. Chemosensory Perception. 2012:1–6. doi: 10.1007/s12078-012-9128-6. [DOI] [PMC free article] [PubMed] [Google Scholar]
- Blednov Y, Harris R. Deletion of vanilloid receptor (TRPV1) in mice alters behavioral effects of ethanol. Neuropharmacology. 2009;56:814–820. doi: 10.1016/j.neuropharm.2009.01.007. [DOI] [PMC free article] [PubMed] [Google Scholar]
- Blizard DA. Sweet and bitter taste of ethanol in C57BL/6J and DBA2/J mouse strains. Behavior genetics. 2007;37:146–159. doi: 10.1007/s10519-006-9121-4. [DOI] [PubMed] [Google Scholar]
- Bufe B, Breslin PA, Kuhn C, Reed DR, Tharp CD, Slack JP, Kim UK, Drayna D, Meyerhof W. The molecular basis of individual differences in phenylthiocarbamide and propylthiouracil bitterness perception. Current Biology. 2005;15:322–327. doi: 10.1016/j.cub.2005.01.047. [DOI] [PMC free article] [PubMed] [Google Scholar]
- Byrnes NK, Hayes JE. Personality factors predict spicy food liking and intake. Food Quality and Preference. 2013;28:213–221. doi: 10.1016/j.foodqual.2012.09.008. [DOI] [PMC free article] [PubMed] [Google Scholar]
- Caterina MJ, Rosen TA, Tominaga M, Brake AJ, Julius D. A capsaicin-receptor homologue with a high threshold for noxious heat. Nature. 1999;398:436–441. doi: 10.1038/18906. [DOI] [PubMed] [Google Scholar]
- Dotson CD, Wallace MR, Bartoshuk LM, Logan HL. Variation in the Gene TAS2R13 is Associated with Differences in Alcohol Consumption in Patients with Head and Neck Cancer. Chemical senses. 2012;37:737–744. doi: 10.1093/chemse/bjs063. [DOI] [PMC free article] [PubMed] [Google Scholar]
- Duffy VB. Variation in oral sensation: implications for diet and health. Current opinion in gastroenterology. 2007;23:171–177. doi: 10.1097/MOG.0b013e3280147d50. [DOI] [PubMed] [Google Scholar]
- Duffy VB, Davidson AC, Kidd JR, Kidd KK, Speed WC, Pakstis AJ, Reed DR, Snyder DJ, Bartoshuk LM. Bitter Receptor Gene (TAS2R38), 6-n-Propylthiouracil (PROP) Bitterness and Alcohol Intake. Alcoholism: Clinical and Experimental Research. 2004a;28:1629–1637. doi: 10.1097/01.ALC.0000145789.55183.D4. [DOI] [PMC free article] [PubMed] [Google Scholar]
- Duffy VB, Hayes JE, Davidson AC, Kidd JR, Kidd KK, Bartoshuk LM. Vegetable intake in college-aged adults is explained by oral sensory phenotypes and TAS2R38 genotype. Chemosensory perception. 2010:1–12. doi: 10.1007/s12078-010-9079-8. [DOI] [PMC free article] [PubMed] [Google Scholar]
- Duffy VB, Hayes JE, Sullivan BS, Faghri P. Surveying Food and Beverage Liking. Annals of the New York Academy of Sciences. 2009;1170:558–568. doi: 10.1111/j.1749-6632.2009.04593.x. [DOI] [PubMed] [Google Scholar]
- Duffy VB, Peterson JM, Bartoshuk LM. Associations between taste genetics, oral sensation and alcohol intake. Physiology & behavior. 2004b;82:435–445. doi: 10.1016/j.physbeh.2004.04.060. [DOI] [PubMed] [Google Scholar]
- Feeney E. The impact of bitter perception and genotypic variation of TAS2R38 on food choice. Nutrition Bulletin. 2011;36:20–33. [Google Scholar]
- Feeney EL, Hayes JE. Exploring associations between taste perception, oral anatomy and polymorphisms in the carbonic anhydrase (gustin) gene CA6. Physiology & Behavior. 2014;128:148–154. doi: 10.1016/j.physbeh.2014.02.013. [DOI] [PMC free article] [PubMed] [Google Scholar]
- García-Sanz N, Valente P, Gomis A, Fernández-Carvajal A, Fernández-Ballester G, Viana F, Belmonte C, Ferrer-Montiel A. A role of the transient receptor potential domain of vanilloid receptor I in channel gating. The Journal of neuroscience. 2007;27:11641–11650. doi: 10.1523/JNEUROSCI.2457-07.2007. [DOI] [PMC free article] [PubMed] [Google Scholar]
- Gaudet R. Structural Insights into the Function of TRP Channels. In: Liedtke W, editor. TRP ion channel function in sensory transduction and cellular signaling cascades. CRC Press; 2010. [Google Scholar]
- Glanz K, Basil M, Maibach E, Goldberg J, Snyder D. Why Americans Eat What They Do: Taste, Nutrition, Cost, Convenience, and Weight Control Concerns as Influences on Food Consumption. Journal of the American Dietetic Association. 1998;98:1118–1126. doi: 10.1016/S0002-8223(98)00260-0. [DOI] [PubMed] [Google Scholar]
- Green Spatial and temporal factors in the perception of ehtanol irritation on the tongue. 1988 doi: 10.3758/bf03208702. [DOI] [PubMed] [Google Scholar]
- Green BG. The sensitivity of the tongue to ethanol. Annals of the New York Academy of Sciences. 1987;510:315–317. [Google Scholar]
- Green BG. Chemesthesis and the chemical senses as components of a “chemofensor complex”. Chemical senses. 2012;37:201–206. doi: 10.1093/chemse/bjr119. [DOI] [PMC free article] [PubMed] [Google Scholar]
- Green BG, Hayes JE. Individual Differences in Perception of Bitterness from Capsaicin, Piperine and Zingerone. Chemical Senses. 2004;29:53–60. doi: 10.1093/chemse/bjh005. [DOI] [PubMed] [Google Scholar]
- Green BG, Lim J, Osterhoff F, Blacher K, Nachtigal D. Taste mixture interactions: surpression, additivity, and the predominance of sweetnenss. Physiology & Behavior. 2010;101:731–737. doi: 10.1016/j.physbeh.2010.08.013. [DOI] [PMC free article] [PubMed] [Google Scholar]
- Green BG, Schullery MT. Stimulation of bitterness by capsaicin and menthol: differences between lingual areas innervated by the glossopharyngeal and chorda tympani nerves. Chemical senses. 2003;28:45. doi: 10.1093/chemse/28.1.45. [DOI] [PubMed] [Google Scholar]
- Hayes JE, Allen AL, Bennett SM. Direct comparison of the generalized Visual Analog Scale (gVAS) and general Labeled Magnitude Scale (gLMS) Food Quality and Preference. 2013a;28:36–44. doi: 10.1016/j.foodqual.2012.07.012. [DOI] [PMC free article] [PubMed] [Google Scholar]
- Hayes JE, Bartoshuk LM, Kidd JR, Duffy VB. Supertasting and PROP Bitterness Depends on More Than the TAS2R38 Gene. Chemical Senses. 2008;33:255–265. doi: 10.1093/chemse/bjm084. [DOI] [PubMed] [Google Scholar]
- Hayes JE, Feeney EL, Allen AL. Do polymorphisms in chemosensory genes matter for human ingestive behavior? Food Quality and Preference. 2013b;30:202–216. doi: 10.1016/j.foodqual.2013.05.013. [DOI] [PMC free article] [PubMed] [Google Scholar]
- Hayes JE, Wallace MR, Knopik VS, Herbstman DM, Bartoshuk LM, Duffy VB. Allelic variation in TAS2R bitter receptor genes associates with variation in sensations from and ingestive behaviors toward common bitter beverages in adults. Chemical Senses. 2011;36:311–319. doi: 10.1093/chemse/bjq132. [DOI] [PMC free article] [PubMed] [Google Scholar]
- Hellekant G, Danilova V, Roberts T, Ninomiya Y. The taste of ethanol in a primate model: I. Chorda tympani nerve response in Macaca mulatta. Alcohol. 1997;14:473–484. doi: 10.1016/s0741-8329(96)00215-7. [DOI] [PubMed] [Google Scholar]
- Hinrichs AL, Wang JC, Bufe B, Kwon JM, Budde J, Allen R, Bertelsen S, Evans W, Dick D, Rice J. Functional Variant in a Bitter-Taste Receptor (hTAS2R16) Influences Risk of Alcohol Dependence. The American Journal of Human Genetics. 2006;78:103–111. doi: 10.1086/499253. [DOI] [PMC free article] [PubMed] [Google Scholar]
- IFIC. Food & Health Survey. International Food Information Council Foundation; 2011. Consumer Attitudes Toward Food Safety, Nutrition & Health. [Google Scholar]
- Kim U, Jorgenson E, Coon H, Leppert M, Risch N, Drayna D. Positional cloning of the human quantitative trait locus underlying taste sensitivity to phenylthiocarbamide. Science's STKE. 2003;299:1221. doi: 10.1126/science.1080190. [DOI] [PubMed] [Google Scholar]
- Lanier SA, Hayes JE, Duffy VB. Sweet and bitter tastes of alcoholic beverages mediate alcohol intake in of-age undergraduates. Physiology & behavior. 2005;83:821–831. doi: 10.1016/j.physbeh.2004.10.004. [DOI] [PubMed] [Google Scholar]
- Lawless H, Stevens DA. Effects of oral chemical irritation on taste. Physiology & behavior. 1984;32:995–998. doi: 10.1016/0031-9384(84)90291-9. [DOI] [PubMed] [Google Scholar]
- Lemon CH, Brasser SM, Smith DV. Alcohol activates a sucrose-responsive gustatory neural pathway. Journal of neurophysiology. 2004;92:536–544. doi: 10.1152/jn.00097.2004. [DOI] [PubMed] [Google Scholar]
- Lim J, Green BG. The psychophysical relationship between bitter taste and burning sensation: evidence of qualitative similarity. Chemical senses. 2007;32:31–39. doi: 10.1093/chemse/bjl033. [DOI] [PubMed] [Google Scholar]
- Lucas L, Riddell L, Liem G, Whitelock S, Keast R. The influence of sodium on liking and consumption of salty food. Journal of food science. 2011;76:S72–S76. doi: 10.1111/j.1750-3841.2010.01939.x. [DOI] [PubMed] [Google Scholar]
- Mattes RD, Dimeglio D. Ethanol perception and ingestion. Physiology & behavior. 2001;72:217–229. doi: 10.1016/s0031-9384(00)00397-8. [DOI] [PubMed] [Google Scholar]
- Meyerhof W, Batram C, Kuhn C, Brockhoff A, Chudoba E, Bufe B, Appendino G, Behrens M. The molecular receptive ranges of human TAS2R bitter taste receptors. Chemical Senses. 2010;35:157–170. doi: 10.1093/chemse/bjp092. [DOI] [PubMed] [Google Scholar]
- Moore M, Weiss S. Reasons for non-drinking among Israeli adolescents of four religions. Drug and alcohol dependence. 1995;38:45–50. doi: 10.1016/0376-8716(95)01104-7. [DOI] [PubMed] [Google Scholar]
- Prescott J, Swain-Campbell N. Responses to repeated oral irritation by capsaicin, cinnamaldehyde and ethanol in PROP tasters and non-tasters. Chemical senses. 2000;25:239. doi: 10.1093/chemse/25.3.239. [DOI] [PubMed] [Google Scholar]
- Riera C. Artificial sweeteners and salts producing a metallic taste sensation activate TRPV1 receptors. 2007 doi: 10.1152/ajpregu.00286.2007. [DOI] [PubMed] [Google Scholar]
- Riera CE, Vogel H, Simon SA, Damak S, Le Coutre J. The capsaicin receptor participates in artificial sweetener aversion. Biochemical and Biophysical Research Communications. 2008;376:653–657. doi: 10.1016/j.bbrc.2008.09.029. [DOI] [PubMed] [Google Scholar]
- Scinska A, Koros E, Habrat B, Kukwa A, Kostowski W, Bienkowski P. Bitter and sweet components of ethanol taste in humans. Drug and alcohol dependence. 2000;60:199–206. doi: 10.1016/s0376-8716(99)00149-0. [DOI] [PubMed] [Google Scholar]
- Snyder D, Fast K, Bartoshuk LM. Valid comparisons of suprathreshold sensations. Journal of consciousness studies. 2004;11:7–8. [Google Scholar]
- Tominaga M, Caterina MJ, Malmberg AB, Rosen TA, Gilbert H, Skinner K, Raumann BE, Basbaum AI, Julius D. The cloned capsaicin receptor integrates multiple pain-producing stimuli. Neuron. 1998;21:531–543. doi: 10.1016/s0896-6273(00)80564-4. [DOI] [PubMed] [Google Scholar]
- Trevisani M, Smart D, Gunthorpe MJ, Tognetto M, Barbieri M, Campi B, Amadesi S, Gray J, Jerman JC, Brough SJ. Ethanol elicits and potentiates nociceptor responses via the vanilloid receptor-1. Nature neuroscience. 2002;5:546–551. doi: 10.1038/nn0602-852. [DOI] [PubMed] [Google Scholar]
- Valente P, García-Sanz N, Gomis A, Fernández-Carvajal A, Fernández-Ballester G, Viana F, Belmonte C, Ferrer-Montiel A. Identification of molecular determinants of channel gating in the transient receptor potential box of vanilloid receptor I. The FASEB Journal. 2008;22:3298–3309. doi: 10.1096/fj.08-107425. [DOI] [PubMed] [Google Scholar]
- Wang JC, Hinrichs AL, Bertelsen S, Stock H, Budde JP, Dick DM, Bucholz KK, Rice J, Saccone N, Edenberg HJ. Functional Variants in TAS2R38 and TAS2R16 Influence Alcohol Consumption in High-Risk Families of African-American Origin. Alcoholism: Clinical and Experimental Research. 2007;31:209–215. doi: 10.1111/j.1530-0277.2006.00297.x. [DOI] [PubMed] [Google Scholar]
Associated Data
This section collects any data citations, data availability statements, or supplementary materials included in this article.


