Abstract
Background
Blood transfusion is an established therapeutic practice. The characteristics of blood components at different storage times are expected to affect the efficacy of transfusion therapy. Metabolic profiling by nuclear magnetic resonance (NMR) spectroscopy requires little or no sample treatment and allows identification of more than 50 soluble metabolites in a single experiment. The aim of this study was to assess the metabolic behaviour of red blood cells during 42 days of storage in blood bank conditions.
Materials and methods
Red blood cells (RBC), collected from eight healthy male donors, aged 25–50 years, were prepared as prestorage leukoreduced erythrocyte concentrates and stored under standard blood bank conditions. Samples taken at various storage times were separated in two fractions: the supernatant, recovered after centrifugation, and the red blood cell lysate obtained after protein depletion by ultrafiltration. The metabolic profile of the red blood cells was determined from analysis of 1H-NMR spectra.
Results
The red blood cell supernatant was studied to track the consumption of the preservative additives and to detect and quantify up to 30 metabolites excreted by the erythrocytes. The NMR spectra of the RBC lysate provided complementary information on some biochemical pathways and set the basis for building a time-dependent red blood cell metabolic profile.
Discussion
We proved the analytical power of 1H-NMR spectroscopy to study red blood cell metabolism under blood bank conditions. A potential biomarker able to provide information on the level of cellular oxidative stress protection was identified. Our data support the hypothesis that a more detailed knowledge of metabolic modifications during storage opens the way to the development of new and more effective protocols for red blood cell conservation and patient-oriented transfusion therapy.
Keywords: metabolic profile, NMR, RBC storage, GSH, 5-oxoproline
Introduction
Blood transfusion is among the oldest and commonly used therapies in medical practice. It is, therefore, of paramount importance that a blood bank can offer an average estimate of the quality of blood components in stock and also provide information on a specific erythrocyte concentrate unit on demand.
Despite numerous biochemical studies investigating red blood cell (RBC) metabolic modifications associated with the cells’ viability and, therefore, effectiveness, e.g. increase of free haemoglobin, creatine, and potassium, decrease of pH, glutathione (GSH), ATP and 2,3-diphosphoglycerate1–4, the measurement of specific biochemical parameters is so far considered of ambiguous physiological significance5. Indeed, for decades, RBC quality has been associated with the cells’ effectiveness and with the morphological changes (storage lesion) that the cells undergo during storage, from a smooth discoid shape to a phenotype characterized by various membrane protrusions (echinocyte) and finally to a spheroid-shaped cell (spheroechinocyte)6,7, being considered reliable indicators of loss of RBC efficacy.
Clinical studies have highlighted a correlation between the transfusion of blood stored for more than 14 days and an increase in hospital permanence, postoperative infections, prolonged mechanical ventilation, multiple organ failure and mortality8–13. To understand the origin of these events, some “-omics” methodologies have started to flank medical practice with increasing frequency14: proteomics15–17 and metabolomics18,19 are the most promising of these methodologies.
Analysis of the metabolome20 is a qualitative and quantitative assessment of low molecular weight compounds (below 1.5 kDa) that originated from metabolic pathways and are present in the body fluids, tissues and cells. Metabolic profiling of biological fluids can be carried out by nuclear magnetic resonance (NMR) spectroscopy21–23 and mass spectrometry19,24. NMR measurements require little or no sample treatment and allow more than 50 metabolites present in the cells’ cytoplasm or in biological fluids to be identified in a single measurement25. The first study on blood ageing in blood bank conditions, based on NMR measurements, was carried out by Messana and coworkers26 and focused on glucose uptake during storage.
To obtain a comprehensive view of the evolution of RBC viability during storage we identified and quantitatively followed a larger number of metabolite released by RBC in the suspension medium and present inside the cells.
Here we report a protocol based on the use of 1H-NMR spectroscopy to follow the metabolic pattern of leucodepleted erythrocytes during 42 days of storage in blood bank conditions.
Materials and methods
Donors: ethical aspects
This study was approved by the Arcispedale Santa Maria Nuova Ethics Committee on January 21, 2013. Informed consent was obtained from all volunteers donors who participated in this study according to the declaration of Helsinki. Blood components were collected from eight periodic donors at the Transfusion Medicine Unit of Reggio Emilia, Italy. These donors were healthy males aged 25–50 years, in accordance with the Italian National Blood Centre Guidelines.
Blood collection
Eight whole blood units (450 mL±10%) were collected into quadruple bags, containing citrate, phosphate, dextrose (CPD) solution, using the top-and-bottom system (Fresenius Kabi Medicare, Bad Homburg, Germany) and prepared as pre-storage leucodepleted erythrocyte concentrates.
Briefly, after centrifugation most of the plasma and buffy coat was removed using a Compomat G4 separator (Fresenius Kabi Medicare) and the filtered RBC were stored in 100 mL of saline, adenine, glucose and mannitol (SAGM) additive solution. An aliquot of 3 mL was taken from each bag of leucoreduced erythrocyte concentrate in order to determine the cell count, haematocrit and total haemoglobin (Sapphire instrument, Abbott Diagnostic, IL, USA and Cytomix FC 500 Beckman Coulter IL, Indianapolis, IN, USA). In accordance with the Italian National Blood System regulatory law, it was acceptable that a few white blood cells and platelets were present in the final leucoreduced red blood cell concentrate. After 24 hours each unit of pre-storage leukoreduced erythrocytes was divided into seven satellites bags of 40 mL each (Fresenius Kabi Medicare). The satellite bags were stored for up to 6 weeks under standard conditions (2–6 °C) and analysed at different storage times (2, 9, 16, 23, 30, 36 and 42 days).
Supernatant preparation
The suspension medium and RBC were separated by centrifugation at 2,000×g for 10 minutes. The supernatant was then divided into two aliquots: one used for biochemical investigations and the other was frozen at −80 °C for subsequent 1H-NMR analysis.
Supernatant biochemical assays
Na+ and K+ were measured by an indirect ion-selective electrode method (Hoffmann-La Roche Ltd., Basilea, Switzerland). The levels of total proteins, lactate, blood urea nitrogen, lactate dehydrogenase (LDH), creatinine, Ca+2 and Mg+2 were measured by a Cobas© Roche.
Haemolysis was evaluated by the absorption spectrum of free haemoglobin (HbO2), using an extinction coefficient of 512 mM−1cm−1 at 415 nm27 on a JASCO V-630 spectrophotometer (Jasco Analytical Instruments, Easton, MD, USA). The percentage of haemolysis was calculated according to Han and colleagues28.
Supernatant samples for 1H-NMR measurements
The supernatant was depleted of proteins by ultra-filtration using a membrane with a 5,000 Da molecular weight cut-off. As a reference for chemical shift (0 ppm) and as a quantitative internal standard, 30 μL of 1% 3-trimethylsilyl propanoic acid (TSP) in D2O were added to 570 μL of the protein-depleted suspension medium. The pH was adjusted to pH 7.4 by addition of 10 μL of phosphate buffer 1 M.
Red blood cell samples for 1H-NMR measurements
The RBC precipitate was washed twice with 0.9% NaCl in 5 mM phosphate buffer pH 7.2 (2,000×g for 10 minutes) and subsequently lysed through two cycles of freezing in liquid nitrogen and thawing at 37 °C and by sonication for 30 seconds (Sonicator Misonix 3000, Farmingdale, NY, USA). Proteins and membranes were eliminated by ultrafiltration on membranes (cut-off 5,000 Da). In a typical experiment 2.6 mL of haemolysate were loaded on two concentrators of 50 mL and centrifuged for 2 hours at 4,000×g at 4 °C. The final filtrate resulted in about 1 mL of which 570 μL to which 10 μL of phosphate buffer 1 M pH 7.4 and 30μL of TSP (1% TSP in D2O) were added to prepare the NMR samples.
1H-NMR experiments and analysis
One-dimensional 1H-NMR spectra were acquired at 25 °C on a Spectrometer Varian Inova 600 MHz (Varian Inc., Palo Alto, CA, USA) using the first increment of the pulse sequence NOESY-presat, 128 scans, sweep window 20 ppm, 32 k points and relaxation delay 5 seconds. The spectra were processed and analysed with Chenomx NMR suite 7.6 (Chenomx Inc., Edmonton, AB, Canada), zero-filing to 64 k points and line broadening 0.5 Hz22 and MestReNova 8.1 software (Mestrelab Research, Santiago de Compostela, Spain).
It should be noted that metabolite concentrations were measured starting from the second day of conservation (which is, therefore, our initial time) after mandatory tests performed by the Transfusion Medicine Unit in accordance with Italian Transfusion Regulatory law (n. 219, 21 October 2005).
Mass spectrometry analysis
Liquid chromatography mass spectrometry analysis of the NMR samples of RBC supernant and lysates was performed using a LTQ Orbitrap XL (Thermo Scientific, Waltham, MA, USA) coupled to a HPLC Dionex Ultimate 3000. The liquid chromatography separation was carried out on Aeris peptide 3.6u XB-C18 column (150×2.1 mm) (Phenomenex, Torrance, CA, USA).
Statistical analysis
Data are expressed as the mean±standard deviation of the eight samples and the level of statistical significance was P<0.02 using an independent sample t-test analysed by Origin 6.1 (Microcal Software Inc., Northampton, MA, USA). The linear correlation was attained using the concentration of 5-oxoproline in relationship to the concentration of the other metabolites.
Results
Standard biochemical measurement
Throughout the storage period of the pre-storage leukoreduced erythrocyte concentrates, samples were tested weekly with biochemical and haematological assays (data not shown) and the results were in agreement with those reported in the literature29,30.
Sample optimisation for NMR measurements
1H-NMR spectra of the supernatant showed two main interferences: the occurrence of broad signals due to residual proteins and lipids from plasma, and intense signals due to the high concentration of the components of the suspension medium.
To eliminate proteins and lipids we used ultrafiltration, adapting the method of Tiziani and colleagues31 for metabolite extraction from human serum (see the materials and methods section). The 1H-NMR spectrum of the filtered supernatant showed only narrow lines and the qualitative and quantitative analysis of the NMR data matched the results of those obtained by biochemical assays and the values reported in the literature.
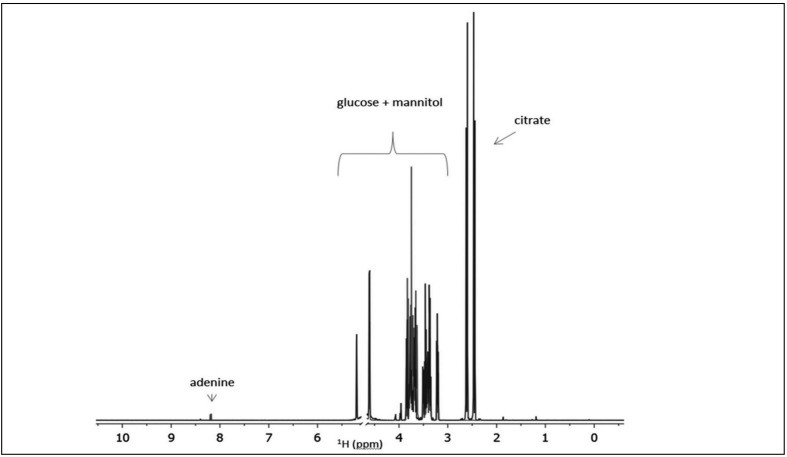
The RBC storage medium SAGM contains high concentrations of nutrients (adenine 1.25 mM, glucose 45.4 mM and mannitol 28.8 mM) with respect to the blood metabolites that are present at concentrations in the range of 10 μM to 6 mM21. As an example, Figure 1 shows the 1H-NMR spectrum of the suspension medium, which contains not only the storage solution SAGM but also a residual amount of citrate from the CPD solution used to conserve the whole blood. It is evident that the extent of the dynamic range of the peak intensities makes adenine barely visible.
Figure 1.
1H-NMR spectrum of the additives and nutrients (CPD and SAGM) used for RBC storage.
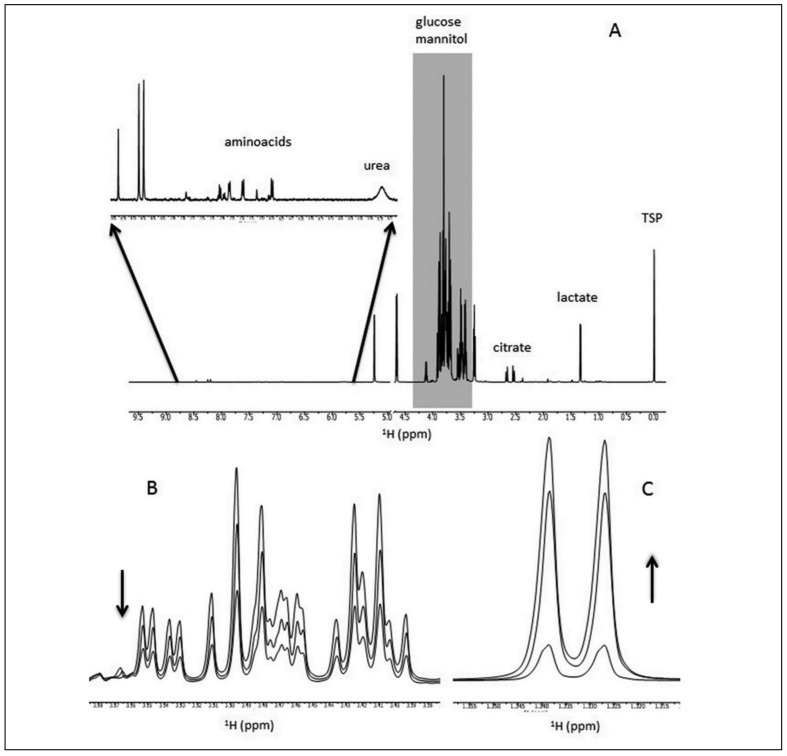
Nonetheless, Figure 2A shows the NMR spectrum of a supernatant in which some metabolites, whose chemical shifts are distinct from those of glucose and mannitol (region between 3–5 ppm, indicated in grey), can be identified. In addition, the high signal-to-noise ratio of the spectra, makes regions, such as the one between 5.7–8.5 ppm that comprises the aromatic amino acids, accessible to peak recognition and quantitative analysis (see inset, 100×magnification). Finally, Figure 2B and 2C present two regions of the spectrum showing that it is possible to follow time-dependent quantitative variations of both added nutrients and metabolites produced during storage: e.g. the decrease of glucose concentration (Figure 2B) and the increase of lactate (Figure 2C).
Figure 2.
1H-NMR spectra of a sample of RBC supernatant.
(A) Whole spectrum at 2 days of storage: the inset shows a magnification (100 x) of the region 5.7–8.5 ppm; (B) decrease of glucose concentration (3.3–3.6 ppm) and (C) increase of lactate (1.30–1.36 ppm) peaks at different storage times (2, 23 and 42 days).
As for the analysis of the RBC metabolite content, NMR-based studies generally use solvent extraction protocols taking advantage of various type of solvents (methanol, chloroform, water, perchloric acid) and/or hypotonic lysis of tissues22,26. All these procedures carry the risk of loss or dilution of the extracted metabolites. To overcome this problem we devised a protocol to collect the RBC cytoplasm after sonication without dilution. Ultrafiltration with selected cutoff filters, carried out at 4 °C, allowed us to recover the polar metabolites preserving their physiological concentration (Table I). It should be noted that this fact is valid only for data concerning amino acids and GSH because these compounds are not introduced as additives. In contrast, the values we found for glucose, and its derivatives, for instance, are altered by the very high and not physiological concentration of glucose of the suspension medium.
Table I.
Metabolites identified in haemolysates (μM).
| Metabolite | Day 2 | Day 42 |
|---|---|---|
| GSH | 2,692±533 | 1,981±529 |
| 5-oxoproline | 76±31 | 646±31 |
| Gly | 467±113 | 1,194±86 |
| Ala | 309±31 | 340±45 |
| Gln | 470±69 | 106±29 |
| Phe | 38±12.6 | 72±8 |
| His | 146±30 | 161±25 |
| Tyr | 96±13 | 113±9 |
| Asp | 359±161 | 307±117 |
| Leu | 45±14 | 71±14 |
| Ile | 31±8 | 41±7 |
| Val | 66±15 | 112±9 |
| Nicotinurate | 55±8 | 59±19 |
| Fumarate | 32±13 | 18±3 |
| Acetate | 102±35 | 134±38 |
| Formate | 89±34 | 72±33 |
| Choline | 37±12 | 31±10 |
| Urea | 238±113 | 490±124 |
| Creatine | 700±130 | 668±120 |
| Creatinine | 78±15 | 54±8 |
| Adenine | 220±73 | 17±24 |
| Hypoxanthine | 17±25 | 280±56 |
| ATP | 1,393±231 | 403±88 |
| Glucose | 11,960±3,897 | 3,405±1,069 |
| Fructose | 856±331 | 1,297±85 |
| UDP-glucose | 81±19 | 54±22 |
| Lactate | 3,038±1,163 | 22,912±3,026 |
| Pyruvate | 200±84 | 436±50 |
| Mannitol | 783±84 | 2,082±370 |
Validation of the 1H-NMR measurements
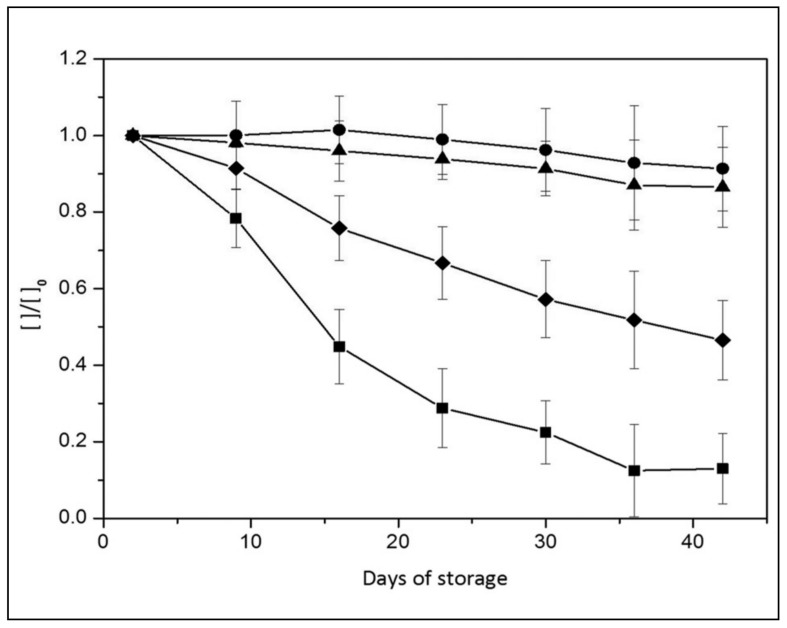
To validate our measurement protocol we followed the quantitative changes of the added nutrients during RBC storage and compared the results with those present in the literature19, 32–34. Figure 3 shows the changes of the components of the SAGM storage medium.
Figure 3.
Quantification of RBC additives during the storage period: glucose (◆), adenine (■), mannitol (●) and citrate (▲).
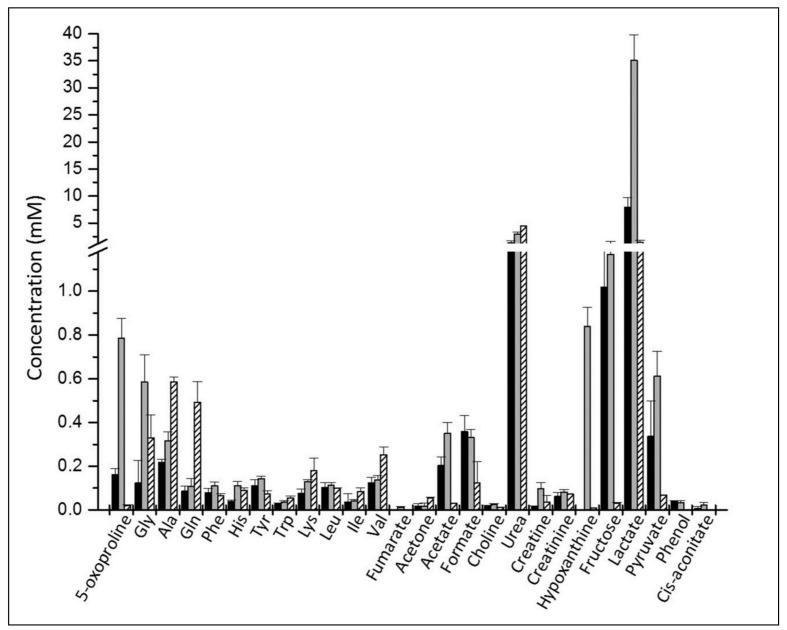
The glucose variation is in perfect agreement with the liquid chromatography-mass analysis19: the concentration decreased gradually and, at day 42, up to 42% (18 mM) is still present. Glucose consumption is correlated to a gradual accumulation of the end product of glycolysis, lactate, which increases from 7.9 mM (day 2) to 35 mM (day 42) (Figure 4). The values determined by NMR match those obtained by standard biochemical analysis (data not shown).
Figure 4.
Metabolites identified in the RBC supernatant medium.
The concentrations are those on the 2nd day (black) and 42nd day (grey) of storage and for reference the values in normal human serum (striped) from the Human Metabolome Database (http://www.hmdb.ca/).
As for adenine, our results do not agree completely with the liquid chromatography-mass data from Gevi and colleagues19. In fact, while they reported a complete depletion of adenine after 20 days of storage, we found a consumption of about 60% in that period and complete consumption during the last 3 weeks of storage; in any case, our data support the notion that the adenine present in SAGM additive is not sufficient to sustain the requirements of the RBC35.
Mannitol, which has free radical scavenger activity and acts as an osmotic pressure regulator36, is added to the conservation medium to prevent RBC lysis. In contrast to Gevi and colleagues19, we observe a concentration decrease of only 15% at day 42. Our results are consistent with the hypothesis that mannitol can diffuse into cells, as suggested by Hamasaki and Yamamoto37. In fact, we observe a gradual increase of the sugar, up to 2 mM at day 42, in RBC lysates.
Citrate is not a SAGM component; nonetheless its presence was detected by NMR suggesting that it remains from the initial use of CDP. As expected, its concentration does not change during RBC storage.
Identification and quantification of metabolites in the supernatant and inside red blood cells
So far, 30 metabolites have been identified in the supernatant: amino acids, products of glucose catabolism, purine metabolism and GSH cycle. Figure 4 shows the concentrations of metabolites measured at day 2 and at day 42, together with the values for normal human serum reported in the Human Metabolome Database (http://www.hmdb.ca/)38. It should be noted that the 1H resonances of glucose and mannitol hide a number of metabolites usually found in normal blood samples such as betaine, taurine, glycerol, arginine, lysine, and trimethylamine-N-oxide.
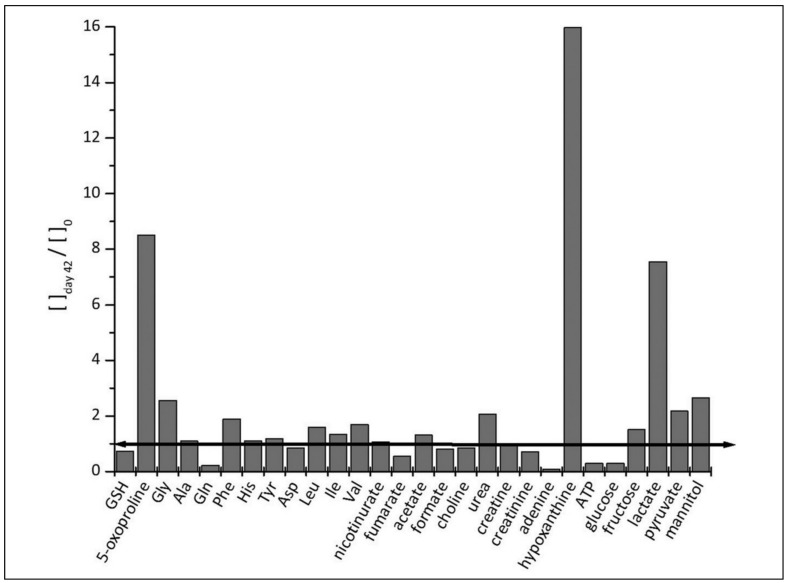
We have identified and quantified 29 metabolites in the RBC lysates; some NMR peaks have not yet been identified. The list and concentrations of these metabolites at day 2 and day 42 are shown in Table I. Figure 5 illustrates the fold-increase of the metabolites found in the RBC cytoplasm. The data show the changes in concentration of a number of metabolites reflecting the utilisation of the nutrients present in the conservation medium, including fructose, lactate, pyruvate and hypoxanthine. In addition to these metabolites, we identified and quantified several amino acids and some products of amino acid catabolism (e.g., creatine, creatinine and urea). Finally, we detected metabolites associated with GSH metabolism, including 5-oxoproline.
Figure 5.
Fold change ([ ] day 42/[ ]0) of the concentrations of different metabolites inside the RBC.
The bars below the black line indicate consumption of the metabolite while those above the line indicate production of the metabolite.
In healthy human erythrocytes GSH concentration is ~2–3 mM39, while its extracellular concentration is relatively low (2–20 μM in the plasma). It is well known that GSH plays a critical protective role against oxidative processes that impair haemoglobin function and produce RBC lysis.
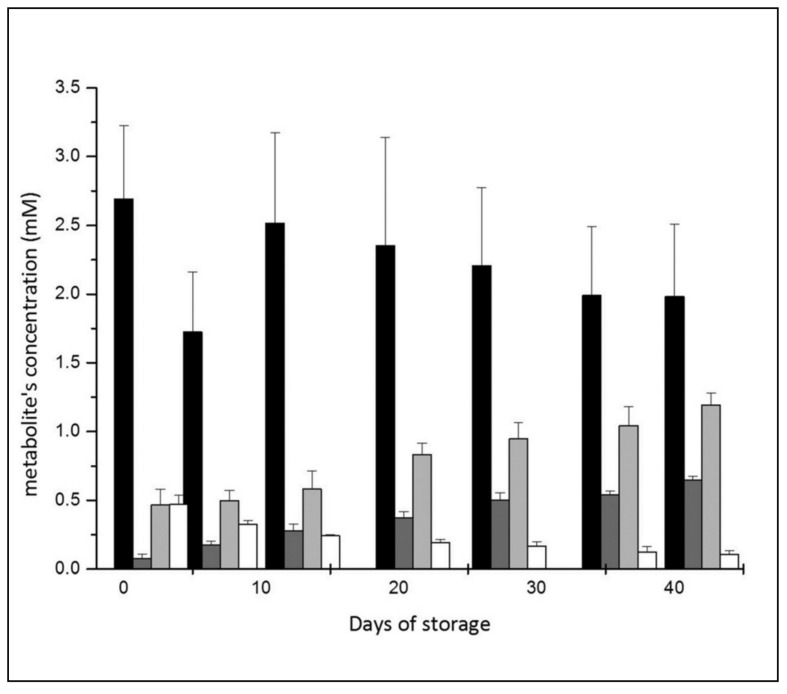
As reported in Figure 6, GSH concentration decreases during the first week, then recovers in the second week and steadily decreases afterwards down to −26 %, with respect to the initial value, by day 42; these results are in good agreement with other data for RBC3. In parallel with the decrease in GSH, we observed a gradual increase of its precursor glycine and a significant decrease of glutamine. Interestingly, these variations are associated with a significant increase of 5-oxoproline (8.5-fold inside the cells and 4.0-fold in the supernatant; Figure 4).
Figure 6.
Glutathione metabolism: correlation between amino acid precursors (glycine in light grey and glutamine in white), GSH (black) and 5-oxoproline (dark grey) during storage.
The identification of metabolites deriving from the GSH cycle was confirmed by mass spectrometry analysis.
Red blood cell haemolysis and 5-oxyproline concentration
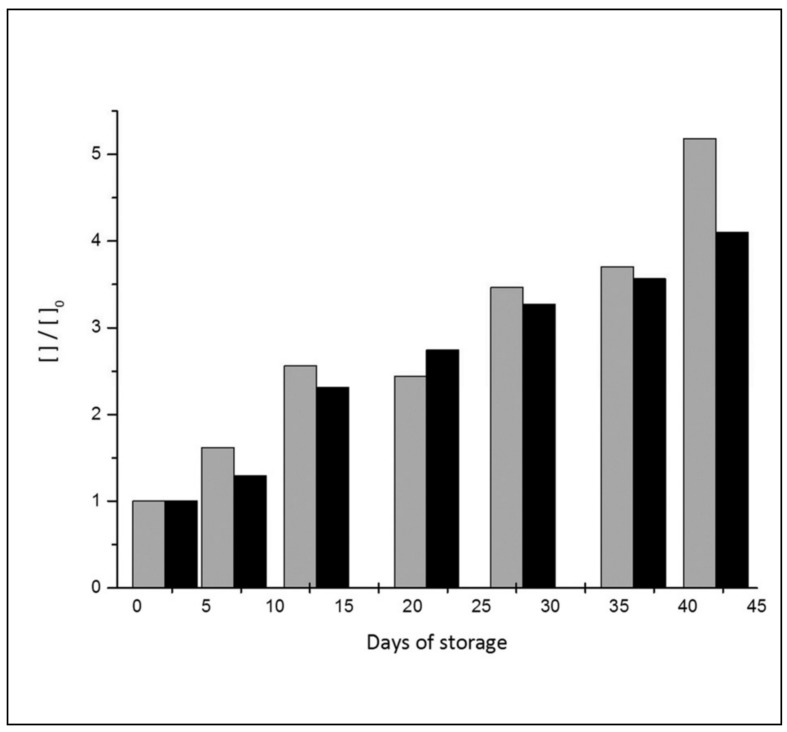
Haemolysis is the fate of aged RBC, and free haemoglobin (HbO2) and the cytosolic enzyme LDH are biomarkers commonly used to certify the occurrence of that cellular damage. We looked for a biomarker that would also provide hints on the origin of that process. The build-up of 5-oxoproline in the supernatant during storage showed a good correlation with the standard markers of haemolysis (r=0.96 for HbO2 and r=0.81 for LDH). Figure 7 shows the direct correlation between 5-oxoproline and free haemoglobin.
Figure 7.
Correlation between haemolysis (HbO2, grey) and 5-oxoproline (black) in the supernatant during RBC storage.
Creatine has also been indicated as a useful parameter for the quantification of haemolytic processes4 and a report of some years ago indicated that it is possible to follow the creatine concentration in RBC using 1H-NMR40. Interestingly, as in the case of free haemoglobin, we found a very good correlation between the increase of concentration of creatine and 5-oxoproline in the supernatant (r=0.98).
Discussion
The knowledge of RBC biochemical modifications during storage has great potential to be translated into better transfusion strategies and reduced RBC transfusion risks.
In the past decades, many studies have focused on various aspects of RBC metabolism with the aim of understanding critical steps responsible for the loss of viability and efficacy of RBC1–4. However, even though there are fewer metabolic pathways in RBC than in other cells and organelles, the interplay between GSH and purine metabolism or glycolysis, to mention some, turns out to be very strict and requires a more holistic analysis that metabolomics can offer.
To date, most of the analytical studies available to tackle RBC metabolic viability suffer from the drawback of complex and lengthy analytical procedures. We set up a protocol that allows, at the moment, to detect and follow quantitatively up to 30 metabolites. In addition, we show that it is possible not only to study, independently, RBC metabolites that are present in the cytoplasm or excreted in the supernatant medium, but also to follow quantitative changes in the nutrients added to the preservation medium over the entire storage period.
The analysis of SAGM components (Figure 3) confirmed that the amount of adenine, added to sustain RBC ATP synthesis, decreases rapidly, down to 60% in the first 2 weeks. Concomitantly we observed the accumulation of hypoxanthine, which only in part remains inside the cells (Table I) reaching a very high concentration in the supernatant, up to 1.0 mM, at the end of storage period (Figure 4). It is noteworthy that hypoxanthine is present at a very low concentration in the blood: its concentration, predicted by theoretical simulation, is in the nanomolar range41. These observations call for further studies to verify how both the shortage of adenine and the high concentration of hypoxanthine in the second half of the storage period may eventually impair RBC viability.
Knowing that SAGM is an amino acid-free medium, the fact that we detect, inside and outside the RBC, an increase in some metabolites that originate from amino acid catabolism reflects the onset of a progressive degradation of proteins very likely favoured by a decrease in the protection from oxidative stress.
GSH is a low molecular weight tripeptide found at relatively high concentrations (0.5–10 mM) in animal cells. It is known to play a relevant role in protecting RBC from lysis and haemoglobin from degradation due to oxidative stress. Although GSH synthesis via the γ-glutamyl cycle in RBC is critical to preserve the cells’ integrity and functionality, its turnover is relatively slow with respect to other cell types: in fact, in vitro, it has been estimated to be around 4–6 days39.
During storage, in the first week we observe a decrease of 40% in GSH, which we attribute to its oxidation and/or to the formation of adducts with oxidation by-products, such as aldehydes. In week 2, the GSH concentration in the RBC recover almost completely to the initial concentration (Figure 6). This observation is in agreement with a model for GSH metabolism proposed by Raftos and co-workers39. According to that model, viable RBC are expected to react to perturbations of the equilibrium between reduced and oxidized glutathione, recovering the original GSH concentration in about 7 days. In the following weeks we observe a linear decrease in the concentration of GSH which, by day 42, was −26 % with respect to the initial concentration; this suggests that the ability of RBC to protect themselves from oxidative stress is impaired.
Such a decrease in the concentration of GSH is consistent with the observed increase in glycine and 5-oxoproline concentrations. In fact, the dipeptide γ-glutamylcysteine, formed in the first step of GSH synthesis, can be the substrate for two different enzymes: γ-glutamylcyclotransferase (which produces 5-oxoproline) and GSH-synthetase (which uses glycine to produce GSH). In normal conditions in animal cells GSH synthesis is favoured42, and in particular, in human erythrocytes, GSH homeostasis produces only traces of 5-oxoproline (around 45 μM)43. The accumulation of 5-oxoproline and glycine during storage clearly indicated a block of the second step of the GSH pathway. It is noteworthy that this event is also observed in the pathological condition known as mild glutathione synthetase deficiency44 which is characterised by haemolytic anaemia. The fact that we found a very good correlation between the accumulation of 5-oxoproline in the supernatant and free haemoglobin (Figure 7) in the RBC during storage confirms this biochemical model.
Since the extracellular concentration of 5-oxoproline is clearly correlated to the GSH content of the RBC (r=0.96) (Figure 6), we propose to use 5-oxoproline as a specific biomarker in transfusion medicine. In fact, the detection of 5-oxoproline in the supernatant medium of stored RBC provides a quantitative estimate of the GSH in RBC and, therefore, a reliable estimate of their viability, quickly available for standard quality control in transfusion practice.
In conclusion, although the analysis of RBC by 1H NMR spectroscopy presents some challenges due the occurrence of broad signals arising from residual proteins and lipids from plasma, and intense signals due to the high concentration of the SAGM and CDP components, we showed that the method can be used to study details of the metabolism of stored RBC. The information acquired may be valuable to improve the storage and quality control protocols currently used.
Footnotes
The Authors declare no conflicts of interest.
References
- 1.Nakao K, Wada T, Kamiyama T, et al. A direct relationship between adenosine triphosphate-level and in vivo viability of erythrocytes. Nature. 1962;194:877–8. doi: 10.1038/194877a0. [DOI] [PubMed] [Google Scholar]
- 2.de Korte D, Kleine M, Korsten HG, Verhoeven AJ. Prolonged maintenance of 2,3-diphosphoglycerate acid and adenosine triphosphate in red blood cells during storage. Transfusion. 2008;48:1081–108. doi: 10.1111/j.1537-2995.2008.01689.x. [DOI] [PubMed] [Google Scholar]
- 3.Whillier S, Raftos JE, Sparrow RL, Kuchel PW. The effects of long-term storage of human red blood cells on the glutathione synthesis rate and steady-state concentration. Transfusion. 2011;51:1450–9. doi: 10.1111/j.1537-2995.2010.03026.x. [DOI] [PubMed] [Google Scholar]
- 4.Cramer H, Dauwalder H, Meier H, Colombo JP. Enzymatic determination of red cell creatine as an index of hemolysis. Clinical Biochem. 1987;20:329–32. doi: 10.1016/s0009-9120(87)80081-4. [DOI] [PubMed] [Google Scholar]
- 5.Hess JR. Red cell storage: when is better not good enough? Blood Transfus. 2009;7:172–3. doi: 10.2450/2009.0110-09. [DOI] [PMC free article] [PubMed] [Google Scholar]
- 6.Holme S. Current issues related to the quality of stored RBCs. Transfus Apher Sci. 2005;33:55–61. doi: 10.1016/j.transci.2005.02.004. [DOI] [PubMed] [Google Scholar]
- 7.Blasi B, D’Alessandro A, Ramundo N, Zolla L. Red blood cell storage and cell morphology. Transfus Med. 2012;22:90–6. doi: 10.1111/j.1365-3148.2012.01139.x. [DOI] [PubMed] [Google Scholar]
- 8.Baz EM, Kanazi GE, Mahfouz RA, Obeid MY. An unusual case of hyperkalaemia-induced cardiac arrest in a paediatric patient during transfusion of a ‘fresh’ 6-day-old blood unit. Transfus Med. 2002;12:383–6. doi: 10.1046/j.1365-3148.2002.00402.x. [DOI] [PubMed] [Google Scholar]
- 9.Silliman CC. The two-event model of transfusion-related acute lung injury. Crit Care Med. 2006;34:S124–31. doi: 10.1097/01.CCM.0000214292.62276.8E. [DOI] [PubMed] [Google Scholar]
- 10.Gajic O, Rana R, Winters JL, et al. Transfusion-related acute lung injury in the critically ill: prospective nested case-control study. Am J Respir Crit Care Med. 2007;176:886–91. doi: 10.1164/rccm.200702-271OC. [DOI] [PMC free article] [PubMed] [Google Scholar]
- 11.Eder AF, Herron R, Strupp A, et al. Transfusion-related acute lung injury surveillance (2003–2005) and the potential impact of the selective use of plasma from male donors in the American Red Cross Transfusion. 2007;47:599–607. doi: 10.1111/j.1537-2995.2007.01102.x. [DOI] [PubMed] [Google Scholar]
- 12.Tinmouth A, Chin-Yee I. The clinical consequences of the red cell storage lesion. Transfus Med Rev. 2001;15:91–107. doi: 10.1053/tmrv.2001.22613. [DOI] [PubMed] [Google Scholar]
- 13.Koch CG, Li L, Sessler DI, et al. Duration of red-cell storage and complications after cardiac surgery. N Engl J Med. 2008;358:1229–39. doi: 10.1056/NEJMoa070403. [DOI] [PubMed] [Google Scholar]
- 14.Sparrow LR. Time to revisit red blood cell additive solutions and storage conditions: a role for “omics” analyses. Blood Transfus. 2012;10:s7–11. doi: 10.2450/2012.003S. [DOI] [PMC free article] [PubMed] [Google Scholar]
- 15.Anniss AM, Glenister KM, Killian JJ, Sparrow RL. Proteomic analysis of supernatants of stored red blood cell products. Transfusion. 2005;45:1426–33. doi: 10.1111/j.1537-2995.2005.00547.x. [DOI] [PubMed] [Google Scholar]
- 16.Lion N, Crettaz D, Rubin O, Tissot JD. Stored red blood cells: a changing universe waiting for its map(s) J Proteomics. 2010;73:374–85. doi: 10.1016/j.jprot.2009.11.001. [DOI] [PubMed] [Google Scholar]
- 17.D’Alessandro A, D’Amici GM, Vaglio S, Zolla L. Time-course investigation of SAGM-stored leukocyte-filtered red bood cell concentrates: from metabolism to proteomics. Haematologica. 2012;97:107–15. doi: 10.3324/haematol.2011.051789. [DOI] [PMC free article] [PubMed] [Google Scholar]
- 18.Darghouth D, Koehl B, Junot C, Roméo PH. Metabolomic analysis of normal and sickle cell erythrocytes. Transfus Clin Biol. 2010;17:148–50. doi: 10.1016/j.tracli.2010.06.011. [DOI] [PubMed] [Google Scholar]
- 19.Gevi F, D’Alessandro A, Rinalducci S, Zolla L. Alterations of red blood cell metabolome during cold liquid storage of erythrocyte concentrates in CPD-SAGM. J Proteomics. 2012;5:168–80. doi: 10.1016/j.jprot.2012.03.012. [DOI] [PubMed] [Google Scholar]
- 20.Nicholson JK, Lindon JC. Systems biology: metabonomics. Nature. 2008;455:1054–6. doi: 10.1038/4551054a. [DOI] [PubMed] [Google Scholar]
- 21.Psychogios N, Hau DD, Peng J, et al. The human serum metabolome. PLoS One. 2011;6:e16957. doi: 10.1371/journal.pone.0016957. [DOI] [PMC free article] [PubMed] [Google Scholar]
- 22.Beckonert O, Keun HC, Ebbels TM, et al. Metabolic profiling, metabolomic and metabonomic procedures for NMR spectroscopy of urine, plasma, serum and tissue extracts. Nat Protoc. 2007;2:2692–703. doi: 10.1038/nprot.2007.376. [DOI] [PubMed] [Google Scholar]
- 23.Serkova NJ, Standiford TJ, Stringer KA. The emerging field of quantitative blood metabolomics for biomarker discovery in critical illnesses. Am J Respir Crit Care Med. 2011;184:647–55. doi: 10.1164/rccm.201103-0474CI. [DOI] [PMC free article] [PubMed] [Google Scholar]
- 24.Kortz L, Helmschrodt C, Ceglarek U. Fast liquid chromatography combined with mass spectrometry for the analysis of metabolites and proteins in human body fluids. Anal Bioanal Chem. 2011;399:2635–44. doi: 10.1007/s00216-010-4595-6. [DOI] [PubMed] [Google Scholar]
- 25.Wishart DS. Quantitative metabolomics using NMR. Trends Anal Chem. 2008;27:228–37. [Google Scholar]
- 26.Messana I, Ferroni L, Misiti F, et al. Blood bank conditions and RBCs: the progressive loss of metabolic modulation. Blood Components. 2000;40:353–60. doi: 10.1046/j.1537-2995.2000.40030353.x. [DOI] [PubMed] [Google Scholar]
- 27.Antonini E, Brunori M. Hemoglobin and myoglobin in their reaction with ligands. Amsterdam: North-Holland Publications; 1971. [Google Scholar]
- 28.Han V, Serrano K, Devine DV. A comparative study of common techniques used to measure haemolysis in stored red cell concentrates. Vox Sang. 2010;98:116–23. doi: 10.1111/j.1423-0410.2009.01249.x. [DOI] [PubMed] [Google Scholar]
- 29.Bennett-Guerrero E, Veldman TH, Doctor A, et al. Evolution of adverse changes in stored RBCs. Proc Natl Acad Sci USA. 2007;104:17063–8. doi: 10.1073/pnas.0708160104. [DOI] [PMC free article] [PubMed] [Google Scholar]
- 30.Karon BS, van Buskirk CM, Jaben EA, et al. Temporal sequence of major biochemical events during blood bank storage of packed red blood cells. Blood Transfus. 2012;10:453–61. doi: 10.2450/2012.0099-11. [DOI] [PMC free article] [PubMed] [Google Scholar]
- 31.Tiziani S, Emwas AH, Lodi A, et al. Optimized metabolite extraction from blood serum for 1H nuclear magnetic resonance spectroscopy. Anal Biochem. 2008;377:16–23. doi: 10.1016/j.ab.2008.01.037. [DOI] [PubMed] [Google Scholar]
- 32.Burger P, Korsten H, de Korte D, et al. An improved red blood cell additive solution maintains 2,3-diphosphoglycerate and adenosine triphosphate levels by an enhancing effect on phosphofructokinase activity during cold storage. Transfusion. 2010;50:2386–92. doi: 10.1111/j.1537-2995.2010.02700.x. [DOI] [PubMed] [Google Scholar]
- 33.Karam O, Tucci M, Toledano BJ, et al. Length of storage and in vitro immunomodulation induced by prestorage leukoreduced red blood cells. Transfusion. 2009;49:2326–34. doi: 10.1111/j.1537-2995.2009.02319.x. [DOI] [PubMed] [Google Scholar]
- 34.Kreuger A, Åkerblom O. Adenine consumption in stored citrate-phosphate-dextrose-adenine blood. Vox Sang. 1980;38:156–60. doi: 10.1111/j.1423-0410.1980.tb02343.x. [DOI] [PubMed] [Google Scholar]
- 35.Meyer EK, Dumont DF, Baker S, Dumont LJ. Rejuvenation capacity of red blood cells in additive solutions over long-term storage. Transfusion. 2011;51:1574–9. doi: 10.1111/j.1537-2995.2010.03021.x. [DOI] [PubMed] [Google Scholar]
- 36.Beutler E, Kuhl W. Volume control of erythrocytes during storage. The role of mannitol. Transfusion. 1988;28:353–7. doi: 10.1046/j.1537-2995.1988.28488265266.x. [DOI] [PubMed] [Google Scholar]
- 37.Hamasaki N, Yamamoto M. Red blood cell function and blood storage. Vox Sang. 2000;79:191–7. doi: 10.1159/000056729. [DOI] [PubMed] [Google Scholar]
- 38.Wishart DS, Jewison T, Guo AC, et al. HMDB 3.0-The Human Metabolome Database in 2013. Nucleic Acids Res. 2013;41:D801–7. doi: 10.1093/nar/gks1065. [DOI] [PMC free article] [PubMed] [Google Scholar]
- 39.Raftos JE, Whillier S, Kuchel PW. Glutathione synthesis and turnover in the human erythrocyte. J Biol Chem. 2010;285:23557–67. doi: 10.1074/jbc.M109.067017. [DOI] [PMC free article] [PubMed] [Google Scholar]
- 40.Kuchel PW, Chapman BE. Proton NMR studies of creatine in human erythrocytes. Biomed Biochim Acta. 1983;42:1143–9. [PubMed] [Google Scholar]
- 41.Nakayama Y, Kinoshita A, Tomita M. Dynamic simulation of red blood cells metabolism and its application to the analysis of a pathological condition. Theor Biol Med Model. 2005;2:18. doi: 10.1186/1742-4682-2-18. [DOI] [PMC free article] [PubMed] [Google Scholar]
- 42.Griffith OW. Biologic and pharmacologic regulation of mammalian glutathione synthesis. Free Radic Biol Med. 1999;27:922–35. doi: 10.1016/s0891-5849(99)00176-8. [DOI] [PubMed] [Google Scholar]
- 43.Palekar AG, Tate SS, Meister A. Formation of 5-oxoproline from glutathione in erythrocytes by the gamma-glutamyltranspeptidase-cyclotransferase pathway. Proc Natl Acad Sci USA. 1974;71:293–7. doi: 10.1073/pnas.71.2.293. [DOI] [PMC free article] [PubMed] [Google Scholar]
- 44.Mohler DN, Majerus PW, Minnich V, et al. Glutathione synthetase deficiency as a cause of hereditary hemolytic disease. N Engl J Med. 1970;283:1253–7. doi: 10.1056/NEJM197012032832304. [DOI] [PubMed] [Google Scholar]


