

Abstract
The right inferior frontal cortex (rIFC) and the right anterior insula (rAI) have been implicated consistently in inhibitory control, but their differential roles are poorly understood. Here we use multiple quantitative techniques to dissociate the functional organization and roles of the rAI and rIFC. We first conducted a meta-analysis of 70 published inhibitory control studies to generate a commonly activated right fronto-opercular cortex volume of interest (VOI). We then segmented this VOI using two types of features: (1) intrinsic brain activity; and (2) stop-signal task-evoked hemodynamic response profiles. In both cases, segmentation algorithms identified two stable and distinct clusters encompassing the rAI and rIFC. The rAI and rIFC clusters exhibited several distinct functional characteristics. First, the rAI showed stronger intrinsic and task-evoked functional connectivity with the anterior cingulate cortex, whereas the rIFC had stronger intrinsic and task-evoked functional connectivity with dorsomedial prefrontal and lateral fronto-parietal cortices. Second, the rAI showed greater activation than the rIFC during Unsuccessful, but not Successful, Stop trials, and multivoxel response profiles in the rAI, but not the rIFC, accurately differentiated between Successful and Unsuccessful Stop trials. Third, activation in the rIFC, but not rAI, predicted individual differences in inhibitory control abilities. Crucially, these findings were replicated in two independent cohorts of human participants. Together, our findings provide novel quantitative evidence for the dissociable roles of the rAI and rIFC in inhibitory control. We suggest that the rAI is particularly important for detecting behaviorally salient events, whereas the rIFC is more involved in implementing inhibitory control.
Keywords: cognitive control, response inhibition, stop-signal task, unsupervised learning, classification
Introduction
Inhibitory control, defined as the ability to withhold or override an automatic, habitual, or prepotent process, is critical for many adaptive behaviors (Aron, 2011). More than a decade of neuroimaging research has ascribed an important role in inhibitory control to the right inferior frontal cortex (rIFC; Levy and Wagner, 2011; Swick et al., 2011). In contrast, little is known about the role of the right anterior insula (rAI), a region adjacent to the rIFC that is almost ubiquitously coactivated with the rIFC during inhibitory control. This is particularly surprising because, within the right fronto-opercular cortex, encompassing both rAI and rIFC, peak activation has often been detected in the rAI rather than the rIFC in many studies (Aron and Poldrack, 2006; Chikazoe et al., 2009; Boehler et al., 2010; Cai et al., 2014). Knowledge of the functional organization of the fronto-opercular cortex and the dissociable roles of the rAI and rIFC is a crucial next step for understanding the neurobiology of inhibitory control.
Disentangling the functional subdivisions of the fronto-opercular cortex and their interconnected circuits is a challenging problem because these regions are often coactivated during a wide range of cognitive tasks. We address this problem using two complementary quantitative approaches. First, we use inter-regional variability in intrinsic brain activity to parcellate the fronto-opercular cortex and examine the unique functional circuits associated with each subdivision (Cohen et al., 2008; Deen et al., 2011). Second, we leverage variability in the temporal profile of task-evoked response during stop-signal tasks (SST) to parcellate the functional subdivisions of the fronto-opercular cortex, taking advantage of recent findings that such variability can provide informative multivoxel features for demarcating functional clusters within coactivated brain regions (Gonzalez-Castillo et al., 2012; Orban et al., 2014).
Here we deploy multiple quantitative approaches to disentangle the functional organization of the fronto-opercular cortex and dissociate the functional roles of the rAI and rIFC in inhibitory control. Our approach involved the following steps. First, we conducted a meta-analysis of extant literature to identify fronto-opercular regions that are consistently activated in inhibitory control tasks. Second, we applied a novel consensus-based clustering algorithm (Fred and Jain, 2005; Bellec et al., 2010) (S. Ryali, T. Chen, A. Padmanabhan, W. Cai, and V. Menon, unpublished observations under the title “Development and validation of consensus clustering-based framework for brain segmentation using regional resting fMRI”) to identify functional subdivisions within the fronto-opercular cortex using intrinsic brain activity during resting-state fMRI. Third, we examined the convergence of these clusters with those parcellated using spatial patterns of task-evoked hemodynamic responses in two independent SST datasets (Xue et al., 2008; Zhang and Li, 2012). In each case, the clustering procedures produced two highly stable subdivisions, encompassing the rAI and rIFC, respectively. Fourth, we examined the intrinsic and SST-evoked functional connectivity of the rAI and rIFC. Fifth, we examined hemodynamic response characteristics of the task-evoked activation and their relation to inhibitory control in each subdivision. We demonstrate that the rAI and rIFC have different task-evoked response patterns, intrinsic and task-evoked functional connectivity and relation to behavior, and highlight new findings related to their distinct circuits and functions in inhibitory control.
Materials and Methods
Ethics statement
All datasets used in the current study were approved by their local institutional review boards.
Overview of data analysis strategy and datasets
Figures 1–3 summarize the analysis strategy and datasets used in our study. First, a meta-analysis was conducted to generate a volume of interest (VOI) reflecting the right fronto-opercular regions commonly activated during inhibitory control (Fig. 1). The studies included in the meta-analysis were collected from the BrainMap database (www.brainmap.org) and Pubmed (www.ncbi.nlm.nih.gov/pubmed). Second, this VOI was segmented using features derived from two different types of data. For resting-state fMRI, two different features were used in parcellation separately: (1) voxelwise time series within the VOI; and (2) intrinsic functional connectivity (Fig. 2). For task fMRI, regional profiles of task-evoked hemodynamic response elicited during an SST were used as features for parcellation (Fig. 3). In both cases, our parcellation algorithm produced two stable and distinct clusters encompassing the rAI and rIFC. Third, we examined distinct functional characteristics of the rAI and rIFC clusters, including the following: (1) their intrinsic and task-evoked functional connectivity; (2) task-evoked activation patterns during Go and Successful and Unsuccessful Stop trials; (3) their performance in identifying Stop trial outcomes as multivariate classifiers; and (4) brain–behavior relationships (Figs. 2, 3). Three datasets were used in this study: (1) resting-state fMRI data acquired at Stanford University; (2) an event-related task fMRI dataset acquired from the open-source OpenfMRI.org database; and (3) a second event-related task fMRI dataset acquired at Yale University. Details are described below.
Figure 1.

Flow chart of key steps in the meta-analysis used to generate a VOI reflecting commonly activated right fronto-opercular regions involved in inhibitory control.
Figure 2.

Flow chart of key steps in clustering and subsequent analyses of resting-state fMRI data. a, Clustering using VOI time series as features. b, Clustering using intrinsic functional connectivity as features.
Figure 3.

Flow chart of key steps in clustering and subsequent analyses of two open-source stop-signal fMRI task datasets.
Meta-analysis of published studies involving inhibitory control
To identify right fronto-opercular regions that are consistently involved in inhibitory control, we first conducted an activation likelihood estimation (ALE) (Eickhoff et al., 2009, 2012) of the relevant published literature (Table 1). Studies included in the meta-analysis were required to meet the following criteria: (1) study included healthy adults (aged ≥18years) and activations were reported for healthy adults, distinct from developmental or clinical groups if any; (2) study used the SST or the go/no-go task (GNGT); (3) subjects made responses by hand; (4) study included activation contrast analysis that directly probed inhibitory control; (5) study reported activations using whole-brain analysis; and (6) the activations were reported in either Montreal Neurological Institute (MNI) or Talairach space.
Table 1.
Studies and contrasts included in the meta-analysis
| Year | First author | Journal | Task | Contrasts | Foci (n) |
|---|---|---|---|---|---|
| 1998 | Konishi | European Journal of Neuroscience | GNGT | 1. No–go dominant foci | 19 |
| 1999 | Garavan | Proceedings of the National Academy of Sciences USA | GNGT | 1. Response inhibition | 14 |
| 2000 | de Zubicaray | Neuropsychologia | GNGT | 1. Linear increases | 26 |
| 2. Linear increases with number of trials equated per block | |||||
| 2000 | Kiehl | Psychophysiology | GNGT | 1. Task 1, correct rejects | 8 |
| 2001 | Braver | Cerebral Cortex | GNGT | 1. Disjunction analysis | 19 |
| 2001 | Liddle | Human Brain Mapping | GNGT | 1. Correct no-go − baseline | 42 |
| 2. Correct no-go − go | |||||
| 2001 | Menon | Human Brain Mapping | GNGT | 1. Go/no–go − go | 13 |
| 2001 | Rubia | NeuroImage | GNGT, SST | 1. Generic go/no-go activation | 27 |
| 2. Generic stop activation | |||||
| 3. Activation common to all go/no-go and stop task versions | |||||
| 2002 | Garavan | NeuroImage | GNGT | 1. Successful no-gos | 16 |
| 2002 | Watanabe | NeuroImage | GNGT | 1. Areas activated during no-go phase | 9 |
| 2. Specific activation areas during no-go phase | |||||
| 2003 | Garavan | NeuroImage | GNGT | 1. Event-related stops | 7 |
| 2003 | Horn | Neuropsychologia | GNGT | 1. Go/no-go > go | 14 |
| 2003 | Maguire | NeuroImage | GNGT | 1. Go/no-go versus fixation | 16 |
| 2. Go/no-go versus go | |||||
| 2003 | Mostofsky | Cognitive Brain Research | GNGT | 1. Primary no-go effects | 6 |
| 2. Primary counting no-go effects | |||||
| 2003 | Rubia | NeuroImage | SST | 1. Successful inhibition − unsuccessful inhibition | 2 |
| 2004 | Asahi | European Archives of Psychiatry and Clinical Neuroscience | GNGT | 1. Response inhibition | 11 |
| 2004 | Bellgrove | Neuropsychologia | GNGT | 1. Response inhibition | 19 |
| 2004 | Fassbender | Cognitive Brain Research | GNGT | 1. Activations for correct inhibitions | 8 |
| 2004 | Hester | Journal of Cognitive Neuroscience | GNGT | 1. Cued and uncued successful response inhibition | 21 |
| 2004 | Kelly | European Journal of Neuroscience | GNGT | 1. Fast and slow successful response inhibitions | 23 |
| 2005 | Altshuler | Biological Psychiatry | GNGT | 1. No-go > go, normals | 4 |
| 2005 | Maltby | NeuroImage | GNGT | 1. Correct inhibition, normals | 5 |
| 2005 | Ramautar | Brain Research | SST | 1. SST versus NST | 7 |
| 2005 | Vink | Human Brain Mapping | SST | 1. Go/stop > go only | 6 |
| 2. Correct > incorrect stop | |||||
| 2006 | Aron | Journal of Neuroscience | SST | 1. Stop inhibit − go | 48 |
| 2. Stop inhibit − stop respond | |||||
| 2006 | Li | Journal of Neuroscience | SST | 1. Successful compared with failed inhibition | 9 |
| 2006 | Li | NeuroImage | SST | 1. Successful stop > failed stop, men | 18 |
| 2. successful stop > failed stop, women | |||||
| 2006 | Rubia | Human Brain Mapping | GNGT | 1. Go/no-go task, adults | 11 |
| 2007 | Aron | Journal of Neuroscience | SST | 1. Critical stop inhibit versus critical go | 38 |
| 2007 | Chevrier | Human Brain Mapping | SST | 1. Successful stop-phase activities | 3 |
| 2007 | Kaladjian | Schizophrenia Research | GNGT | 1. Correct no-go trials versus correct go trials, healthy controls | 11 |
| 2007 | Langenecker | Biological Psychiatry | GNGT | 1. Activation in response to correct rejections, healthy controls | 8 |
| 2007 | Leung | Journal of Neuroscience | SST | 1. Conjunction stop–go | 7 |
| 2007 | Roth | Biological Psychiatry | GNGT | 1. Response inhibition, normals | 13 |
| 2008 | Falconer | Journal of Psychiatry and Neuroscience | GNGT | 1. No-go − go, normals | 6 |
| 2008 | Marco-Pallares | Journal of Cognitive Neuroscience | SST | 1. Inhibited trials versus correct responses | 10 |
| 2008 | McNab | Neuropsychologia | GNGT | 1. No-go > oddball (go/no-go) | 65 |
| 2. No-go > go | |||||
| 3. Stop > oddball (stop task) | |||||
| 4. Stop > go | |||||
| 2008 | Xue | Cerebral Cortex | SST | 1. Stop Inhibit–go, manual | 13 |
| 2008 | Zheng | Journal of Cognitive Neuroscience | GNGT, SST | 1. No-go − go (go/no-go) | 18 |
| 2. Stop − go (stop signal) | |||||
| 2009 | Baglio | Neurobiology of Aging | GNGT | 1. No-go versus fixation, healthy controls | 5 |
| 2009 | Cai | Brain Research | SST | 1. Color SS–go | 22 |
| 2. Orientation SS–go | |||||
| 2009 | Chikazoe | Cerebral Cortex | GNGT | 1. No-go versus frequent–go | 104 |
| 2. No-go versus infrequent–go | |||||
| 2009 | Chikazoe | Journal of Neuroscience | SST | 1. Stop versus uncertain–go | 73 |
| 2. Stop versus uncertain–go but not uncertain–go versus certain–go | |||||
| 2009 | Kaladjian | Bipolar Disorders | GNGT | 1. No-go versus go, healthy controls, T1 | 20 |
| 2. No-go versus go, healthy controls, T2 | |||||
| 2009 | Kaladjian | Psychiatry Research | GNGT | 1. No-go > go, correct responses, healthy controls | 16 |
| 2009 | Mazzola-Pomietto | Journal of Psychiatric Research | GNGT | 1. Significant with-group activation during response inhibition in healthy comparison subjects | 7 |
| 1998 | Konishi | European Journal of Neuroscience | GNGT | 1. No–go dominant foci | 19 |
| 2009 | Padmala | Neuropsychologia | SST | 1. Successful > Unsuccessful | 14 |
| 2009 | Welander-Vatn | Bipolar Disorders | GNGT | 1. Go/no-go > fixation, healthy controls | 12 |
| 2010 | Boecker | Human Brain Mapping | SST | 1. Successful inhibit–go | 13 |
| 2010 | Boehler | NeuroImage | SST | 1. SST SR > GT SR | 33 |
| 2. SST SR > UST SR | |||||
| 2010 | Hendrick | PLoS onE | SST | 1. Stop compared with go trials | 18 |
| 2010 | Passarotti | Psychiatry Research | SST | 1. Stop > go, healthy controls | 5 |
| 2010 | Sharp | Proceedings of the National Academy of Sciences USA | SST | 1. Stop correct against go | 16 |
| 2. Stop correct against continue | |||||
| 2010 | Simoes-Franklin | Human Brain Mapping | GNGT | 1. Neutral go/no-go versus punishment go/no-go, successful Inhibitions | 17 |
| 2011 | Cai | PLoS One | SST | 1. SST–all stop > SST–go | 63 |
| 2. SST–successful stop > SST–go | |||||
| 3. SST–successful stop > SST–unsuccessful stop | |||||
| 2011 | Jahfari | Journal of Neuroscience | SST | 1. Successful stop versus go none | 7 |
| 2011 | Sagaspe | NeuroImage | SST | 1. (Stop inhibit + stop respond) > go | 39 |
| 2. Stop inhibit > stop respond | |||||
| 2012 | de Wit | American Journal of Psychiatry | SST | 1. Main effect of inhibition, comparison subjects | 10 |
| 2012 | Hendrick | Obesity | SST | 1. Stop compared with go trials for lean subjects | 23 |
| 2012 | Hughes | Biological Psychiatry | SST | 1. Stops > baseline, controls | 5 |
| 2012 | Sebastian | Psychiatry Research: NeuroImaging | GNGT, SST | 1. No-go/go, control group | 47 |
| 2. Stop–go, control group | |||||
| 2012 | Swann | NeuroImage | SST | 1. MS–SS versus MS–go | 18 |
| 2012 | Townsend | Bipolar Disorders | GNGT | 1. No-go − go, healthy controls | 24 |
| 2013 | Cai | Human Brain Mapping | SST | 1. Conjunction stop–go | 33 |
| 2. Conjunction successful stop–Go | |||||
| 2013 | Hughes | Behavioural Brain Research | SST | 1. Stop inhibit > baseline | 6 |
| 2. Stop inhibit > stop respond | |||||
| 2013 | Montojo | Cerebral Cortex | SST | 1. Successful stopping, controls | 5 |
| 2013 | Tabu | NeuroImage | SST | 1. Stop success versus go in hand | 15 |
| 2014 | Berkman | Journal of Neuroscience | SST | 1. Stop > go at T1 | 31 |
| 2014 | Congdon | Psychiatry Research: NeuroImaging | SST | 1. Stop inhibit–go, control | 4 |
| 2014 | Schel | Frontiers in Human Neuroscience | SST | 1. Stop successful > go successful | 13 |
NST, Not-Stop task; SS, Successful Stop; T1, Time point 1; T2, Time point 2; SST_SR, Successful Stop trial in Stop-relevant block; GT_SR, Go trial in Stop-relevant block; UST_SR, Unsuccessful Stop trial in Stop-relevant block; MS, Maybe Stop.
GNGT studies were identified using Sleuth 2.2 (http://www.brainmap.org/sleuth/) and the BrainMap database (www.brainmap.org). The search key indices included the following: “Experiments → Imaging Modality → is → fMRI,” “Subjects → Diagnosis → is → Normal,” “Experiments → Paradigm Class → is → Go/No-Go,” and “Experiments → Behavioral Domain → is → Action → Inhibition.” By early March 2014, Sleuth returned 81 studies matching the search criteria. These studies were then screened using inclusion criteria noted above, and 36 GNGT studies were included in the meta-analysis. Because SST studies were not labeled as such in BrainMap, we used PubMed (www.ncbi.nlm.nih.gov/pubmed/) and identified 158 manuscripts (as of March 2014) using the key words “fMRI AND Stop-signal.” Using the inclusion criteria noted above, 34 SST studies were selected for inclusion in the meta-analysis.
Meta-analysis of the 36 GNGT and 34 SST studies was conducted using GingerALE (http://www.brainmap.org/ale/). First, we selected all the contrasts that could probe inhibitory control in each study entered in the meta-analysis (Table 1). Activation coordinates from all selected contrasts were converted into MNI space. Each coordinate was modeled by a 3D Gaussian distribution, and the ALE value for each voxel in the brain was calculated. Next, a permutation procedure was applied to create a null distribution of the ALE value at each voxel from which the p value of ALE at each voxel was computed. Last, an activation threshold was applied to generate an output map [p < 0.05, false discovery rate (FDR) corrected].
To obtain the final activation VOI of the right frontal opercular regions, a logical “AND” operation was applied to the ALE output map and the combined anatomical templates from the Harvard–Oxford 25% Probabilistic Cortical Atlas, including the right insula cortex, right fronto-operculum cortex, right inferior frontal gyrus (IFG), pars opercularis, and pars triangularis (http://www.cma.mgh.harvard.edu/).
fMRI data acquisition
We used three fMRI datasets in this study: two involved participants performing inhibitory control tasks in the scanner and the third involved resting-state fMRI. All participants were normal healthy adults.
Inhibitory control tasks.
Two previously published open-source SST datasets were used in this study. The SST dataset 1 (SST1; Xue et al., 2008) was obtained from a public fMRI database, OpenfMRI (http://openfmri.org, Texas Advanced Computing Center, University of Texas at Austin). The SST dataset 2 (SST2; Zhang and Li, 2012) was acquired at Yale University. To control the effect of outlier behavior, we screened subjects' performance: response accuracy in Go and Stop trials in SST1 and SST2. An outlier is defined as a data point whose value is >1.5 times the interquartile range (IQR) above the third quartile or <1.5 times IQR below the first quartile. Among 21 subjects in the SST1, one subject was excluded because of behavioral outliers and two subjects were excluded for violating head-movement criteria (see below). Among 59 subjects in the SST2, seven subjects were excluded because of behavioral outliers. In the final analysis, 18 subjects (6 males, 12 females) were included in the SST1, and 52 subjects (26 males, 26 females) were included in the SST2. Both studies used fast-jittered event-related task design, and TR of 2000 ms in fMRI data acquisition. Details of task design and data acquisition for the SST1 and SST2 can be found in the original publications (Xue et al., 2008; Zhang and Li, 2012). Here we summarize key aspects of the experimental design.
In SST1 (Xue et al., 2008), subjects (aged 18–39 years) made button-press responses to a letter “T” or “D” (Go signal). In 25% of trials, the letter was followed by a beep (Stop signal) and subjects attempted to stop their responses. The stop-signal delay (SSD) in the practice session was determined using a stepwise procedure. Eight SSDs were generated based on the average SSD in the practice session ± 60/20 ms and used in the fMRI session.
In SST2 (Zhang and Li, 2012), subjects (aged 22–42 years) made button-press responses to a circle (Go signal), which was occasionally (∼25% of trials) followed by an “X” (Stop signal). If the Stop signal was presented, subjects needed to stop their responses. The SSD varied dynamically in a staircase procedure. If the subject successfully stopped on a Stop trial, the SSD increased by 67 ms on the next Stop trial. If the subject failed to stop on a Stop trial, the SSD decreased by 67 ms on the next Stop trial.
Resting state fMRI.
Resting-state MRI data were acquired from 21 participants (aged 19–22 years) from Stanford University and neighboring community colleges. Participants were instructed to keep their eyes closed and not move for the duration of the 8 min scan. Before scanning, the experimenter emphasized the importance of staying awake while keeping eyes closed. Participants were monitored during scanning and after scanning, they were asked whether they fell asleep during the scan. All participants confirmed having stayed awake. Functional images were acquired on a 3 T GE Signa scanner (GE Healthcare) using a custom-built head coil. Head movement was minimized during scanning by a comfortable custom-built restraint. A total of 29 axial slices (4.0 mm thickness, 0.5 mm skip) parallel to the anterior commissure–posterior commissure line and covering the whole brain were imaged with a temporal resolution of 2 s using a T2*-weighted gradient echo spiral in–out pulse sequence (Glover and Law, 2001), with the following parameters: TR, 2000 ms; TE, 30 ms; flip angle, 80°; FOV, 20 cm; matrix, 64 × 64; and interleaved. To reduce blurring and signal loss arising from field inhomogeneities, an automated high-order shimming method based on spiral acquisitions was used before fMRI acquisition.
Preprocessing of fMRI data
fMRI data were processed using SPM8 (http://www.fil.ion.ucl.ac.uk/spm/software/spm8). Similar preprocessing steps were applied to both task and resting-state fMRI data. The preprocessing includes realignment, slice-timing correction, normalization to the MNI space, and smoothing performed using a 5 mm full-width half-maximum Gaussian kernel to decrease spatial noise. Subjects whose maximum displacement in any run is >1 voxel were excluded from data analysis. The time series at each voxel from resting-state fMRI data were filtered using a bandpass filter (0.008 Hz < f < 0.1 Hz). Linear trend, temporal, and global mean were regressed out of each voxel time series.
Task fMRI general linear model and task-evoked hemodynamic response
A general linear model (GLM) analysis was conducted in SST1 and SST2. Six motion parameters were entered as covariates of no interest. To capture regional variation in hemodynamic response shape, we modeled task-evoked hemodynamic response at each voxel using the canonical hemodynamic response function (HRF), as well as its temporal and dispersion derivatives (Friston et al., 1998) for the four tasks of interest, i.e., Go, Go error, and Successful and Unsuccessful Stop trials. We then estimated the three β values corresponding to the basis functions (β1, canonical HRF; β2, temporal derivative; β3, dispersion derivative) for each task. Finally, task-evoked hemodynamic response profiles were derived for each voxel in the VOI for each subject, for each trial type using the three estimated β values combined with the corresponding basis functions. To combine the three estimated β values to characterize the hemodynamic response, we used the three hemodynamic basis functions implemented in SPM (β1, canonical HRF; β2, temporal derivative; β3, dispersion derivative), multiplied each basis function with its corresponding (estimated) β weight, and then summed them.
Functional parcellation of fronto-opercular cortex using resting-state fMRI
We used a novel consensus clustering evidence accumulation (CC-EAC) method to find stable and robust clusters in a given brain region using intrinsic brain activity as features. Conventional clustering methods, such as K-means and spectral clustering, are sensitive to (1) their initialization, (2) the choice of the method-specific parameters, and (3) the number of clusters sought from the method. CC-EAC identifies the stable and optimal number of clusters that are robust to these parameters. Let Ys = {yis}i=1M be the features of voxels with the ROI, where M is the number of voxels in the ROI, and yis is the feature vector. For resting-state fMRI, we used two types of features in parcellation separately to examine stability and similarity of parcellation, including (1) voxelwise time series within the VOI (termed here as VOI time series) and (2) intrinsic functional connectivity between each voxel in the VOI and each voxel in the brain but outside the VOI (Fig. 2). yis consists of T observations at each voxel in the mask for a given subject s, and S is the total number of subjects. In step 1, we generated 100 different partitions of data Ys from each subject for each k ranging from 2 to 10 using different initializations of K-means. In step 2, we computed a coassociation matrix C, for each k and S that finds similarities between these 100 different partitions. The coassociation matrix C is a M × M matrix with (i, j)-th entry defined as follows:
 |
where, nij is the number of times the pair of voxels i and j are clustered together in N = 100 partitions of the data for a given k and S. An entry in C(i, j) close to 1 indicates that these pairs of voxels are clustered together consistently across the N partitions, and the opposite is true when C(i, j) is close to 0. In step 3, we applied hierarchical clustering with average linkage using C as the similarity matrix for each k and S. In step 4, we computed two cluster similarity metrics—probability rand index (PRI) (Carpineto and Romano, 2012) and modified silhouette (Bellec et al., 2010)—to quantify the similarity of the clusters across all the subjects S for a given k. We chose the optimal number of clusters (k*) for which the cluster similarity measure is the maximum. In step 5, we computed the group-level average coassociation matrix by averaging the coassociation matrices, corresponding to k = k*, across all the S subjects. We then obtained the k* stable clusters at the group level by applying the hierarchical clustering method with average linkage using this coassociation as on the similarity matrix. We then computed the stability of each voxel belonging to a cluster using the method suggested previously (Bellec et al., 2010).
Functional parcellation of fronto-opercular cortex using task-evoked fMRI response profiles
To conduct parcellation on task fMRI, task-evoked hemodynamic response profiles during Successful Stop trials were used as features in the analysis (Fig. 3). All other procedures were similar to those used for parcellation in resting-state fMRI.
Stability-thresholded clusters within fronto-opercular clusters
The rAI and rIFC clusters obtained from parcellation have different sizes. To facilitate comparisons between them, the rAI and rIFC clusters were thresholded based on the stability maps. As mentioned in the previous section, CC-EAC computes stability maps for each cluster that quantifies the stability of the voxel being assigned to a cluster. A thresholded cluster was then obtained by only including the top 10, 20, 30, or 40% stable voxels in the VOI for being in that cluster.
Because the 40% stability-thresholded clusters had the highest similarity among parcellation based on different features and datasets, we used this threshold to investigate the functional characteristics of each cluster. For task fMRI analyses, the clusters were thresholded based on stability maps obtained from parcellation in the corresponding task fMRI datasets. For resting-state fMRI analysis, the clusters were thresholded based on stability maps obtained from parcellation using intrinsic functional connectivity in the resting-state fMRI dataset.
Intrinsic functional connectivity of fronto-opercular clusters
To investigate the functional circuits associated with individual fronto-opercular clusters, we conducted seed-based functional connectivity analysis (Habas et al., 2009; Uddin et al., 2010). First, time series across all the voxels within the thresholded cluster was extracted and averaged. The resulting averaged time series was then used as a covariate of interest in a linear regression of the whole-brain analysis. A global time series, computed across all brain voxels, along with six motion parameters were used as additional covariates to remove confounding effects of physiological noise and participant movement. Linear regression was conducted at the individual subject level. A group map was generated using one-sample t tests [p < 0.05, familywise error (FWE) corrected]. Last, a paired t test was applied at the group-level analysis to examine which brain region is more correlated with one cluster than the other, at an FDR-corrected threshold of p < 0.05.
Task-evoked functional connectivity of fronto-opercular clusters
Task-evoked functional connectivity of each fronto-opercular cluster obtained from the parcellation analysis was examined using a β-series correlation approach (Gazzaley et al., 2004; Rissman et al., 2004; Pa et al., 2014). The same analyses were conducted for Successful and Unsuccessful Stop trials in both the SST1 and SST2 datasets. The β-series correlation method examines functional correlation between two brain regions in terms of their trial-by-trial activation variability. In contrast to the conventional GLM that models the averaged task-evoked hemodynamic response across all trials of interest, in β-series correlation analysis, we included a unique canonical HRF regressor for each trial of interest in the GLM. As a result, we obtained a series of β estimates for each voxel in the brain corresponding to all trials under each task (i.e., Successful and Unsuccessful Stop). The whole-brain correlation map for each subject was then obtained by calculating the correlation between the averaged β-series in each cluster and the β-series in all voxels in the brain, followed by a Fisher's r-to-z transformation. Last, a paired t test was applied to examine differences of the functional connectivity patterns of the two clusters on both Successful and Unsuccessful, using an FDR-corrected threshold of p < 0.05.
Comparison of intrinsic and task-evoked functional connectivity
To examine whether functional connectivity pattern differences between the rAI and rIFC are similar between resting and task states, we computed a Pearson correlation between intrinsic functional connectivity differences of the two clusters and task-evoked functional connectivity differences of the two clusters.
Task-evoked response profiles of fronto-opercular clusters
To further investigate the functional characteristics of each cluster, we computed the task-evoked hemodynamic responses on Go and Successful and Unsuccessful Stop trials and examined the change of β1 (corresponding to the amplitude of canonical HRF profiles) on Successful and Unsuccessful Stop relative to Go trials. A 2 (rAI vs. rIFC) × 2 (Successful vs. Unsuccessful Stop) ANOVA and t tests were conducted to examine distinct task-evoked response profiles in the rAI and rIFC.
Classification and cross-validation of rAI and rIFC response profiles
We examined whether response profiles in each cluster could differentiate between Successful and Unsuccessful Stop trials. To do so, we applied multivariate classification using the linear support vector machine algorithm (C = 1) from an open-source library, LIBSVM (for Library for Support Vector Machines; http://www.csie.ntu.edu.tw/∼cjlin/libsvm/) as the classification tool. The contrast images of Successful and Unsuccessful Stop in SST1 and SST2 were used as features in the classification analysis. The performance of classification was evaluated using leave-one-subject-out cross-validation procedure. In this procedure, a pair of Successful and Unsuccessful Stop images from one subject was selected as a test set. The rest of the data was used to train a classifier, which was then applied to the test set to predict whether the images are Successful or Unsuccessful Stop. This procedure was repeated N times (N is the number of subjects in each dataset), with each subject's data used exactly once as a test set. The average prediction accuracy across all test sets is termed as the cross-validation accuracy. A permutation procedure was used to infer statistical significance of the cross-validation accuracy for each cluster and the accuracy difference between clusters in each dataset. Specifically, in each permutation, data labels (Successful vs. Unsuccessful Stop) were randomly switched. Cross-validation accuracies for each cluster and accuracy differences between clusters from 1000 permutations were used to construct the empirical null distribution in each dataset from which p values for each cluster's cross-validation accuracy and accuracy difference between clusters were obtained.
Relating task-evoked response profiles to individual abilities in inhibitory control
To investigate brain–behavior relationships, we applied multivariate regression analysis with robust machine learning-based cross-validation techniques to predict individual inhibitory control ability (Uddin et al., 2013). Activation level on Stop trials in voxels in each cluster was used as the predictor variable. Inhibitory control ability was measured with the stop-signal reaction time (SSRT), which was estimated based on the race model (Logan et al., 1984; Verbruggen and Logan, 2008). We used Lasso and elastic-net regularized GLMs (Glmnet), a state-of-the-art sparse regression algorithm (http://web.stanford.edu/∼hastie/glmnet_matlab). We used Glmnet approach because features in the input matrix (number of voxels in each cluster) outnumber the observation in the response vector (number of subjects) and conventional methods for regression would result in overfitting. The Glmnet algorithm used here overcomes this problem by using regularization (Hastie et al., 2009). The performance of multivariate regression analysis was evaluated using a leave-one-out cross-validation procedure. Data were divided into N folds (e.g., N = 18 for SST1 and N = 52 for SST2). One fold was selected as a test set. The rest of the folds were used to train a classifier, which was then applied to the test set to predict SSRTs. This procedure was repeated N times, with each subject's data used exactly once as a test set. R2 was calculated based on predicted and observed SSRTs. A permutation procedure was used for statistical inference. In each permutation, the observations were randomly shuffled, and predictions were made based on shuffled observations and selected regression models. R2 from 1000 permutations were used to construct the empirical null distributions from which p values for the R2 of each cluster and R2 difference between clusters were obtained.
Results
Meta-analysis of 70 published inhibitory control tasks
We used meta-analysis to identify the right fronto-opercular regions that are consistently activated in inhibitory control. To do so, we first identified 70 published fMRI studies of the GNGT and SST. Meta-analyses of these studies using ALE (Eickhoff et al., 2009, 2012) revealed significant clusters in the anterior insula (AI), inferior frontal cortex (IFC), dorsal lateral prefrontal cortex (PFC), dorsomedial PFC, anterior cingulate cortex (ACC), posterior parietal cortex (PPC), and basal ganglia during inhibitory control (p < 0.05, FDR corrected; Fig. 4a). The most significant activation peak was found in the rAI (Table 2). ALE clusters in the IFC was right hemisphere dominant, consistent with its highlighted role in inhibitory control (Garavan et al., 1999; Levy and Wagner, 2011; Aron et al., 2014). A VOI encompassing the right fronto-opercular cortex was created by applying a logical “AND” operation between an anatomical mask encompassing the right insula cortex, right fronto-operculum cortex, right IFG, pars opercularis, and pars triangularis (Fig. 4b) and the thresholded ALE map. The final VOI consisted of 1648 voxels (the VOI is shown in cyan in Fig. 4c).
Figure 4.
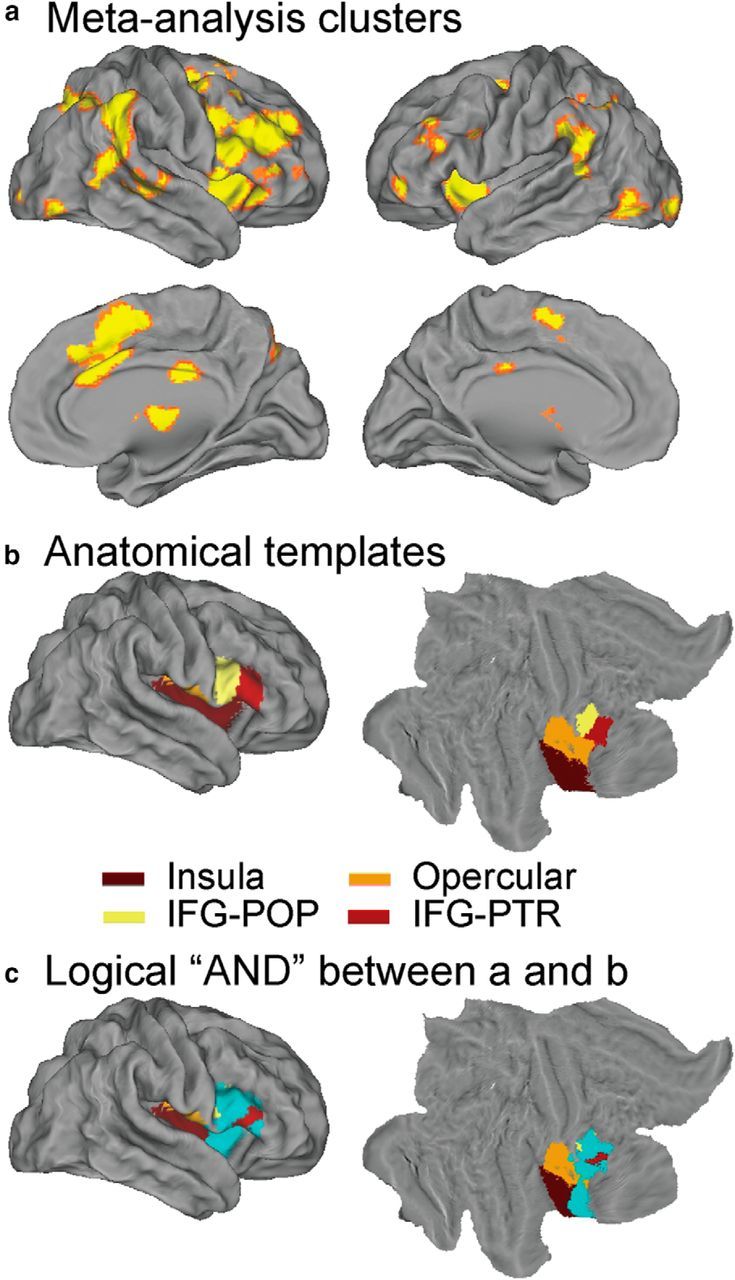
Meta-analysis results, anatomical mask, and fronto-opercular cortex VOI. a, ALE map of significant activation during inhibitory control (p < 0.05, FDR corrected). b, Mask based on anatomical templates of insular cortex, opercular cortex, IFG–pars opercularis (IFG-POP) and IFG–pars triangularis (IFG-PTR). c, Right fronto-opercular cortex VOI generated by applying a logical “AND” operation on the ALE map and anatomical templates. The VOI is shown in cyan.
Table 2.
Meta-analysis results (p < 0.05, FDR corrected)
| Cluster | Region | Volume (mm3) | Extreme value | MNI coordinates |
||
|---|---|---|---|---|---|---|
| x | y | Z | ||||
| 1 | Right insular cortex | 31,992 | 0.084 | 38 | 20 | −4 |
| Right insular cortex | 0.084 | 34 | 22 | −6 | ||
| Right precentral gyrus | 0.056 | 46 | 10 | 30 | ||
| Right IFG | 0.053 | 50 | 16 | 18 | ||
| Right frontal pole | 0.050 | 42 | 38 | 20 | ||
| Right frontal pole | 0.047 | 28 | 50 | 30 | ||
| Right MFG | 0.043 | 50 | 24 | 28 | ||
| Right frontal pole | 0.023 | 48 | 44 | 2 | ||
| 2 | Right paracingulate gyrus | 17,128 | 0.058 | 4 | 18 | 46 |
| Right superior frontal gyrus | 0.058 | 10 | 14 | 60 | ||
| Right paracingulate gyrus | 0.057 | 4 | 28 | 36 | ||
| Left superior frontal gyrus | 0.040 | −2 | 4 | 60 | ||
| Right MFG | 0.037 | 28 | 2 | 50 | ||
| Right superior frontal gyrus | 0.033 | 24 | −4 | 60 | ||
| Right superior frontal gyrus | 0.021 | 22 | 6 | 60 | ||
| 3 | Right SMG | 15,288 | 0.061 | 52 | −42 | 38 |
| Right SMG | 0.044 | 62 | −42 | 24 | ||
| Right SMG | 0.041 | 40 | −44 | 46 | ||
| Right superior occipital gyrus | 0.038 | 38 | −58 | 46 | ||
| Right superior occipital gyrus | 0.037 | 26 | −66 | 48 | ||
| Right AG | 0.034 | 52 | −48 | 14 | ||
| Right superior occipital gyrus | 0.031 | 30 | −70 | 34 | ||
| Right superior occipital gyrus | 0.029 | 14 | −70 | 52 | ||
| Right middle temporal gyrus | 0.026 | 58 | −54 | 2 | ||
| 4 | Left insular cortex | 11,304 | 0.074 | −40 | 16 | −6 |
| Left insular cortex | 0.064 | −32 | 20 | 2 | ||
| Left pallidum | 0.047 | −14 | 4 | 6 | ||
| 5 | Right caudate | 9120 | 0.048 | 14 | 8 | 6 |
| Right thalamus | 0.048 | 10 | −10 | 2 | ||
| Right putamen | 0.042 | 20 | 10 | −2 | ||
| Right thalamus | 0.037 | 4 | −20 | −4 | ||
| Left thalamus | 0.033 | −6 | −16 | −6 | ||
| 6 | Left SMG | 6904 | 0.039 | −58 | −48 | 28 |
| Left SMG | 0.031 | −48 | −40 | 46 | ||
| Left SPL | 0.029 | −42 | −48 | 52 | ||
| Left SMG | 0.029 | −56 | −44 | 20 | ||
| Left AG | 0.027 | −46 | −60 | 50 | ||
| Left SMG | 0.027 | −54 | −44 | 14 | ||
| Left SMG | 0.026 | −62 | −48 | 10 | ||
| 7 | Right STG | 3816 | 0.036 | 62 | −32 | 2 |
| Right STG | 0.035 | 62 | −18 | 0 | ||
| Right STG | 0.034 | 52 | −26 | −2 | ||
| 8 | Left fusiform gyrus | 2400 | 0.045 | −40 | −64 | −10 |
| Left inferior occipital gyrus | 0.023 | −44 | −78 | −10 | ||
| 9 | Right posterior cingulate cortex | 1528 | 0.037 | 2 | −24 | 32 |
| 10 | Left frontal pole | 1440 | 0.025 | −36 | 38 | 34 |
| Left MFG | 0.025 | −46 | 32 | 20 | ||
| Left MFG | 0.024 | −38 | 36 | 24 | ||
| Left frontal pole | 0.024 | −50 | 38 | 14 | ||
| Left frontal pole | 0.022 | −44 | 44 | 22 | ||
| 11 | Left superior occipital gyrus | 888 | 0.029 | −28 | −62 | 42 |
| Left superior occipital gyrus | 0.028 | −26 | −64 | 48 | ||
| 12 | Left inferior occipital gyrus | 800 | 0.034 | −28 | −94 | −10 |
| 13 | Right inferior occipital gyrus | 560 | 0.026 | 48 | −74 | −12 |
| 14 | Left MFG | 552 | 0.033 | −26 | −4 | 54 |
| 15 | Left frontal pole | 432 | 0.026 | −40 | 52 | −4 |
| 16 | Left IFG | 384 | 0.027 | −44 | 12 | 28 |
| 17 | Right occipital pole | 280 | 0.027 | 30 | −96 | −4 |
| 18 | Right frontal pole | 232 | 0.024 | 34 | 56 | −2 |
| 19 | Right MFG | 232 | 0.025 | 38 | 20 | 48 |
Note that the rAI cluster encompasses the anterior–dorsal cognitive subdivision of the insula as opposed to its anterior–ventral and posterior subdivisions, which have been implicated in arousal, affective, and interoceptive processes (Critchley et al., 2005; Craig, 2009; Menon and Uddin, 2010; Cocchi et al., 2012; Chang et al., 2013).
Functional parcellation of right fronto-opercular cortex using resting-state fMRI
To examine whether the VOI in the right fronto-opercular cortex contains multiple functionally heterogeneous subdivisions, we conducted parcellation analyses using the novel consensus clustering technique. The parcellation was first conducted on resting-state fMRI data from the Stanford cohort. In this case, resting-state time series was extracted from the VOI identified above. Clustering was performed using voxelwise time series profiles, and the optimal number of clusters was determined using PRI and modified silhouette measures (Fred and Jain, 2005; Bellec et al., 2010). (S. Ryali, T. Chen, A. Padmanabhan, W. Cai, and V. Menon, unpublished observations under the title “Development and validation of consensus clustering-based framework for brain segmentation using regional resting fMRI”). We also conducted parcellation using intrinsic connectivity as features. We found that the optimal number of clusters is two for both parcellations based on VOI time series and intrinsic functional connectivity (Fig. 5a,b).
Figure 5.
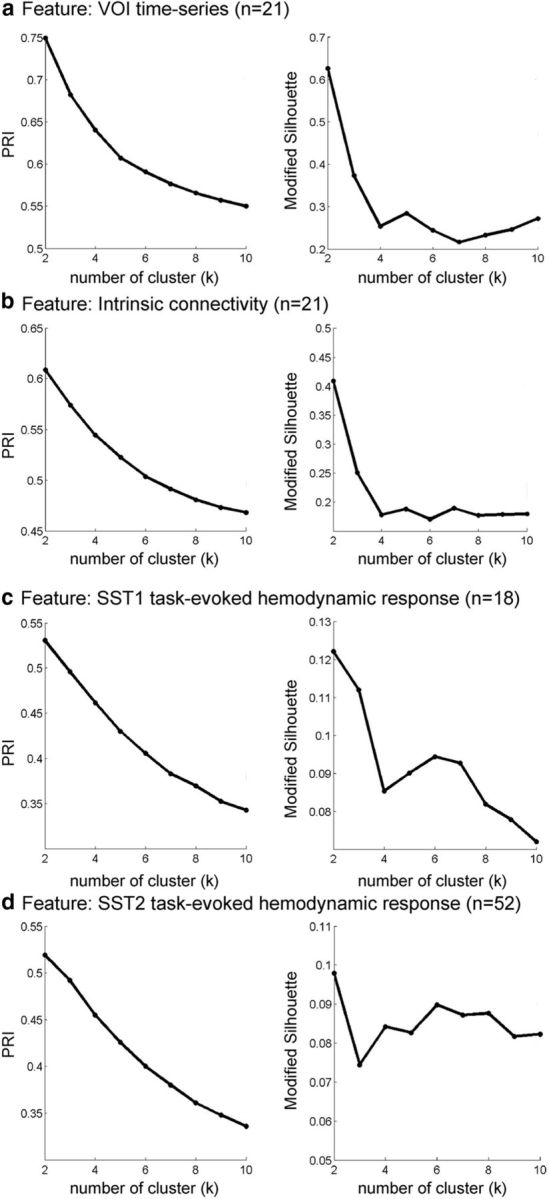
Similarity of clusters as a function of number of clusters across four different features. Two stable clusters were identified in each case. The four features used in the clustering procedure were as follows: a, VOI time series; b, intrinsic connectivity; and c, task-evoked hemodynamic response on Successful Stop (SuccStop) trials in SST1; and d, task-evoked hemodynamic response on SuccStop trials in SST2. Similarity of clusters was determined using PRI and modified silhouette for k = 2–10 clusters.
We also examined the effects of additional preprocessing steps on this parcellation. Time series at each voxel were regressed against white matter signals and six head-movement alignment parameters and their first derivatives. We found highly similar parcellation results, with a consistency of 94% and above.
Functional parcellation of right fronto-opercular cortex using task-evoked fMRI response profiles
To examine whether task-evoked hemodynamic responses can be used for functional parcellation, we used the same consensus clustering method to demarcate the functional subdivisions of the right fronto-opercular cortex on two task fMRI datasets (SST1 and SST2) from two independent cohorts of participants. In this case, task-evoked, stimulus-specific, response profiles obtained from the SST1 and SST2 cohorts were analyzed independently using the VOI identified above. Clustering was performed using voxelwise profiles of stimulus-evoked hemodynamic responses on Successful Stop trial, and the optimal number of clusters was determined using PRI and modified silhouette measures. These measures consistently identified the optimal number of clusters to be two in both the SST1 and SST2 datasets (Fig. 5c,d).
Comparison of functional clusters identified using task-evoked and resting-state fMRI
The left panels of Figure 6 show the two clusters obtained by our consensus clustering analysis (k = 2) on the resting-state fMRI dataset using VOI time series (Figs. 6a) and intrinsic connectivity (Fig. 6b) as features and the task fMRI dataset SST1 (Fig. 6c) and SST2 (Fig. 6d) using task-evoked hemodynamic response as features. The middle panel shows the histograms of stability values across voxels. The right panels of Figure 4 show the stability-thresholded clusters (see Materials and Methods and below). Parcellation based on different features and datasets identified two clusters with a similar spatial layout (Fig. 6). One cluster is mainly composed of voxels in the rAI (color coded with green), whereas the other is composed predominantly of voxels in the rIFC (color coded with red).
Figure 6.

Functional parcellation of fronto-opercular cortex VOI into rAI and rIFC clusters using four different features. The four features used in the clustering procedure were as follows: a, VOI time series; b, intrinsic connectivity; c, task-evoked hemodynamic response on Successful Stop (SuccStop) trials in SST1; and d, task-evoked hemodynamic response on SuccStop trials in SST2. The two leftmost columns display volume and surface rendering of the two clusters encompassing the rAI and rIFC. The middle column shows histograms demonstrating the stability of voxel assignment to each cluster within the VOI. The two rightmost columns display two thresholded clusters obtained by including voxels in the VOI that have the top 10, 20, 30, or 40% stability for assignment into each cluster.
To evaluate whether different feature-based parcellations converge, we examined the similarity of the functional subdivisions through visual inspection and quantitative analysis. Two parcellated clusters obtained using different features from independent datasets were similar, but some differences existed (Fig. 6, left panels). For example, the anterior part of rIFC–pars triangularis was parcellated into the rIFC cluster on the basis of task-evoked hemodynamic response on Successful Stop trials in SST2 and VOI time series and intrinsic connectivity in resting-state fMRI but not in the parcellation obtained using task-evoked hemodynamic response on Successful Stop trials in SST1. This could be attributable to the small sample size in SST1 relative to SST2. We also observed similar stability-thresholded clusters from parcellation obtained using different features from independent datasets (Fig. 6, two right panels).
We quantified the similarity of clusters obtained using different features and datasets. First, parcellation based on different features and datasets produced clusters with similar sizes. The rAI clusters parcellated from task-evoked hemodynamic response on Successful Stop trials in SST1 and SST2, as well as VOI time series and intrinsic connectivity in resting-state fMRI, each comprising 48, 48, 46, and 46% of total voxels in the VOI. Second, we defined the similarity as the proportion of overlapping voxels in the rAI or rIFC clusters produced from parcellations using different features from different datasets. We examined the similarity between parcellations obtained using the same type of feature from different datasets (i.e., task-evoked hemodynamic response on Successful Stop trials in SST1 and SST2), between parcellations obtained using different features from the same dataset (i.e., VOI time series and intrinsic connectivity from resting-state fMRI), and among all the four parcellations. We found that the similarity is ∼76% between clusters obtained using task-evoked hemodynamic response on Successful Stop trials from SST1 and SST2, >96% between the clusters obtained using VOI time series and intrinsic connectivity in resting-state fMRI, and >70% among all the four parcellations for both the rAI and rIFC (Fig. 7a). Third, we further examined similarity between the stability-thresholded clusters. We observed an increase in similarity between different parcellations as the thresholds for stability were decreased. At the threshold of top 40% stability, the similarities between parcellations obtained using VOI time series and intrinsic connectivity from resting-state fMRI were 89% for the rAI and 98% for the rIFC, the similarity between the functional subdivisions obtained using task-evoked hemodynamic response on Successful Stop trials in SST1 and SST2 were 83% for the rAI and 77% for the rIFC, and the similarities across all parcellations were 68% for the rAI and 70% for the rIFC (Fig. 7b).
Figure 7.
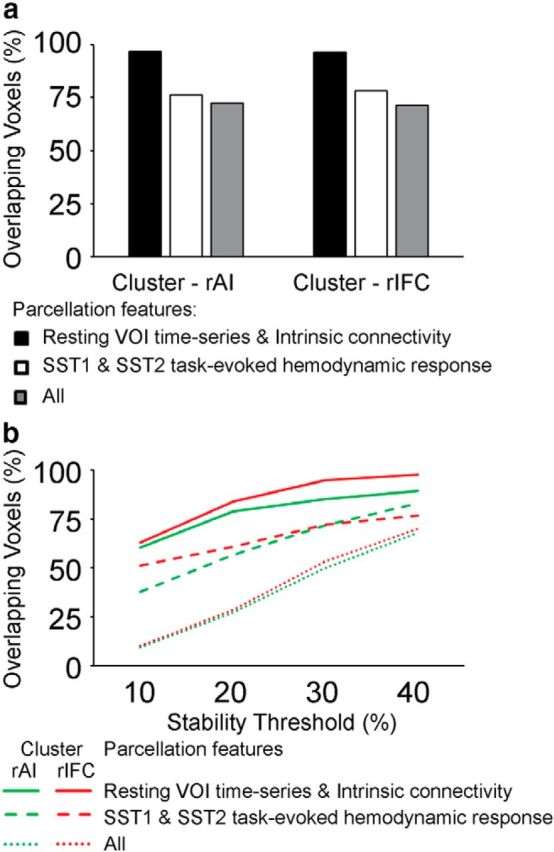
Overlap in clusters obtained using different features. a, Proportion of voxels that showed overlap between clusters obtained using VOI time series and intrinsic connectivity from resting-state fMRI (i), task-evoked hemodynamic response on Successful Stop (SuccStop) trials in SST1 and SST2 (ii), and both resting-state and task-evoked measures (iii). b, Proportion of overlapped voxels between clusters as a function of stability threshold to parcellation features as in a.
Intrinsic functional connectivity of the rAI and rIFC
Intrinsic connectivity analysis revealed that the rAI cluster had significant positive correlation with bilateral insulae, ACC extending to the supplementary motor area, frontal pole, supramarginal gyrus (SMG), caudate, putamen, and thalamus, whereas the rIFC cluster had significantly positive correlation with bilateral IFG, middle frontal gyrus (MFG), frontal pole, pre-SMA (preSMA), SMG, superior parietal lobule (SPL), caudate, putamen, and thalamus (all p values <0.05, FWE corrected; Fig. 8a). Importantly, the rAI cluster had significantly greater correlation with the bilateral insulae, ACC, caudate, and putamen than the rIFC cluster, whereas the rIFC cluster had significantly greater correlation with the IFG, MFG, preSMA, SMG, angular gyrus (AG), and SPL than the rAI cluster (all p values <0.05, FDR corrected). The patterns of intrinsic connectivity were similar regardless of features or datasets used for parcellation and stability thresholds used for generating clusters.
Figure 8.

Intrinsic and task-evoked functional connectivity of the rAI and rIFC. a, Intrinsic connectivity of the rAI and rIFC clusters (p < 0.05, FWE corrected) and difference in connectivity between the two clusters (p < 0.05, FDR corrected). b, Difference in task-evoked functional connectivity between the rAI and rIFC clusters during Successful Stop (SuccStop) and Unsuccessful Stop (UnsuccStop) trials in the SST1 and SST2 datasets (p < 0.05, FDR corrected). Clusters were obtained using Successful Stop trials and thresholded using the top 40% stability values, separately in each dataset (see Fig. 7). c, Similarity of intrinsic and task-evoked functional connectivity, quantified by the correlation between whole-brain connectivity differences between the rAI and rIFC clusters.
Task-evoked functional connectivity of the rAI and rIFC
To examine whether the rAI and rIFC clusters interact with different brain networks during inhibitory control, we conducted β-series correlation analysis to examine task-evoked functional connectivity. Figure 8b shows task-evoked functional connectivity on Successful and Unsuccessful Stop trials in SST1 and SST2. On Successful Stop trials, the rAI had significantly greater connectivity with insular cortex and ACC than the rIFC, whereas the rIFC had significantly greater functional connectivity with IFG, MFG, preSMA, SMG, and AG than the rAI in both the SST1 and SST2 (p < 0.05, FDR corrected). A similar pattern was observed on Unsuccessful Stop trials.
Interestingly, the intrinsic connectivity pattern of resting-state fMRI and the task-evoked functional connectivity pattern from SST1 and SST2 were similar. Figure 8c displays the relation between intrinsic connectivity difference between two clusters and task-evoked functional connectivity difference between two clusters. Intrinsic connectivity difference between two clusters was correlated with task-evoked functional connectivity difference between two clusters in SST1 [Successful (r = 0.61, p < 0.001) and Unsuccessful (r = 0.52, p < 0.001) Stop trials] and SST2 [Successful (r = 0.59, p < 0.001) and Unsuccessful (r = 0.39, p < 0.001) Stop trials]. Additionally, task-evoked functional connectivity difference between two clusters in SST1 was correlated with that in SST2 on Successful (r = 0.82, p < 0.001) and Unsuccessful (r = 0.45, p < 0.001) Stop trials. These results suggest a highly similar intrinsic and task-related functional connectivity.
Finally, we examined the similarity between intrinsic connectivity and task-evoked functional connectivity for each cluster separately. Intrinsic connectivity was correlated with task-evoked functional connectivity of the rAI in SST1 [Successful (r = 0.79, p < 0.001) and Unsuccessful (r = 0.74, p < 0.001) Stop trials] and in SST2 [Successful (r = 0.79, p < 0.001) and Unsuccessful (r = 0.32, p < 0.001) Stop trials]. Intrinsic connectivity was correlated with task-evoked functional connectivity of the rIFC in SST1 [Successful (r = 0.60, p < 0.001) and Unsuccessful (r = 0.57, p < 0.001) Stop trials] and in SST2 [Successful (r = 0.60, p < 0.001) and Unsuccessful (r = 0.26, p < 0.001) Stop trials].
Distinct task-evoked fMRI response profiles in rAI and rIFC
We used the functional subdivisions identified in the rAI and rIFC to investigate response profiles associated with Go and Successful and Unsuccessful Stop trials in SST1 and SST2 datasets. Figure 9 illustrates the fitted task-evoked response profiles of each cluster for Go and Successful and Unsuccessful Stop trials in SST1 and SST2. The rIFC clusters showed equivalent amplitude on Successful and Unsuccessful Stop trials in SST1 and SST2, whereas the rAI clusters showed higher amplitude elicited by Unsuccessful compared with Successful Stop in SST1 and SST2. This indicates that the rAI and rIFC clusters have dissociable task-evoked, stimulus-specific responses across different types of trials.
Figure 9.

Task-evoked hemodynamic response in the rAI and rIFC clusters. a, Response profiles for Go and Successful Stop and Unsuccessful Stop trials in the SST1 dataset. b, Response profiles for Go and Successful Stop (SuccStop) and Unsuccessful Stop (UnsuccStop) trials in the SST2 dataset. Clusters were thresholded at the top 40% stability on Successful Stop trials, separately in each dataset. Shaded area represents standard error.
To quantify differences in task-evoked response between the rAI and rIFC, we compared β1 weights, corresponding to the canonical HRF basis, and contrasted Successful Stop versus Go trials, as well as Unsuccessful Stop versus Go trials in the two clusters in SST1 and SST2 (Fig. 10a). There were marginally significant interaction between clusters and trial type in SST1 (F(1,17) = 4.00, p = 0.06) and significant interaction in SST2 (F(1,51) = 33.38, p < 0.001). Post hoc paired t tests confirmed that the rAI cluster had significantly greater activation for Unsuccessful Stop versus Go trials than Successful Stop versus Go trials (SST1, t(17) = 2.40, p = 0.028; SST2, t(51) = 4.40, p < 0.001). No such differences were detected in the rIFC cluster (SST1, p > 0.3; SST2, p > 0.6). The activation in the contrast of Successful Stop versus Go was not different between two clusters (SST1, p > 0.3; SST2, p > 0.25), and the activation in the contrast of Unsuccessful Stop versus Go was significantly different between two clusters (SST1, t(17) = 2.78, p = 0.013; SST2, t(51) = 4.28, p < 0.001). This indicates that the rAI had greater elevated activation, relative to Go trials, on Unsuccessful than Successful Stop trials compared with the rIFC, but the extent of elevated activation on Successful Stop trials relative to Go trials was non-differentiable between two clusters.
Figure 10.

Task-evoked activation and classification in rAI and rIFC clusters. a, Activation-level measures using β1 weights for Successful Stop (SuccStop) versus Go and Unsuccessful Stop (UnsuccStop) versus Go in the SST1 and SST2 datasets. b, Cross-validation accuracies of classifiers trained using β1 weights of the rAI or rIFC clusters in SuccStop and UnsuccStop trials in SST1 and SST2 datasets. Clusters were obtained using Successful Stop trials and thresholded using the top 40% stability values, separately in each dataset. *p < 0.05; ***p < 0.001.
Machine learning-based multivariate classification of stop-trial outcome distinguishes rAI and rIFC
To further dissociate the functional roles of the rAI and rIFC, we used a multivariate classification approach to distinguish between response patterns associated with Successful and Unsuccessful Stop trials. Figure 10b summarizes the performance of the classification procedures in differentiating Successful versus Unsuccessful Stop trials. In the SST1, the cross-validation accuracies for the rAI and rIFC were 66.7% (p = 0.031) and 50% (p = 0.29), respectively. The cross-validation accuracy for the rAI was significantly greater than that for the rIFC (p = 0.029). In the SST2, the cross-validation accuracies for the rAI and rIFC were 67.3% (p = 0.001) and 50% (p = 0.27), respectively. Cross-validation accuracy in the rAI, compared with the rIFC, was significantly higher (p < 0.001). These results suggest that the rAI responses distinguish Successful and Unsuccessful Stop trials and that the rAI is more sensitive to Stop trial outcome than the rIFC.
Distinct brain–behavior relations with inhibitory control ability in the rAI and rIFC
We then examined whether activation in the rAI and rIFC can predict individual differences in inhibitory control. Sparse multivariate regression analysis with cross-validation revealed that activation in the rIFC but not the rAI could significantly predict individual inhibitory control ability (SST1: rAI, p = 0.11 and rIFC, p = 0.005; SST2: rAI, p = 0.11 and rIFC, p < 0.001). Additional analyses revealed that a prediction model based on the rIFC cluster was significantly better than that based on the rAI cluster in both the SST1 and SST2 datasets (SST1, p = 0.005; SST2, p = 0.007). These results indicate that the rIFC is more closely associated with the inhibitory control process.
Discussion
We used several novel quantitative analyses to identify and differentiate functional subdivisions within the fronto-opercular cortex and clarify their functional roles in inhibitory control. Using consensus clustering, we demonstrate that right fronto-opercular regions involved in inhibitory control can be reliably parcellated into two highly stable and distinct clusters encompassing the rAI and rIFC. Importantly, parcellations obtained using the SST-evoked profile of hemodynamic responses from the two independent inhibitory control fMRI datasets were not only highly consistent with each other but also convergent with parcellations obtained using intrinsic connectivity analysis of resting-state fMRI data. Furthermore, as discussed below, multivoxel analysis of task-evoked responses revealed several distinct functional characteristics associated with Successful and Unsuccessful Stop and Go events in the rAI and rIFC.
Meta-analysis and identification of right fronto-opercular cortex
The engagement of the right fronto-opercular cortex during inhibitory control has been reported consistently in a large body of lesion, transcranial magnetic stimulation, electrocorticography, and neuroimaging studies (Aron et al., 2003; Chambers et al., 2006; Swann et al., 2012; Cai et al., 2014). Despite their common coactivation of the rAI and rIFC during inhibitory control across a wide range of studies, few have attempted to differentiate their functional organization. To address this, we first conducted a meta-analysis of 70 published GNGT and SST studies. This analysis revealed a large right fronto-opercular cortex encompassing the rIFC and rAI that was consistently activated during inhibitory control. Notably, the most significant activation peak was found in the rAI and not the rIFC (Table 2), which replicates findings from a previous meta-analysis of SST and GNGT studies (Swick et al., 2011) and further highlights the involvement of the rAI in tasks involving inhibitory control.
Intrinsic and task-evoked responses reveal two distinct fronto-opercular cortex subdivisions encompassing the rAI and rIFC
Building on these convergent findings, we conducted a novel clustering analysis to demarcate the functional boundaries of the rAI and rIFC. Using features of intrinsic brain activity from resting-state fMRI data, we found that the right fronto-opercular cortex could be reliably segmented into two dissociable clusters encompassing the rAI and rIFC. Importantly, clusters obtained from the resting-state and two independent task fMRI datasets shared several common features. Both produced two stable clusters that showed high similarity in size and a high proportion of overlapping voxels. These results point to a novel and distinct pattern of organization in the fronto-opercular cortex and demonstrate for the first time that the functional demarcation of this region into two stable clusters is preserved in both the intrinsic and task-evoked states.
rAI and rIFC have dissociable intrinsic and task-evoked functional connectivity
Next, analysis of temporal correlations in fMRI time series revealed that the rAI and rIFC have distinct patterns of intrinsic functional connectivity. Consistent with previous resting-state fMRI (Seeley et al., 2007; Sridharan et al., 2008; Smith et al., 2009) and structural connectivity (van den Heuvel et al., 2009; Allman et al., 2010) studies, we found that the rAI has stronger intrinsic functional connectivity with the ACC. Compared with the rAI, the rIFC showed stronger connectivity with key nodes of the dorsolateral frontoparietal network, including the MFG and SMG (Greicius et al., 2004; Seeley et al., 2007; Sridharan et al., 2008). This pattern of differential connectivity is in agreement with anatomical tracer analyses of corticocortical connections in nonhuman primates (Petrides and Pandya, 2002) and diffusion-weighted imaging studies in humans (Aron et al., 2007; Neubert et al., 2010). The dorsolateral frontoparietal network is part of a “central executive” network (Dosenbach et al., 2007; Menon and Uddin, 2010) implicated in allocating attentional resources for selectively enhancing task-relevant information, maintaining information online, and facilitating appropriate behavioral responses (Goldman-Rakic, 1995; Smith and Jonides, 1998; Fuster, 2000; Miller and Cohen, 2001; D'Esposito, 2007). In contrast, the AI and ACC constitute key nodes of the salience network, a system that facilitates detection of, and attention to, salient events, such as stop signals and errors (Seeley et al., 2007; Menon and Uddin, 2010).
Crucially, this differential pattern of connectivity was also observed in the task-evoked state. In both the SST1 and SST2 datasets, the rAI showed stronger connectivity with the ACC than the rIFC and the rIFC showed stronger connectivity with the lateral PFC and PPC than the rAI during Stop trials. This finding of similar intrinsic and task-evoked functional connectivity is consistent with, and extends, previous analyses of other brain systems (Smith et al., 2009; Cole et al., 2014) to the rAI and rIFC. Together, these results demonstrate that the rAI and rIFC interact with distinct intrinsically connected brain systems during inhibitory control and, furthermore, suggests that these two regions play different roles in implementing this process.
Distinct functional response profiles of the rAI and IFC in inhibitory control
Our analysis further revealed that the rAI and rIFC clusters have different task-evoked response profiles across the three experimental conditions in the SST. Although the rAI and rIFC showed similar levels of elevated activation during Successful Stop versus Go trials, they differed in response to Unsuccessful Stop trials. The rAI showed greater activation than the rIFC during Unsuccessful Stop versus Go trials; furthermore, multivoxel response profiles in the rAI distinguished between Successful and Unsuccessful Stop trials with high cross-validation accuracy. Because stop signals occur late and unexpectedly during Unsuccessful Stop trials (Logan et al., 1984), greater activation of the rAI during Unsuccessful Stop trials is likely related to detection of these highly unexpected and salient stop signals (Ide et al., 2013). rAI responses are known to increase with stimulus saliency (Menon and Uddin, 2010), and this region has been shown to be causally involved in the detection of infrequent, unexpected, events embedded in a stream of frequent events (Sridharan et al., 2008). An alternative explanation is that rAI responses during Unsuccessful Stop trials are related to error processing. However, this account cannot explain the high levels of rAI activation to Successful Stop trials. Together, these results suggest that the rAI cluster plays an important and dissociable role in detection and processing of behaviorally relevant salient stop signals, an essential process in inhibitory control.
In contrast, SSRT, a measure of how fast one can stop, was associated with activation in the rIFC but not in the rAI. However, it is noteworthy that rIFC responses did not distinguish between Successful and Unsuccessful Stop trials, suggesting that this region does not determine stopping outcome per se. Rather, our results suggest that the rIFC is more involved in the early, initiation stages of implementing the stop process (Chao et al., 2009; Duann et al., 2009; Cai and Leung, 2011). Crucially, we replicated this pattern of double dissociation in two independent datasets, further highlighting the significant and differential roles of the rAI and rIFC in inhibitory control.
Dissociating the functional roles of the rAI and rIFC in inhibitory control: synthesis and conclusions
Our study provides convergent and replicable evidence for functional dissociation of the role of the rAI and rIFC in inhibitory control. Multiple quantitative analyses revealed, for the first time, that the rAI and rIFC exhibit distinct context-dependent task-evoked responses, heterogeneous patterns of intrinsic and task-evoked functional connectivity, and different brain–behavior relations to inhibitory control ability. Our results demonstrate that right fronto-opercular subregions play different roles in implementing inhibitory control and inform the ongoing debate about the mechanistic nature of the rIFC in inhibition versus attentional control (Hampshire et al., 2010; Sharp et al., 2010; Aron et al., 2014). Previous studies have reported that the fronto-opercular cortex responds to infrequent stimuli even when inhibition is not required and argued for its involvement in attentional rather than inhibitory control (Hampshire et al., 2010; Sharp et al., 2010; Erika-Florence et al., 2014). Our findings suggest that right fronto-opercular cortex responses can be dissociated into two key functional subdivisions implementing different aspects of control processes. Crucially, we show that the rIFC is more tightly linked to the SSRT but not accuracy per se, suggesting its involvement in the early stages of inhibitory control processes. In this view, the rIFC helps initiate a stop process in both Successful and Unsuccessful Stop trials but does not determine the outcome. In contrast, the rAI is sensitive to stimulus-related saliency. Together, these findings provide robust evidence for distinct functional organization, circuits, and brain–behavior relations associated with the rAI and rIFC, two brain regions that are coactivated across a broad range of inhibitory control tasks.
In conclusion, our study overcomes the problematic, vague, and often inaccurate characterization of individual functional subdivisions of the fronto-opercular cortex and their involvement in inhibitory control. The quantitative analyses presented here highlight the significant amount of useful information associated with the temporal profile of task-evoked responses, which reveals features of functional brain organization that are difficult to disentangle using conventional analyses (Gonzalez-Castillo et al., 2012; Orban et al., 2014). More broadly, our findings provide critical new information for enhancing our understanding of the functional architecture of neurocognitive systems involved in adaptive control. Our multipronged quantitative approach and methods are likely to be useful for other related studies that require careful disentangling of brain organization, circuits, and function.
Footnotes
This work was supported by National Institutes of Health Grants NS071221 (V.M.), NS086085 (V.M.), DA026990 (C.-S.R.L.), DA023248 (C.-S.R.L.), AA021449 (C.-S.R.L.), and K25HD074652 (S.R.) and National Science Foundation Grant BCS1309260 (C-.S.R.L.). We are grateful to Dr. Russell Poldrack and colleagues for sharing their data via OpenfMRI.org and to Dr. Sheng Zhang for assistance with data acquired at the Yale University School of Medicine.
The authors declare no competing financial interests.
References
- Allman JM, Tetreault NA, Hakeem AY, Manaye KF, Semendeferi K, Erwin JM, Park S, Goubert V, Hof PR. The von Economo neurons in frontoinsular and anterior cingulate cortex in great apes and humans. Brain Struct Funct. 2010;214:495–517. doi: 10.1007/s00429-010-0254-0. [DOI] [PubMed] [Google Scholar]
- Aron AR. From reactive to proactive and selective control: developing a richer model for stopping inappropriate responses. Biol Psychiatry. 2011;69:e55–e68. doi: 10.1016/j.biopsych.2010.07.024. [DOI] [PMC free article] [PubMed] [Google Scholar]
- Aron AR, Poldrack RA. Cortical and subcortical contributions to Stop signal response inhibition: role of the subthalamic nucleus. J Neurosci. 2006;26:2424–2433. doi: 10.1523/JNEUROSCI.4682-05.2006. [DOI] [PMC free article] [PubMed] [Google Scholar]
- Aron AR, Fletcher PC, Bullmore ET, Sahakian BJ, Robbins TW. Stop-signal inhibition disrupted by damage to right inferior frontal gyrus in humans. Nat Neurosci. 2003;6:115–116. doi: 10.1038/nn1003. [DOI] [PubMed] [Google Scholar]
- Aron AR, Behrens TE, Smith S, Frank MJ, Poldrack RA. Triangulating a cognitive control network using diffusion-weighted magnetic resonance imaging (MRI) and functional MRI. J Neurosci. 2007;27:3743–3752. doi: 10.1523/JNEUROSCI.0519-07.2007. [DOI] [PMC free article] [PubMed] [Google Scholar]
- Aron AR, Robbins TW, Poldrack RA. Inhibition and the right inferior frontal cortex: one decade on. Trends Cogn Sci. 2014;18:177–185. doi: 10.1016/j.tics.2013.12.003. [DOI] [PubMed] [Google Scholar]
- Bellec P, Rosa-Neto P, Lyttelton OC, Benali H, Evans AC. Multi-level bootstrap analysis of stable clusters in resting-state fMRI. Neuroimage. 2010;51:1126–1139. doi: 10.1016/j.neuroimage.2010.02.082. [DOI] [PubMed] [Google Scholar]
- Boehler CN, Appelbaum LG, Krebs RM, Hopf JM, Woldorff MG. Pinning down response inhibition in the brain—conjunction analyses of the Stop-signal task. Neuroimage. 2010;52:1621–1632. doi: 10.1016/j.neuroimage.2010.04.276. [DOI] [PMC free article] [PubMed] [Google Scholar]
- Cai W, Leung HC. Rule-guided executive control of response inhibition: functional topography of the inferior frontal cortex. PLoS One. 2011;6:e20840. doi: 10.1371/journal.pone.0020840. [DOI] [PMC free article] [PubMed] [Google Scholar]
- Cai W, Cannistraci CJ, Gore JC, Leung HC. Sensorimotor-independent prefrontal activity during response inhibition. Hum Brain Mapp. 2014;35:2119–2136. doi: 10.1002/hbm.22315. [DOI] [PMC free article] [PubMed] [Google Scholar]
- Carpineto C, Romano G. Consensus clustering based on a new probabilistic rand index with application to subtopic retrieval. IEEE Trans Pattern Anal Mach Intell. 2012;34:2315–2326. doi: 10.1109/TPAMI.2012.80. [DOI] [PubMed] [Google Scholar]
- Chambers CD, Bellgrove MA, Stokes MG, Henderson TR, Garavan H, Robertson IH, Morris AP, Mattingley JB. Executive “brake failure” following deactivation of human frontal lobe. J Cogn Neurosci. 2006;18:444–455. doi: 10.1162/089892906775990606. [DOI] [PubMed] [Google Scholar]
- Chang LJ, Yarkoni T, Khaw MW, Sanfey AG. Decoding the role of the insula in human cognition: functional parcellation and large-scale reverse inference. Cereb Cortex. 2013;23:739–749. doi: 10.1093/cercor/bhs065. [DOI] [PMC free article] [PubMed] [Google Scholar]
- Chao HH, Luo X, Chang JL, Li CS. Activation of the pre-supplementary motor area but not inferior prefrontal cortex in association with short stop signal reaction time—an intra-subject analysis. BMC Neurosci. 2009;10:75. doi: 10.1186/1471-2202-10-75. [DOI] [PMC free article] [PubMed] [Google Scholar]
- Chikazoe J, Jimura K, Asari T, Yamashita K, Morimoto H, Hirose S, Miyashita Y, Konishi S. Functional dissociation in right inferior frontal cortex during performance of go/no-go task. Cereb Cortex. 2009;19:146–152. doi: 10.1093/cercor/bhn065. [DOI] [PubMed] [Google Scholar]
- Cocchi L, Harrison BJ, Pujol J, Harding IH, Fornito A, Pantelis C, Yücel M. Functional alterations of large-scale brain networks related to cognitive control in obsessive-compulsive disorder. Hum Brain Mapp. 2012;33:1089–1106. doi: 10.1002/hbm.21270. [DOI] [PMC free article] [PubMed] [Google Scholar]
- Cohen AL, Fair DA, Dosenbach NU, Miezin FM, Dierker D, Van Essen DC, Schlaggar BL, Petersen SE. Defining functional areas in individual human brains using resting functional connectivity MRI. Neuroimage. 2008;41:45–57. doi: 10.1016/j.neuroimage.2008.01.066. [DOI] [PMC free article] [PubMed] [Google Scholar]
- Cole MW, Bassett DS, Power JD, Braver TS, Petersen SE. Intrinsic and task-evoked network architectures of the human brain. Neuron. 2014;83:238–251. doi: 10.1016/j.neuron.2014.05.014. [DOI] [PMC free article] [PubMed] [Google Scholar]
- Craig AD. How do you feel–now? The anterior insula and human awareness. Nat Rev Neurosci. 2009;10:59–70. doi: 10.1038/nrn2555. [DOI] [PubMed] [Google Scholar]
- Critchley HD, Tang J, Glaser D, Butterworth B, Dolan RJ. Anterior cingulate activity during error and autonomic response. Neuroimage. 2005;27:885–895. doi: 10.1016/j.neuroimage.2005.05.047. [DOI] [PubMed] [Google Scholar]
- Deen B, Pitskel NB, Pelphrey KA. Three systems of insular functional connectivity identified with cluster analysis. Cereb Cortex. 2011;21:1498–1506. doi: 10.1093/cercor/bhq186. [DOI] [PMC free article] [PubMed] [Google Scholar]
- D'Esposito M. From cognitive to neural models of working memory. Philos Trans R Soc B. 2007;362:761–772. doi: 10.1098/rstb.2007.2086. [DOI] [PMC free article] [PubMed] [Google Scholar]
- Dosenbach NU, Fair DA, Miezin FM, Cohen AL, Wenger KK, Dosenbach RA, Fox MD, Snyder AZ, Vincent JL, Raichle ME, Schlaggar BL, Petersen SE. Distinct brain networks for adaptive and stable task control in humans. Proc Natl Acad Sci U S A. 2007;104:11073–11078. doi: 10.1073/pnas.0704320104. [DOI] [PMC free article] [PubMed] [Google Scholar]
- Duann JR, Ide JS, Luo X, Li CS. Functional connectivity delineates distinct roles of the inferior frontal cortex and presupplementary motor area in stop signal inhibition. J Neurosci. 2009;29:10171–10179. doi: 10.1523/JNEUROSCI.1300-09.2009. [DOI] [PMC free article] [PubMed] [Google Scholar]
- Eickhoff SB, Laird AR, Grefkes C, Wang LE, Zilles K, Fox PT. Coordinate-based activation likelihood estimation meta-analysis of neuroimaging data: a random-effects approach based on empirical estimates of spatial uncertainty. Hum Brain Mapp. 2009;30:2907–2926. doi: 10.1002/hbm.20718. [DOI] [PMC free article] [PubMed] [Google Scholar]
- Eickhoff SB, Bzdok D, Laird AR, Kurth F, Fox PT. Activation likelihood estimation meta-analysis revisited. Neuroimage. 2012;59:2349–2361. doi: 10.1016/j.neuroimage.2011.09.017. [DOI] [PMC free article] [PubMed] [Google Scholar]
- Erika-Florence M, Leech R, Hampshire A. A functional network perspective on response inhibition and attentional control. Nat Commun. 2014;5:4073. doi: 10.1038/ncomms5073. [DOI] [PMC free article] [PubMed] [Google Scholar]
- Fred ALN, Jain AK. Combining multiple clusterings using evidence accumulation. IEEE Trans Pattern Anal Mach Intell. 2005;27:835–850. doi: 10.1109/TPAMI.2005.113. [DOI] [PubMed] [Google Scholar]
- Friston KJ, Fletcher P, Josephs O, Holmes A, Rugg MD, Turner R. Event-related fMRI: characterizing differential responses. Neuroimage. 1998;7:30–40. doi: 10.1006/nimg.1997.0306. [DOI] [PubMed] [Google Scholar]
- Fuster JM. Executive frontal functions. Exp Brain Res. 2000;133:66–70. doi: 10.1007/s002210000401. [DOI] [PubMed] [Google Scholar]
- Garavan H, Ross TJ, Stein EA. Right hemispheric dominance of inhibitory control: an event-related functional MRI study. Proc Natl Acad Sci U S A. 1999;96:8301–8306. doi: 10.1073/pnas.96.14.8301. [DOI] [PMC free article] [PubMed] [Google Scholar]
- Gazzaley A, Rissman J, D'Esposito M. Functional connectivity during working memory maintenance. Cogn Affect Behav Neurosci. 2004;4:580–599. doi: 10.3758/CABN.4.4.580. [DOI] [PubMed] [Google Scholar]
- Glover GH, Law CS. Spiral-in/out BOLD fMRI for increased SNR and reduced susceptibility artifacts. Magn Reson Med. 2001;46:515–522. doi: 10.1002/mrm.1222. [DOI] [PubMed] [Google Scholar]
- Goldman-Rakic PS. Architecture of the prefrontal cortex and the central executive. Ann N Y Acad Sci. 1995;769:71–83. doi: 10.1111/j.1749-6632.1995.tb38132.x. [DOI] [PubMed] [Google Scholar]
- Gonzalez-Castillo J, Saad ZS, Handwerker DA, Inati SJ, Brenowitz N, Bandettini PA. Whole-brain, time-locked activation with simple tasks revealed using massive averaging and model-free analysis. Proc Natl Acad Sci U S A. 2012;109:5487–5492. doi: 10.1073/pnas.1121049109. [DOI] [PMC free article] [PubMed] [Google Scholar]
- Greicius MD, Srivastava G, Reiss AL, Menon V. Default-mode network activity distinguishes Alzheimer's disease from healthy aging: evidence from functional MRI. Proc Natl Acad Sci U S A. 2004;101:4637–4642. doi: 10.1073/pnas.0308627101. [DOI] [PMC free article] [PubMed] [Google Scholar]
- Habas C, Kamdar N, Nguyen D, Prater K, Beckmann CF, Menon V, Greicius MD. Distinct cerebellar contributions to intrinsic connectivity networks. J Neurosci. 2009;29:8586–8594. doi: 10.1523/JNEUROSCI.1868-09.2009. [DOI] [PMC free article] [PubMed] [Google Scholar]
- Hampshire A, Chamberlain SR, Monti MM, Duncan J, Owen AM. The role of the right inferior frontal gyrus: inhibition and attentional control. Neuroimage. 2010;50:1313–1319. doi: 10.1016/j.neuroimage.2009.12.109. [DOI] [PMC free article] [PubMed] [Google Scholar]
- Hastie T, Tibshirani R, Friedman J. The elements of statistical learning: data mining, inference, and prediction. New York: Springer; 2009. [Google Scholar]
- Ide JS, Shenoy P, Yu AJ, Li CS. Bayesian prediction and evaluation in the anterior cingulate cortex. J Neurosci. 2013;33:2039–2047. doi: 10.1523/JNEUROSCI.2201-12.2013. [DOI] [PMC free article] [PubMed] [Google Scholar]
- Levy BJ, Wagner AD. Cognitive control and right ventrolateral prefrontal cortex: reflexive reorienting, motor inhibition, and action updating. Ann N Y Acad Sci. 2011;1224:40–62. doi: 10.1111/j.1749-6632.2011.05958.x. [DOI] [PMC free article] [PubMed] [Google Scholar]
- Logan GD, Cowan WB, Davis KA. On the ability to inhibit simple and choice reaction time responses: a model and a method. J Exp Psychol Hum Percept Perform. 1984;10:276–291. doi: 10.1037/0096-1523.10.2.276. [DOI] [PubMed] [Google Scholar]
- Menon V, Uddin LQ. Saliency, switching, attention and control: a network model of insula function. Brain Struct Funct. 2010;214:655–667. doi: 10.1007/s00429-010-0262-0. [DOI] [PMC free article] [PubMed] [Google Scholar]
- Miller EK, Cohen JD. An integrative theory of prefrontal cortex function. Annu Rev Neurosci. 2001;24:167–202. doi: 10.1146/annurev.neuro.24.1.167. [DOI] [PubMed] [Google Scholar]
- Neubert FX, Mars RB, Buch ER, Olivier E, Rushworth MFS. Cortical and subcortical interactions during action reprogramming and their related white matter pathways. Proc Natl Acad Sci U S A. 2010;107:13240–13245. doi: 10.1073/pnas.1000674107. [DOI] [PMC free article] [PubMed] [Google Scholar]
- Orban P, Doyon J, Petrides M, Mennes M, Hoge R, Bellec P. The richness of task-evoked hemodynamic responses defines a pseudohierarchy of functionally meaningful brain networks. Cereb Cortex. 2014 doi: 10.1093/cercor/bhu064. doi: 10.1093/cercor/bhu064. Advance online publication. Retrieved September 24, 2014. [DOI] [PMC free article] [PubMed] [Google Scholar]
- Pa J, Dutt S, Mirsky JB, Heuer HW, Keselman P, Kong E, Trujillo A, Gazzaley A, Kramer JH, Seeley WW, Miller BL, Boxer AL. The functional oculomotor network and saccadic cognitive control in healthy elders. Neuroimage. 2014;95C:61–68. doi: 10.1016/j.neuroimage.2014.03.051. [DOI] [PMC free article] [PubMed] [Google Scholar]
- Petrides M, Pandya DN. Comparative cytoarchitectonic analysis of the human and the macaque ventrolateral prefrontal cortex and corticocortical connection patterns in the monkey. Eur J Neurosci. 2002;16:291–310. doi: 10.1046/j.1460-9568.2001.02090.x. [DOI] [PubMed] [Google Scholar]
- Rissman J, Gazzaley A, D'Esposito M. Measuring functional connectivity during distinct stages of a cognitive task. Neuroimage. 2004;23:752–763. doi: 10.1016/j.neuroimage.2004.06.035. [DOI] [PubMed] [Google Scholar]
- Seeley WW, Menon V, Schatzberg AF, Keller J, Glover GH, Kenna H, Reiss AL, Greicius MD. Dissociable intrinsic connectivity networks for salience processing and executive control. J Neurosci. 2007;27:2349–2356. doi: 10.1523/JNEUROSCI.5587-06.2007. [DOI] [PMC free article] [PubMed] [Google Scholar]
- Sharp DJ, Bonnelle V, De Boissezon X, Beckmann CF, James SG, Patel MC, Mehta MA. Distinct frontal systems for response inhibition, attentional capture, and error processing. Proc Natl Acad Sci U S A. 2010;107:6106–6111. doi: 10.1073/pnas.1000175107. [DOI] [PMC free article] [PubMed] [Google Scholar]
- Smith EE, Jonides J. Neuroimaging analyses of human working memory. Proc Natl Acad Sci U S A. 1998;95:12061–12068. doi: 10.1073/pnas.95.20.12061. [DOI] [PMC free article] [PubMed] [Google Scholar]
- Smith SM, Fox PT, Miller KL, Glahn DC, Fox PM, Mackay CE, Filippini N, Watkins KE, Toro R, Laird AR, Beckmann CF. Correspondence of the brain's functional architecture during activation and rest. Proc Natl Acad Sci U S A. 2009;106:13040–13045. doi: 10.1073/pnas.0905267106. [DOI] [PMC free article] [PubMed] [Google Scholar]
- Sridharan D, Levitin DJ, Menon V. A critical role for the right fronto-insular cortex in switching between central-executive and default-mode networks. Proc Natl Acad Sci U S A. 2008;105:12569–12574. doi: 10.1073/pnas.0800005105. [DOI] [PMC free article] [PubMed] [Google Scholar]
- Swann NC, Cai W, Conner CR, Pieters TA, Claffey MP, George JS, Aron AR, Tandon N. Roles for the pre-supplementary motor area and the right inferior frontal gyrus in stopping action: electrophysiological responses and functional and structural connectivity. Neuroimage. 2012;59:2860–2870. doi: 10.1016/j.neuroimage.2011.09.049. [DOI] [PMC free article] [PubMed] [Google Scholar]
- Swick D, Ashley V, Turken U. Are the neural correlates of stopping and not going identical? Quantitative meta-analysis of two response inhibition tasks. Neuroimage. 2011;56:1655–1665. doi: 10.1016/j.neuroimage.2011.02.070. [DOI] [PubMed] [Google Scholar]
- Uddin LQ, Supekar K, Amin H, Rykhlevskaia E, Nguyen DA, Greicius MD, Menon V. Dissociable connectivity within human angular gyrus and intraparietal sulcus: evidence from functional and structural connectivity. Cereb Cortex. 2010;20:2636–2646. doi: 10.1093/cercor/bhq011. [DOI] [PMC free article] [PubMed] [Google Scholar]
- Uddin LQ, Supekar K, Lynch CJ, Khouzam A, Phillips J, Feinstein C, Ryali S, Menon V. Salience network-based classification and prediction of symptom severity in children with autism. JAMA Psychiatry. 2013;70:869–879. doi: 10.1001/jamapsychiatry.2013.104. [DOI] [PMC free article] [PubMed] [Google Scholar]
- van den Heuvel MP, Mandl RC, Kahn RS, Hulshoff Pol HE. Functionally linked resting-state networks reflect the underlying structural connectivity architecture of the human brain. Hum Brain Mapp. 2009;30:3127–3141. doi: 10.1002/hbm.20737. [DOI] [PMC free article] [PubMed] [Google Scholar]
- Verbruggen F, Logan GD. Response inhibition in the stop-signal paradigm. Trends Cogn Sci. 2008;12:418–424. doi: 10.1016/j.tics.2008.07.005. [DOI] [PMC free article] [PubMed] [Google Scholar]
- Xue G, Aron AR, Poldrack RA. Common neural substrates for inhibition of spoken and manual responses. Cereb Cortex. 2008;18:1923–1932. doi: 10.1093/cercor/bhm220. [DOI] [PubMed] [Google Scholar]
- Zhang S, Li CS. Functional networks for cognitive control in a stop signal task: independent component analysis. Hum Brain Mapp. 2012;33:89–104. doi: 10.1002/hbm.21197. [DOI] [PMC free article] [PubMed] [Google Scholar]