

Abstract
The blood–brain barrier (BBB) is a large regulatory and exchange interface between the brain and peripheral circulation. We propose that changes of the BBB contribute to many pathophysiological processes in the brain of subjects with chronic sleep restriction (CSR). To achieve CSR that mimics a common pattern of human sleep loss, we quantified a new procedure of sleep disruption in mice by a week of consecutive sleep recording. We then tested the hypothesis that CSR compromises microvascular function. CSR not only diminished endothelial and inducible nitric oxide synthase, endothelin1, and glucose transporter expression in cerebral microvessels of the BBB, but it also decreased 2-deoxy-glucose uptake by the brain. The expression of several tight junction proteins also was decreased, whereas the level of cyclooxygenase-2 increased. This coincided with an increase of paracellular permeability of the BBB to the small tracers sodium fluorescein and biotin. CSR for 6 d was sufficient to impair BBB structure and function, although the increase of paracellular permeability returned to baseline after 24 h of recovery sleep. This merits attention not only in neuroscience research but also in public health policy and clinical practice.
Keywords: BBB, glucose metabolism, sleep duration, sleep restriction, transport
Introduction
Chronic sleep restriction (CSR) is a common occurrence in modern society, resulting from a variety of factors, such as, longer commuting distances between home and job, increased social pressure, and longer time spent at work and watching media entertainment. Because sleep is an essential homeostatic process for human beings and other animals, sleep loss has many negative influences on daytime functions. Decreased sleep duration is associated with cardiovascular disease and diabetes risk factors, depression, automobile and workplace accidents, and prospective mortality (Krueger and Friedman, 2009). CSR not only induces metabolic disturbance, but also impairs neurobehavioral and physiological functioning (Banks and Dinges, 2007). Many studies of experimental sleep manipulation have focused on the effects of sleep loss on neural functions and cerebral blood flow, but dynamic changes of the blood–brain barrier (BBB) have not gained much attention.
The BBB is a regulatory interface for molecular exchange across cerebral capillaries and postcapillary venules. The surface area of a typical adult human brain is an extensive 12–20 m2 (129–215 feet2), with a cumulative capillary length of ∼650 km (403 miles). No neuron is more than ∼8 μm from the BBB, because the mean distance between capillaries is ∼40 μm (Abbott, 2008). The BBB differs from the vasculature of non-CNS organs by the presence of tight junctions (TJs) between the single monolayer of endothelium, by reinforcement of a continuous basement membrane, and by contributions from multiple CNS cellular constituents. Although the unique structure of the BBB confers a high transendothelial electrical resistance and low paracellular permeability, the presence of solute transporters and many other transport systems enables efficient molecular exchange and neuroendocrine regulation. Along with tightly regulated cerebral blood flow and metabolism, the BBB facilitates the essential functioning of the brain and spinal cord.
As a regulatory interface, the BBB is susceptible to modulatory changes by hormones, neurotransmitters, and altered states of functional activation (Palmer, 1986). Circadian rhythms of BBB transport have been shown for leptin (Pan and Kastin, 2001) and tumor necrosis factor α (Pan et al., 2002). Osmotic opening of the BBB by mannitol is well known, and even substances such as alcohol, epinephrine, tobacco, cocaine, and methamphetamine, as well as, morphine withdrawal can increase the paracellular permeability of the BBB (Sharma and Ali, 2006). Spinal cord injury provides a clear example of dynamic changes of blood–spinal cord barrier function, not only in paracellular permeability but also specific transport of cytokines (Pan et al., 1997, 1999, 2001; Sharma, 2005). Homeostatic regulation occurs in acute sleep deprivation and is impaired in chronic sleep disorders, such as prolonged sleep apnea. Predicting that CSR not only impairs neuroendocrine regulation but also modulates BBB structure and function directly, we tested this in mice with a CSR model.
Materials and Methods
Mice, headmount surgery, and sleep recording.
Following a protocol approved by the Institutional Animal Care and Use Committee, 3-month-old C57 mice (The Jackson Laboratory) were used for sleep recording or CSR manipulation. The mice were single-housed for sleep recording or group-housed for the other experiments following a 12 h light/dark cycle, with lights on at 6:00 A.M. (zeitgeber time, ZT, of 0) and lights off at 6:00 P.M. (ZT 12 h). Food and water were available ad libitum. For sleep recording, a prefabricated headmount (Pinnacle Technology) was placed surgically on 7- to 8-week-old mice under isofluorane anesthesia, as described previously (Wang et al., 2013; He et al., 2014). The headmount contains two electroencephalography (EEG) channels, conveying the potential between the two parietal leads (channel 1) and the left parietal and right frontal leads (channel 2), respectively, and one electromyography (EMG) channel for nuchal muscle activity. After 2 weeks of recovery, mice were singly housed in round recording cages and adapted to a preamplifier connected to the headmount and to the other end to a low-torque commutator/swivel that transmits signals to the 8401 Data Conditioning and Acquisition system. Data were acquired after 3 d of adaptation in the recording cage by use of Serenia acquisition software (Pinnacle Technology). Signals were amplified and digitalized at 256 Hz and passed through bandpass filters. Manual scoring was performed on exported EDF files by experienced sleep researchers with cross-validated interscorer reliability. Each of the 10 s epochs were assigned as wake, NREM (nonrapid eye movement), or REM (rapid eye movement), following standard scoring criteria (Veasey et al., 2000; Louis et al., 2004). The distribution of NREM, REM, and wake parameters was quantified for 24 h from ZT 0. The Serenia Sleep Pro software (Pinnacle Technology) was used to analyze sleep bouts. A bout was defined as a minimum of three consecutive epochs at a length of 10 s/epoch for a given state.
CSR procedure.
After a baseline sleep recording of 24 h from ZT 0, the mice used for CSR validation underwent 6 consecutive days of CSR in the sleep deprivation cages fabricated by Pinnacle Technology. Sleep was disrupted starting from lights-on by a rotating bar at the bottom of the cage at a speed of 5 rpm, with random changes of direction every 10 s clockwise and 40 s counterclockwise. A mouse had to step over the bar, resulting in sleep disruption. Food and water were freely available in the recording cage, and there was corn bedding immediately below the rotating bar. No visible stress was observed during the course of CSR, and daily food intake and body weight were unchanged upon completion of the CSR. Data were analyzed in periods of 24 h for total sleep time, time spent in NREM, REM, and wake, percentage of each sleep stage, number of bouts, bout duration, and hypnograms.
qPCR and WB of enriched microvessels from cerebral cortex.
Separate male C57 mice at age 3–4 months were used without headmount placement and sleep recording. Mice were killed at ZT 6–8 h on day 6 of CSR, along with naive controls (n = 6–7 mice/group). Microvessels were enriched by use of a capillary depletion procedure described previously (Pan et al., 2006, 2009). Mice were anesthetized with urethane and decapitated. The cerebral cortex was dissected and homogenized in capillary buffer (10 mm HEPES,141 mm NaCl, 4 mm KCl, 2.8 mm CaCl2, 1 mm NaH2PO4, 1 mm MgSO4, and 10 mm glucose) which was thoroughly mixed with 26% dextran for a final concentration of dextran slightly >13.5%. The homogenate was centrifuged at 6400 × g for 30 min at 4°C in a swing bucket rotor. The pelleted microvessel enrichment was snap frozen separately for RNA and protein analyses and stored at −80°C.
For quantitative PCR (qPCR), total RNA was extracted and reversely transcribed to cDNA. Real-time PCR was performed by use of the SYBR Green PCR Master Mix (Applied Biosystems) along with the cDNA and gene-specific primers on an ABI7900T device. The forward and reverse primers for target genes are shown in Table 1. We determined the mRNA expression of several classes of molecules: (1) glucose transporter GLUT1, which is an important indicator of BBB energy metabolism; (2) markers of endothelial function, including endothelial nitric oxide synthase (eNOS), inducible nitric oxide synthase (iNOS), and endothelin (ET)-1; (3) cyclooxygenase-2 (COX-2), a marker of BBB inflammation; and (4) the TJ proteins occludin, claudin-1, claudin-3, claudin-5, and zona occludin (ZO)-1 and ZO-2, structural backbones that distinguish the BBB from microvessels elsewhere. Gene expression was quantified by normalization of the cycling threshold (CT) values against the reference gene GAPDH by use of the ΔΔCT method.
Table 1.
Mouse primers for qPCR
| Gene | Forward primer (5′–3′) | Reverse primer (5′–3′) |
|---|---|---|
| Claudin-1 | ACTCCTTGCTGAATCTGAACAGT | GGACACAAAGATTGCGATCAG |
| Claudin-3 | TGGGAGGGCCTGTGGAT | CGTACATTTTGCACTGCATCTGA |
| Claudin-5 | CTGCCTTCCTGGACCACAA | TCCACAGCCCCTTCCAAGT |
| COX-2 | CAGGTCATTGGTGGAGAGGTGTA | GGATGTGAGGAGGGTAGATCATCT |
| ET-1 | GTGTCTACTTCTGCCACCTG | CACTGACATCTAACTGCCTGG |
| GAPDH | TGTGTCCGTCGTGGATCTGA | CCTGCTTCACCACCTTCTTGA |
| GLUT1 | GGTGTGCAGCAGCCTGTGT | CACAGTGAAGGCCGTGTTGA |
| eNOS | TCTGCGGCGATGTCACTATG | CATGCCGCCCTCTGTTG |
| iNOS | GGCAGCCTGTGAGACCTTTG | TGCATTGGAAGTGAAGCGTTT |
| Occludin | TCAAACCGAATCATTATGCACCA | AGATGGCAATGCACATCACAA |
| ZO-1 | GAGCTACGCTTGCCACACTGT | TCGGATCTCCAGGAAGACACTT |
| ZO-2 | CTTCTCACATTCAAAGTGGCTTC | CTACCTGCTAGAAATCCCCAAA |
For Western blotting (WB), microvessels were lysed in radioimmunoprecipitation assay buffer in the presence of a complete protease inhibitor cocktail (Pierce) at 4°C. Protein concentration was determined with a Micro BCA Protein Assay Kit (Pierce). Forty micrograms of protein was electrophoresed on 10% SDS PAGE, transferred to cellulose membrane, blocked, and probed with rabbit anti-GLUT1 antibody (1:500; H-43, SC7903; Santa Cruz Biotechnology). After further incubation with a horseradish peroxidase-conjugated secondary antibody, the signals were developed with enhanced chemiluminescence agent (Pierce). The expression of β-actin (1:10,000; AC-15; A5441; Sigma-Aldrich) was also determined as a loading control. Signal intensity was determined by the NIH ImageJ program.
3H-2 DG transport assay.
In the first study to determine the effect of CSR on 2DG uptake, two groups of mice were studied: CSR for 6 d and control (n = 4 mice/group). Mice were studied at ZT 6–8 h on day 6 of CSR. They received an intraperitoneal (i.p.) injection of 1 μCi of 3H-2-DG (PerkinElmer) in 100 μl PBS. At 40–44 min after injection, mice were anesthetized with urethane. At 45 min, they were decapitated immediately after blood collection from the right carotid artery. Brain was weighed and dissolved in Solvable (PerkinElmer; 1 ml for each 300 mg tissue) by overnight incubation at 55°C. The solution was discolored with 150 μl 30% H2O2, and reacted with 5 ml of Ultimate Gold scintillation mixture (PerkinElmer) on the following day. After 48 h of storage in darkness, the radioactivity was measured in a scintillation counter (PerkinElmer).
In the second study to determine whether CSR mice recover completely 24 h after cessation of sleep interruption, three groups of mice were studied at ZT 5–8 h: control, CSR for 6 d, or CSR for 6 d followed by 24 h of recovery sleep (n = 10–11/group). All mice were studied at the same terminal time point, with equal distribution of groups at any given circadian time. Thus, the CSR group started the sleep disruption procedure 24 h later to allow the recovery Group 24 h of rest after cessation of CSR. The 2DG uptake procedure was the same as that in the first study, except that unanaesthetized mice were decapitated to collect trunk blood 45 min after intraperitoneal injection of 3H-2DG.
Measurement of BBB permeability.
The paracellular permeability of the BBB to small tracers was determined by ratiometric assays of tissue/serum uptake, and by histological analysis. Two studies with sodium fluorescein (376 Da) measured regional brain or spinal cord concentration of the fluorophore by use of a microplate reader (Molecular Devices).
In the first study with two groups of mice after urethane anesthesia (control or CSR, n = 5–7 mice/group), 100 μl of sodium fluorescein (100 mg/ml, Sigma-Aldrich) was injected intravenously (i.v.) through the jugular vein. Ten minutes later, blood was collected by dissection of the right carotid artery to obtain serum, and the mouse was immediately decapitated. Brain was dissected into cerebral cortex and the remaining subcortical regions, brainstem, and cerebellum. The brain tissue was weighed and homogenized in PBS, and centrifuged at 10,000 × g for 15 min at 4°C to obtain supernatant. Supernatant and serum were diluted with PBS for measurement of sodium fluorescein within a linear range of standards of known concentrations. Brain and serum samples were measured along with 100 μl of blank or standards in duplicate on a fluorescent microplate reader, with excitation at 493 nm, emission wavelength of 538 nm, and auto cutoff for the high pass filter. The concentrations were within the linear range of the standard curve and tissue/serum ratio of fluorescence was determined.
The second sodium fluorescein uptake study included 3 groups of mice (control, CSR for 6 d, and CSR for 6 d followed by recovery sleep of 24 h, n = 5–8 mice/group). The procedure was the same as that in the first study, except that mice were decapitated to collect trunk blood without urethane anesthesia, 45 min after intraperitoneal injection of sodium fluorescein.
The regional susceptibility of the BBB to CSR was determined by use of 100 μl of a mixture of EZ-Link Sulfo-NHS-LC-biotin (0.2 mg/g BW, ∼5 mg/mouse, Pierce, Catalog #21335) and tetramethylrhodamine-conjugated Dextran (MW 3 kDa, lysine fixable, 0.04 mg/g BW, ∼1 mg/mouse, Invitrogen, Catalog #D3308). The tracers were injected in a bolus into the jugular vein of urethane-anesthetized mice. Thirty minutes later, the mouse was decapitated and the brain was postfixed in 10% formalin overnight, cryoprotected in 30% sucrose in PBS, and frozen at −80°C until cryosectioning. Coronal brain sections of 40 μm thickness were obtained by use of a cryostat, and processed for immunohistochemical analysis of BBB leakage. Serial brain sections were incubated with 1:1000 AlexaFluor 488-conjugated streptoavidin (Invitrogen, Catalog #S11223). Images were captured by use of an Olympus FV1000 confocal microscopy.
ICC of freshly isolated cerebral microvessels.
Cerebral microvessels were harvested with an established protocol (Ouyang et al., 2014a,b). Briefly, microvessels were obtained by use of a gradient dextran centrifugation method and purified by filtration through 100 and 40 μm molecular sieves; those with a size of 40–100 μm were used for immunocytochemistry (ICC).
Isolated microvessels were fixed with 2% paraformaldehyde for 30 min, permeabilized with 0.1% Triton X-100 for 5 min, blocked with 10% normal donkey serum in PBS for 30 min, and then incubated with a primary antibody overnight. Primary antibodies were all diluted (1:200) in PBS containing 1% normal donkey serum. The microvessels were then washed three times with PBS and incubated with appropriate secondary antibodies, including AlexaFluor 488-conjugated donkey anti-mouse, AlexaFluor 488-conjugated donkey anti-rabbit, or AlexaFluor 594-conjugated donkey anti-rabbit antibodies (all 1:250) for 1 h at room temperature. After thorough washes, the vessels were mounted between two coverslips with Prolong Gold antifade reagent containing 4′,6-diamidino-2-phenylindole (Invitrogen). Immunofluorescence was captured on an Olympus FV1000 inverted laser scanning microscope in the laboratory. The fluorescent intensity was measured after thresholding analysis and quantified by use of NIH ImageJ software.
ELISA.
Arterial blood was collected on ice to obtain serum after overnight storage at 4°C. Hormonal and inflammatory markers were determined, by use of a Corticosterone Enzyme Immunoassay Kit (Arbor Assay, Catalog #K014-H1), Mouse C-Reactive Protein/CRP kit (R&D Systems, Catalog #DY1829), Mouse/Rat Leptin Quantikine ELISA kit (R&D Systems, Catalog #MOB00), and Mouse IL-6 ELISA MAX kit (Biolegend, Catalog #431301) according to the manufacturers' instructions.
Statistical analysis.
Prism GraphPad 5 statistical and graphic program was used to conduct statistical analyses and generate graphs. Repeated measures one-way ANOVA was performed to determine changes in sleep architecture during the course of sleep deprivation followed by Tukey's post hoc test. One-way ANOVA was performed for comparison of 3H-2 DG uptake and BBB permeability among control, CSR, and recovery groups, followed by post hoc Tukey's test. When only two groups were studied, Student's t test was performed; this applies to mRNA and protein expression analysis of control and CSR microvessels.
Results
CSR consistently changed sleep architecture
In baseline recordings, there was 59.9% wake, 36.3% NREM, and 2.8% REM within a 24 h period. CSR was associated with progressive changes of sleep stages that were apparent even after the first 24 h of manipulation that started at ZT 0. In comparison with the baseline, the CSR mice had an increase of wake time (F(6,20) = 5.19, p < 0.01), and a decrease of both NREM (F(6,20) = 6.43, p < 0.005) and REM sleep (F(6,20) = 3.96, p < 0.001). The loss of REM sleep was most pronounced in the first 1–3 d of CSR and showed nonsignificant partial recovery afterward. By the end of 6 d of CSR, there was 13.3% increase of wake, 10.2% reduction of NREM, and 2.1% reduction of REM (Fig. 1A). The number of REM bouts also decreased (F(6,20) = 8.70, p < 0.001), though wake and NREM bouts did not change (Fig. 1B). The duration of NREM bouts decreased after the first 24 h and persisted throughout the 6 d (F(6,20) = 6.15, p < 0.005), whereas the duration of wake bouts did not change (Fig. 1C). Overall, the results show decreased sleep efficiency, increased fragmentation, and partial loss of both REM and NREM sleep.
Figure 1.
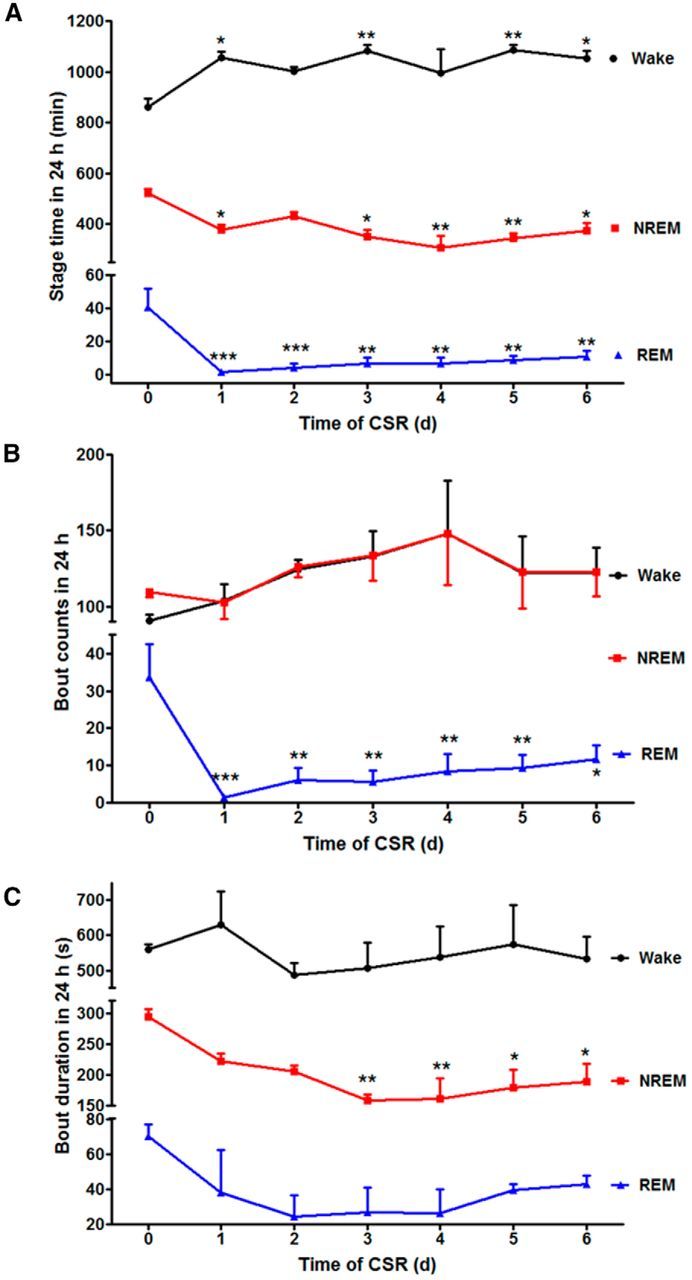
Effect of CSR on sleep architecture. A, The time within a 24 h light/dark cycle that mice spent in each stage is shown across the days of CSR. There was an overall increase of wake and reduction of both NREM and REM in comparison with their respective baseline on day 0. However, NREM rebound was seen after 2 d with a corresponding decrease of wake time. B, The number of REM bouts was decreased across day 1–6 of CSR, whereas wake and NREM bouts did not show significant changes in comparison with day 0 baseline. C, The duration of NREM bouts decreased on days 3–6 of CSR in comparison with day 0. The duration of wake and REM bouts did not change; *p < 0.05, **p < 0.01, ***p < 0.005, compared with baseline 24 h recording before CSR.
The transitions between sleep and wake can be presented more straightforwardly by the actual tracings from EEG/EMG signals. A typical sleep episode from naive/baseline mice included relatively long (∼300–600 s) NREM sleep followed by 60–120 s of REM sleep and then a brief arousal (10–20 s). In the CSR mice, however, NREM sleep mostly ended with Wake (Fig. 2A) or was occasionally followed by a short period of REM sleep (30–60 s) and then wake (data not shown), resulting in more stage transitions as shown by the representative hypnograms of a mouse across days of CSR (Fig. 2B). Not only was sleep fragmented by frequent arousals, but the circadian rhythm of sleep–wake activity was also blunted.
Figure 2.
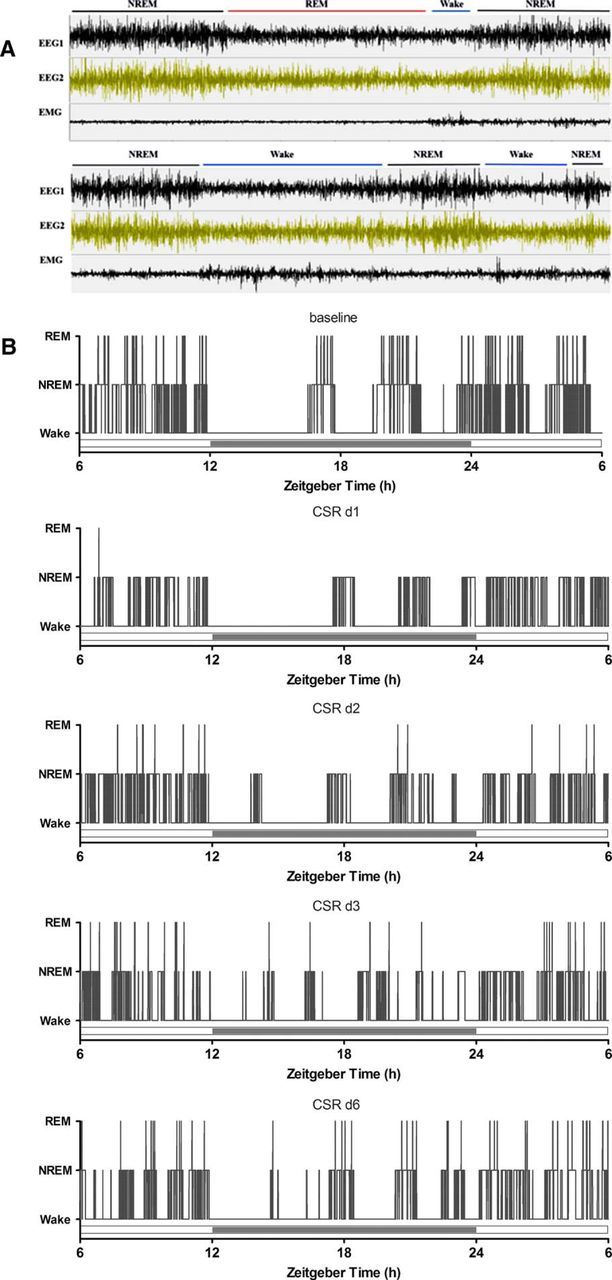
A, EEG and EMG tracings of three typical sleep states and their transitions, shown in 5 min time spans for baseline recording (top) and after CSR (bottom). B, Hypnograms of a representative mouse across days of CSR, where increased transitions from NREM to wake are seen.
CSR-induced downregulation of GLUT1 in enriched cerebral microvessels and decreased glucose transport across the BBB
Two groups of mice were used to measure GLUT1 expression in cerebral microvessels: naive control and CSR for 6 d (n = 5–7/group). CSR decreased mRNA expression of the glucose transporter GLUT1 (t(11) = 4.46, p = 0.001) in enriched cerebral microvessels (Fig. 3A). There also was reduction of GLUT1 protein, including both the 55 kDa (t(9) = 2.34, p < 0.05) and 45 kDa (t(9) = 2.35, p < 0.05) isoforms. This is shown in WB gel images and densitometric analysis of signal intensity (Fig. 3B). The 55 kDa GLUT1 is expressed by endothelia whereas the 45 kDa GLUT1 is the astrocytic form, probably located at the end feet of astrocytes (Morgello et al., 1995).
Figure 3.

Effect of CSR on GLUT1 expression in enriched cerebral microvessels. A, The mRNA for GLUT1 was decreased by CSR (n = 7) in comparison with the control (n = 6). B, Enriched microvessels had a high level of 45 kDa GLUT1 isoform and less abundant 55 kDa GLUT1 isoform. CSR reduced the level of expression of both after 6 d. C, The significant reduction of both GLUT1 isoforms in WB is shown by densitometric analysis (n = 5 for control and n = 6 for CSR); *p < 0.05.
To determine whether a reduction of GLUT1 expression at the BBB corresponded with a reduction of glucose transport from blood to brain, two groups of mice were studied: naive control and CSR for 6 d (n = 4/group). 3H-2DG was injected intraperitoneally 45 min before decapitation, and mice were anesthetized a few minutes before decapitation to collect arterial blood. In comparison with the control, the CSR group showed an overall reduction of the uptake of 3H-2DG by brain. Significant reduction was seen in the cortex (t(6) = 2.71, p < 0.05) and subcortical region (t(6) = 2.56, p < 0.05; Fig. 4A). This indicates that CSR decreased glucose transporter function.
Figure 4.

Effect of CSR on glucose transport across the BBB. A, Under anesthetized conditions, compared with the control mice, the uptake of 3H-2DG 45 min after intraperitoneal injection was reduced in the cerebral cortex and subcortical regions, although significant changes were not detected in the brainstem and cerebellum in the CSR mice (n = 4/group). B, Without any anesthesia, compared with the control mice, the uptake of 3H-2DG 45 min after intraperitoneal injection was reduced in most of the CNS region of CSR mice, but not the sleep recovery mice; *p < 0.05.
To address whether 24 h of recovery sleep was sufficient to restore glucose transport, three groups of mice were studied and seven CNS regions were analyzed (n = 10–12 mice/group): naive, 6 d of CSR, and 6 d of CSR followed by 24 h of recovery sleep. 3H-2DG was injected intraperitoneally 45 min before decapitation, at which time trunk blood was collected. Two-way ANOVA showed there were effects of CSR (F(2,209) = 10.83, p < 0.0001) and brain regions (F(6,209) = 20.15, p < 0.0001), without interactions between the two factors. A significant change was found in the hippocampus (F(2,32) = 4.71, p < 0.05). Post hoc analysis showed a reduction of 3H-2DG uptake in the CSR group (p < 0.05) but recovery to baseline 24 h after the cessation of CSR. There was also reduction of 3H-2DG uptake in the cortex and subcortical region when the CSR group was compared with the naive group (Fig. 4B). The lack of significant changes in the recovery group suggests the reversibility of impaired glucose metabolism at this time.
CSR affected genes involved in vascular endothelial function and inflammation
When the group of mice with 6 d of CSR was compared with the controls (n = 6–7/group), there was a significant reduction of the mRNA for eNOS (t(11) = 4.45, p = 0.001), iNOS (t(11) = 4.25, p < 0.005), and ET-1 (t(11) = 6.75, p < 0.0001) in enriched microvessels. This suggests a reduction of microvascular reactivity. By contrast, COX-2 mRNA was increased in the enriched cerebral microvessels from the CSR group (t(11) = 2.95, p < 0.05; Fig. 5A). This indicates increased inflammation induced by CSR. At the protein level, COX-2 immunoreactivity showed an apparent increase in the isolated cerebral microvessels from the CSR mice, and returned to baseline in those with 24 h of recovery sleep after 6 d of CSR (Fig. 5B).
Figure 5.

Effect of CSR on genes related to vascular function. A, In comparison with their respective controls (n = 6/group), enriched cerebral microvessels from the CSR mice had reduced mRNA for eNOS, iNOS, and ET-1, but increased mRNA for COX-2; *p < 0.05, **p < 0.01, ***p < 0.005. B, ICC of fresh cortical microvessels from cerebral cortex. The immunofluorescence of COX-2 was increased in the CSR group in comparison with the naive control or the recovery mice. Scale bar, 5 μm.
Effects of CSR on TJ expression
Two groups of cerebral microvessels were compared: those from mice after 6 d of CSR and those from naive mice (n = 6–7/group). In the CSR group, there was reduction of mRNAs of occludin (t(11) = 5.20, p < 0.001), claudin-1 (t(11) = 3.56, p < 0.005), claudin-5 (t(11) = 2.86, p < 0.05), and ZO-2 (t(11) = 7.12, p < 0.0001; Fig. 6A). The changes contrast with a lack of change of claudin-3 and ZO-1 (data not shown). The differential regulation of the TJ proteins is probably related to their transcription rate, half-life of the proteins, and subcellular distribution.
Figure 6.

Effect of CSR on TJ protein expression. A, Several TJ proteins showed decreased mRNA expression in the CSR group, including occludin, claudin-1, claudin-5, and ZO-2; **p < 0.01, ***p < 0.005. B, The immunofluorescence of occludin in freshly isolated cerebral microvessels showed line-like paracellular distribution in the naive group, was decreased in the CSR group, and returned to the control level after 24 h of recovery sleep. Scale bar, 5 μm.
In isolated cerebral microvessels, the transmembrane TJ protein occludin showed linear, nearly continuous distribution at the luminal surface of capillaries. The immunofluorescence of occludin was lost in most areas of the vessels in the CSR mice, and the remaining intensity was dramatically decreased in patchy areas. The normal pattern of distribution and expression level was restored in mice after 24 h of recovery sleep (Fig. 6B).
Effects of CSR on BBB permeability
To determine how CSR affects the paracellular permeability of the BBB, we studied two groups of mice in regard to brain uptake of sodium fluorescein 10 min after intravenous injection (n = 5–7/group). In the naive control mice, there was intrinsic regional variation of BBB permeability that was lowest in the cerebral cortex and higher in the brainstem and cerebellum. CSR increased the uptake of sodium fluorescein in cerebral cortex (t(10) = 2.57, p < 0.05), subcortical region (t(10) = 2.17, p = 0.056), brainstem (t(8) = 3.70, p < 0.01), and cerebellum (t(9) = 2.25, p = 0.05; Fig. 7A). The uptake in total brain also showed a significant increase in CSR mice in comparison with the control group (data not shown). The results indicate that CSR resulted in an increase of paracellular permeability of the BBB.
Figure 7.

Effect of CSR on BBB permeability. A, Sodium fluorescein uptake 10 min after intravenous injection in anesthetized mice was increased in cerebral cortex and brainstem in the CSR group (n = 5) in comparison with the naive control (n = 7). B, In the brain, there was regional variation of the distribution of biotin signal (shown by AlexaFluor 488-streptoavidin staining). Coronal section across the thalamus is shown for a naive mouse (top). CSR was associated with an increase of background fluorescence, and somewhat increased diameter of microvessels suggestive of increased capillary filling resulting from hyperemia (bottom). C, In the brainstem, there was also regional variation of biotin distribution in horizontal section across upper medulla at the level of the caudal fourth ventricle. Although the control section shows variation of biotin distribution in different areas, functional hyperemia is most apparent in the medial vestibular nucleus, and dye extravasation is seen in the parapyramidal nucleus in the ventral brainstem (arrows). D, Sodium fluorescein uptake 45 min after intraperitoneal injection in unanaesthetized mice was increased in all brain regions and spinal cord in the CSR mice (n = 7/group) compared with the naive control (n = 8) or those after 24 h of recovery sleep following 6 d of CSR (n = 5); *p < 0.05, **p < 0.01, ***p < 0.005. Scale bar, 100 μm.
Morphological evidence of the regional distribution of the increased BBB permeability was shown by use of the 557 Da biotin (Fig. 7B,C) and 3 kDa lysine-fixable dextran (data not shown). In naive mice, biotin fluorescence (shown by Alexa488-streptoavidin) at 30 min after intravenous injection delineated the cerebral vasculature. There were regional differences in vascular diameter, and many vessels appeared discontinuous in coronal sections without 3-D reconstruction of the images. In control mice, there was no apparent extravasation of biotin into brain parenchyma, reflected by a clear background with sharp contrast. In the CSR mice, there were patchy areas of fluorophore extravasation and an overall increase of background fluorescence suggestive of biotin extravasation into the parenchyma (Fig. 7B). There was also increased diameter of microvessels shown by representative images from the septal region and vestibular nuclei in the brainstem, suggestive of functional hyperemia (Fig. 7C). The distribution of 3 kDa lysine-fixable dextran was similar though not distinct, and the extravasation of the 66 kDa FITC-albumin was only confined to small areas such as the lateral hypothalamus (data not shown). The results suggest that the increase of paracellular permeability of the BBB was partial rather than extensive.
To test whether the increased BBB permeability to sodium fluorescein was reversible after 24 h of recovery sleep, three groups of mice were used (n = 10–12/group). In this study, sodium fluorescein was injected intraperitoneally in freely moving mice and allowed to circulate for 45 min before decapitation of the mice. Serum was obtained from trunk blood. Two-way ANOVA showed there were effects of treatment (F(2,84) = 30.88, p < 0.0001) and CNS region (F(4,84) = 21.24, p < 0.0001), without interactions between the two factors. One-way ANOVA showed that there was significant increase of sodium fluorescein uptake in cortex (F(2,19) = 18.52, p < 0.0001), subcortical region (F(2,19) = 19.1, p < 0.0001), brainstem (F(2,19) = 9.96, p < 0.01), cerebellum (F(2,19) = 3.85, p < 0.05), and spinal cord (F(2,18) = 6.11, p = 0.01). The increased uptake by the CSR group was significant in comparison with both the naive and recovery groups. The lack of difference between the recovery and naive groups supports a return of BBB integrity after 24 h of recovery sleep (Fig. 7D).
Neuroendocrine and inflammatory changes in CSR mice
Three groups of mice were studied (n = 6–7 mice/group): naive, CSR for 6 d, and CSR for 6 d followed by 24 h recovery. There was an overall increase of serum CRP (F(2,23) = 3.67, p < 0.05), with CSR group had higher level than the control mice (p < 0.05; Fig. 8A). There was no change of leptin concentration by overall ANOVA, though the recovery group appeared to show a higher level than the naive mice (t(12) = 3.81, p < 0.005 in unpaired t test; Fig. 8B). By contrast, serum corticosterone and IL-6 were unchanged (data not shown).
Figure 8.

Blood concentrations of CRP (A) and leptin (B). The CSR group showed an increase of serum CRP (*p < 0.05 from control), whereas the 24 h recovery group showed an increase of serum leptin from the control when comparison was made by unpaired t test.
Discussion
The BBB is a crucial regulatory interface for information exchange in many physiological and pathological states, but how it reacts to sleep disruption has not been fully elucidated. Here we show for the first time that CSR decreased the expression and function of glucose transporters, suppressed vascular reactivity with reduction of iNOS, eNOS and ET-1, increased the vascular inflammatory marker COX-2, and impaired TJ protein expression and BBB transport function. The results have wide implications for how CSR alters neuroendocrine regulation and could exert long-term consequences on transport across the BBB.
We used a CSR paradigm that produced consistent reduction of sleep efficiency as well as percentage of NREM and REM resulting from increased sleep fragmentation and higher total waking time. The pattern of sleep disruption resembles that of patients with severe sleep apnea, the most common disorder seen in a general sleep clinic. CSR for 6 d was sufficient to cause a series of biochemical changes in enriched cerebral microvessels representing the BBB, and to alter transporter functions as well as levels of protein expression.
Sleep is a homeostatic process. Sleep disruption may have opposite consequences depending on an acute or chronic course. Neurochemical and hormonal changes might include increased adenosine production, stress hormone release, or hyperleptinemia (Pan and Kastin, 2014). In mice after 6 d of CSR, we detected a mild increase of CRP but no change in leptin, IL-6, or corticosterone. Arousals may also lead to surges of blood pressure, which might alter cerebral autoregulation and increase shear stress of microvessels. Factors such as these could contribute to the changes of vascular reactivity. In the CSR mice, there was reduction of eNOS and iNOS. This suggests decreased production of nitric oxide, an important cellular signaling molecule contributing to BBB reactivity (Förstermann and Munzel, 2006; Yang et al., 2013). Nonetheless, detrimental roles of iNOS on BBB integrity have also been reported (Minami et al., 1998).
Contrary to the effect of nitric oxide resulting in vasodilation, increased blood flow, and reduction of oxidative stress, COX-2 is associated with vasoconstriction and vascular impairment (Minami et al., 1998). The production of reactive oxygen species by COX-2 activation is generally thought to induce endothelial dysfunction. The elevated COX-2 and downregulated iNOS and eNOS in our study reflect endothelial damage in the CSR mice. These changes may be parallel to or bear a causal relationship with impaired glucose transport and BBB permeability.
Glucose, the primary energy source for the CNS, crosses the BBB by facilitated transport, mainly mediated by GLUT1 (Maher et al., 1994). The 55 kDa isoform of GLUT1 has greater glycosylation and is located at both luminal and abluminal membranes of BBB endothelia (Gerhart et al., 1989). The 45 kDa isoform is expressed in astrocytic endfeet, an essential structure of the BBB (Morgello et al., 1995; Duelli and Kuschinsky, 2001). Enriched microvessels from the cerebral cortex still contain astrocytic components (Ouyang et al., 2014b). This is probably why we observed downregulation of both 55 and 45 kDa GLUT1 proteins in mice after CSR, along with their common encoding mRNA. The stage of anesthesia, as well as sleep–wake cycle, affects glucose utilization (Sokoloff et al., 1977). Therefore, we delivered 3H-2DG intraperitoneally in freely moving mice 45 min before decapitation, adopting a protocol commonly used in human positron emission tomography scanning. The reduction of glucose uptake in cerebral cortex and subcortical regions in the CSR group correlated with the reduced expression of GLUT1 at the BBB. This is consistent with the known kinetics of this high-affinity transporter that is not saturated in the test condition. Although it is conceivable that sleep and its disorders affect cerebral glucose metabolism (Petit et al., 2010), this is the first report, to our knowledge, showing that CSR reduces glucose transport across the BBB by downregulation of GLUT1 expression and function.
The expression and distribution of TJ proteins directly represent BBB function in conferring low permeability to nonlipophilic molecules. We observed lower expression of selective TJ proteins but a lack of change of several others. This is consistent with the differential regulation of different members of the TJ complex. The paracellular permeability of the BBB was assessed mainly with sodium fluorescein (376 Da) and biotin (557 Da), two classes of small molecules that do not cross an intact BBB. The increased tracer uptake from blood to the CNS in the CSR group suggests impaired BBB function. There is also functional hyperemia with increased size of small vessels. This is similar to what we have seen in mice with global neuroinflammation (Hsuchou et al., 2009, 2013), and it is indicative of altered vascular reactivity. This increased permeability, however, had regional variation and was not extensive. This differs from a recent report that selective REM deprivation for 10 d by the inverted flower pot method increased the extravasation of Evans blue albumin in rat brain (Gómez-González et al., 2013). The difference might be related to the method of sleep manipulation, the vigorousness of supportive data, and additional discrepant factors between laboratories. Selective REM sleep deprivation is thought to be more stressful than gentle handling or automatic sleep deprivation (Colavito et al., 2013). Nonetheless, there seemed to be a regional susceptibility of permeability changes as shown histologically by biotin distribution and extravasation.
In addition to serving as a common BBB permeability marker, sodium fluorescein is a substrate for organic anion transporter-3 and multidrug resistance protein (MRP)-2 at the BBB; glucose can upregulate sodium fluorescein efflux mediated by MRP-2 (Hawkins et al., 2007). In our study, sodium fluorescein uptake was increased by CSR, but MRP mRNA expression was unchanged (data not shown). If the increase of sodium fluorescein uptake was caused by attenuated efflux transporters, this would also reflect functional changes at the BBB. Similarly, biotin is a paracellular tracer but may also be subject to transport regulation. As a metabolic inhibitor, 2DG can inhibit the basolateral-to-apical transport of biotin across the endothelial monolayer, although there is only a small effect on apical-to-basolateral transport (Shi et al., 1993). Thus, although we did not use 2DG simultaneously in the biotin study, attenuated metabolic activity may contribute to the increased uptake of biotin. Regardless of these factors, partial BBB disruption in the CSR mice is clearly supported by the reduction of TJ protein expression at both protein and mRNA levels in our current study.
The increase of BBB permeability can be phasic and reversible, as an adaptive response to neuroendocrine regulation, and can serve protective roles in certain circumstances. Dramatic cases are exemplified by spinal cord injury (Pan et al., 1997, 1999, 2001) and stroke (Pan et al., 2006). An increase of BBB permeability can be seen in stressful situations alone, as mediated by substances, such as, norepinephrine, smoking, alcohol, mannitol, cocaine, and methamphetamine, as well as morphine withdrawal (Sharma and Ali, 2006). The mechanisms mediating BBB dysfunction are certainly disease specific and probably multifactorial. In the case of acute methamphetamine intoxication in freely moving rats, the transient increase of BBB permeability is related to hyperthermia and associated with pathological changes of acute glial activation, cerebral edema, and widespread upregulation of heat shock protein (Kiyatkin and Sharma, 2011). CSR not only reduces the amount of sleep, but also increases sleep fragmentation and dampens the circadian rhythm of sleep–wake activity. This results in global activation at each arousal. Among the potential major mediators, adrenergic hormones, adenosine and other neurotransmitters, inflammatory agents, and fluctuations of blood pressure can all affect cerebral autoregulation and compromise cerebral perfusion. This is supported by the observed decrease of iNOS, eNOS, and ET-1, as well as the increase of COX-2 in cerebral microvessels. Altered vascular reactivity and BBB inflammation could be parallel with or contribute to impaired glucose uptake and decreased glucose transporter function, and eventually result in disruption of the BBB.
With 6 d of CSR, the BBB damage was not as severe as that shown with 10 d of selective REM deprivation in rats by the inverted flower pot method, where Evan's blue albumin was extravasated throughout the brain (Gomez-Gonzalez et al., 2013). The reduction of glucose uptake and increase of BBB permeability were also reversed after 24 h of recovery sleep, coinciding with a return of normal TJ protein expression. These results have important implications in human health. First, the reversibility indicates the presence of crucial cytoprotective mechanisms that should be mobilized to treat human sleep disorders in which cerebral function is already impaired, such as severe sleep apnea. Second, it is essential to further understand possible threshold effects of the sleep disruption challenge and point of irreversibility. Third, CSR as an experimental maneuver in this study closely resembles the pattern of sleep loss in many patients with sleep apnea, parasomnia, or even severe primary insomnia. Sleep loss is a common practice in modern society. With comorbid medical conditions, CSR could permanently damage the BBB and contribute to neurodegeneration, as well as neuroendocrine dysfunction.
As described above, CSR increased COX-2 related inflammation, affected vascular reactivity, decreased glucose transporter and impaired BBB permeability. The BBB dysfunction after 6 d of CSR was reversed after 24 h of recovery sleep. This has wide implications for human health while addressing sleep loss and sleep disorders.
Footnotes
This work was supported by NIH Grants DK54880, DK92245, and NS62291.
The authors declare no competing financial interests.
References
- Abbott NJ. Cellular compositions of the blood–brain barrier (BBB) In: Kastin AJ, Pan W, editors. The blood–brain barrier. London: Henry Stewart Talks; 2008. [Google Scholar]
- Banks S, Dinges DF. Behavioral and physiological consequences of sleep restriction. J Clin Sleep Med. 2007;3:519–528. [PMC free article] [PubMed] [Google Scholar]
- Colavito V, Fabene PF, Grassi-Zucconi G, Pifferi F, Lamberty Y, Bentivoglio M, Bertini G. Experimental sleep deprivation as a tool to test memory deficits in rodents. Front Syst Neurosci. 2013;7:106. doi: 10.3389/fnsys.2013.00106. [DOI] [PMC free article] [PubMed] [Google Scholar]
- Duelli R, Kuschinsky W. Brain glucose transporters: relationship to local energy demand. News Physiol Sci. 2001;16:71–76. doi: 10.1152/physiologyonline.2001.16.2.71. [DOI] [PubMed] [Google Scholar]
- Förstermann U, Münzel T. Endothelial nitric oxide synthase in vascular disease: from marvel to menace. Circulation. 2006;113:1708–1714. doi: 10.1161/CIRCULATIONAHA.105.602532. [DOI] [PubMed] [Google Scholar]
- Gerhart DZ, LeVasseur RJ, Broderius MA, Drewes LR. Glucose transporter localization in brain using light and electron immunocytochemistry. J Neurosci Res. 1989;22:464–472. doi: 10.1002/jnr.490220413. [DOI] [PubMed] [Google Scholar]
- Gómez-González B, Hurtado-Alvarado G, Esqueda-León E, Santana-Miranda R, Rojas-Zamorano JÁ, Velázquez-Moctezuma J. REM sleep loss and recovery regulates blood–brain barrier function. Curr Neurovasc Res. 2013;10:197–207. doi: 10.2174/15672026113109990002. [DOI] [PubMed] [Google Scholar]
- Hawkins BT, Ocheltree SM, Norwood KM, Egleton RD. Decreased blood–brain barrier permeability to fluorescein in streptozotocin-treated rats. Neurosci Lett. 2007;411:1–5. doi: 10.1016/j.neulet.2006.09.010. [DOI] [PMC free article] [PubMed] [Google Scholar]
- He J, Wang Y, Kastin AJ, Pan W. Increased sleep fragmentation in experimental autoimmune encephalomyelitis. Brain Behav Immun. 2014;38:53–58. doi: 10.1016/j.bbi.2014.02.005. [DOI] [PubMed] [Google Scholar]
- Hsuchou H, Pan W, Wu X, Kastin AJ. Cessation of blood-to-brain influx of interleukin-15 during development of EAE. J Cereb Blood Flow Metab. 2009;29:1568–1578. doi: 10.1038/jcbfm.2009.79. [DOI] [PMC free article] [PubMed] [Google Scholar]
- Hsuchou H, Mishra PK, Kastin AJ, Wu X, Wang Y, Ouyang S, Pan W. Saturable leptin transport across the BBB persists in EAE mice. J Mol Neurosci. 2013;51:364–370. doi: 10.1007/s12031-013-9993-8. [DOI] [PMC free article] [PubMed] [Google Scholar]
- Kiyatkin EA, Sharma HS. Expression of heat shock protein (HSP 72 kDa) during acute methamphetamine intoxication depends on brain hyperthermia: neurotoxicity or neuroprotection? J Neural Transm. 2011;118:47–60. doi: 10.1007/s00702-010-0477-5. [DOI] [PMC free article] [PubMed] [Google Scholar]
- Krueger PM, Friedman EM. Sleep duration in the United States: a cross-sectional population-based study. Am J Epidemiol. 2009;169:1052–1063. doi: 10.1093/aje/kwp023. [DOI] [PMC free article] [PubMed] [Google Scholar]
- Louis RP, Lee J, Stephenson R. Design and validation of a computer-based sleep-scoring algorithm. J Neurosci Methods. 2004;133:71–80. doi: 10.1016/j.jneumeth.2003.09.025. [DOI] [PubMed] [Google Scholar]
- Maher F, Vannucci SJ, Simpson IA. Glucose transporter proteins in brain. FASEB J. 1994;8:1003–1011. doi: 10.1096/fasebj.8.13.7926364. [DOI] [PubMed] [Google Scholar]
- Minami T, Okazaki J, Kawabata A, Kawaki H, Okazaki Y, Tohno Y. Roles of nitric oxide and prostaglandins in the increased permeability of the blood–brain barrier caused by lipopolysaccharide. Environ Toxicol Pharmacol. 1998;5:35–41. doi: 10.1016/S1382-6689(97)10004-7. [DOI] [PubMed] [Google Scholar]
- Morgello S, Uson RR, Schwartz EJ, Haber RS. The human blood–brain barrier glucose transporter (GLUT1) is a glucose transporter of gray matter astrocytes. Glia. 1995;14:43–54. doi: 10.1002/glia.440140107. [DOI] [PubMed] [Google Scholar]
- Ouyang S, Hsuchou H, Kastin AJ, Mishra PK, Wang Y, Pan W. Leukocyte infiltration into spinal cord of EAE mice is attenuated by removal of endothelial leptin signaling. Brain Behav Immun. 2014a;40:61–73. doi: 10.1016/j.bbi.2014.02.003. [DOI] [PMC free article] [PubMed] [Google Scholar]
- Ouyang S, Hsuchou H, Kastin AJ, Wang Y, Yu C, Pan W. Diet-induced obesity suppresses expression of many proteins at the blood–brain barrier. J Cereb Blood Flow Metab. 2014b;34:43–51. doi: 10.1038/jcbfm.2013.166. [DOI] [PMC free article] [PubMed] [Google Scholar]
- Palmer GC. Neurochemical coupled actions of transmitters in the microvasculature of the brain. Neurosci Biobehav Rev. 1986;10:79–101. doi: 10.1016/0149-7634(86)90020-5. [DOI] [PubMed] [Google Scholar]
- Pan W, Kastin AJ. Diurnal variation of leptin entry from blood to brain involving partial saturation of the transport system. Life Sci. 2001;68:2705–2714. doi: 10.1016/S0024-3205(01)01085-2. [DOI] [PubMed] [Google Scholar]
- Pan W, Kastin AJ. Leptin: a biomarker for sleep disorders? Sleep Med Rev. 2014;18:283–290. doi: 10.1016/j.smrv.2013.07.003. [DOI] [PMC free article] [PubMed] [Google Scholar]
- Pan W, Banks WA, Kastin AJ. Blood–brain barrier permeability to ebiratide and TNF in acute spinal cord injury. Exp Neurol. 1997;146:367–373. doi: 10.1006/exnr.1997.6533. [DOI] [PubMed] [Google Scholar]
- Pan W, Kastin AJ, Bell RL, Olson RD. Upregulation of tumor necrosis factor a transport across the blood–brain barrier after acute compressive spinal cord injury. J Neurosci. 1999;19:3649–3655. doi: 10.1523/JNEUROSCI.19-09-03649.1999. [DOI] [PMC free article] [PubMed] [Google Scholar]
- Pan W, Kastin AJ, Gera L, Stewart JM. Bradykinin antagonist decreases early disruption of the blood-spinal cord barrier after spinal cord injury in mice. Neurosci Lett. 2001;307:25–28. doi: 10.1016/S0304-3940(01)01904-8. [DOI] [PubMed] [Google Scholar]
- Pan W, Cornélissen G, Halberg F, Kastin AJ. Selected contribution: circadian rhythm of tumor necrosis factor-alpha uptake into mouse spinal cord. J Appl Physiol. 2002;92:1357–1362. doi: 10.1152/japplphysiol.00915.2001. [DOI] [PubMed] [Google Scholar]
- Pan W, Ding Y, Yu Y, Ohtaki H, Nakamachi T, Kastin AJ. Stroke upregulates TNF alpha transport across the blood–brain barrier. Exp Neurol. 2006;198:222–233. doi: 10.1016/j.expneurol.2005.11.020. [DOI] [PubMed] [Google Scholar]
- Pan W, Yu C, Hsuchou H, Khan RS, Kastin AJ. Cerebral microvascular IL15 is a novel mediator of TNF action. J Neurochem. 2009;111:819–827. doi: 10.1111/j.1471-4159.2009.06371.x. [DOI] [PMC free article] [PubMed] [Google Scholar]
- Petit JM, Tobler I, Kopp C, Morgenthaler F, Borbély AA, Magistretti PJ. Metabolic response of the cerebral cortex following gentle sleep deprivation and modafinil administration. Sleep. 2010;33:901–908. doi: 10.1093/sleep/33.7.901. [DOI] [PMC free article] [PubMed] [Google Scholar]
- Sharma HS. Pathophysiology of blood–spinal cord barrier in traumatic injury and repair. Curr Pharm Des. 2005;11:1353–1389. doi: 10.2174/1381612053507837. [DOI] [PubMed] [Google Scholar]
- Sharma HS, Ali SF. Alterations in blood–brain barrier function by morphine and methamphetamine. Ann N Y Acad Sci. 2006;1074:198–224. doi: 10.1196/annals.1369.020. [DOI] [PubMed] [Google Scholar]
- Shi F, Bailey C, Malick AW, Audus KL. Biotin uptake and transport across bovine brain microvessel endothelial cell monolayers. Pharm Res. 1993;10:282–288. doi: 10.1023/A:1018903330985. [DOI] [PubMed] [Google Scholar]
- Sokoloff L, Reivich M, Kennedy C, Des Rosiers MH, Patlak CS, Pettigrew KD, Sakurada O, Shinohara M. The [14C]deoxyglucose method for the measurement of local cerebral glucose utilization: theory, procedure, and normal values in the conscious and anesthetized albino rat. J Neurochem. 1977;28:897–916. doi: 10.1111/j.1471-4159.1977.tb10649.x. [DOI] [PubMed] [Google Scholar]
- Veasey SC, Valladares O, Fenik P, Kapfhamer D, Sanford L, Benington J, Bucan M. An automated system for recording and analysis of sleep in mice. Sleep. 2000;23:1025–1040. [PubMed] [Google Scholar]
- Wang Y, He J, Kastin AJ, Hsuchou H, Pan W. Hypersomnolence and reduced activity in pan-leptin receptor knockout mice. J Mol Neurosci. 2013;51:1038–1045. doi: 10.1007/s12031-013-0093-6. [DOI] [PMC free article] [PubMed] [Google Scholar]
- Yang S, Chen Y, Deng X, Jiang W, Li B, Fu Z, Du M, Ding R. Hemoglobin-induced nitric oxide synthase overexpression and nitric oxide production contribute to blood–brain barrier disruption in the rat. J Mol Neurosci. 2013;51:352–363. doi: 10.1007/s12031-013-9990-y. [DOI] [PubMed] [Google Scholar]