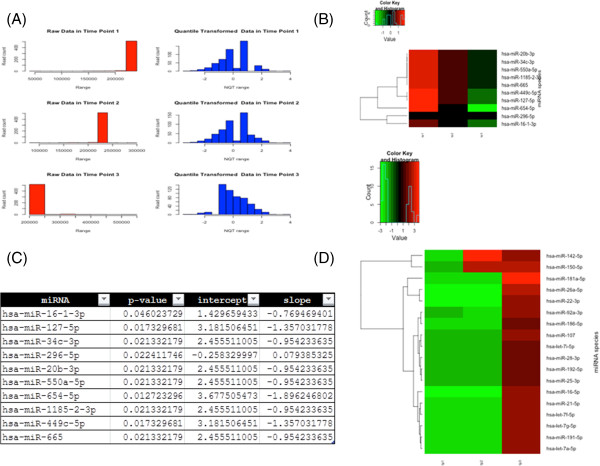
Figure 2.
mirnaTA Outputs. (A) A Portable Network Graphic (PNG) image showing the raw data (before normalization) vs. NQT data (after normalization). (B) A heat map of differentially expressed miRNAs with statistical significance (P < 0.05) which were identified to be linearly increasing or decreasing using linear regression model. (C) One of the many intermediate data files (shown here is a text file of P-values, intercept and slope data of significant miRNAs). (D) A heat map of differentially expressed miRNAs with statistical significance (P < 0.05) which were identified to be increasing or decreasing using either cumulative distribution function (CDF) of the normal distribution or analysis of variance (ANOVA). Note that all these images and text files are available for viewing on web browsers by opening ‘mirnata.html’ file in ‘output_files’ directory.

