
Figure 5.
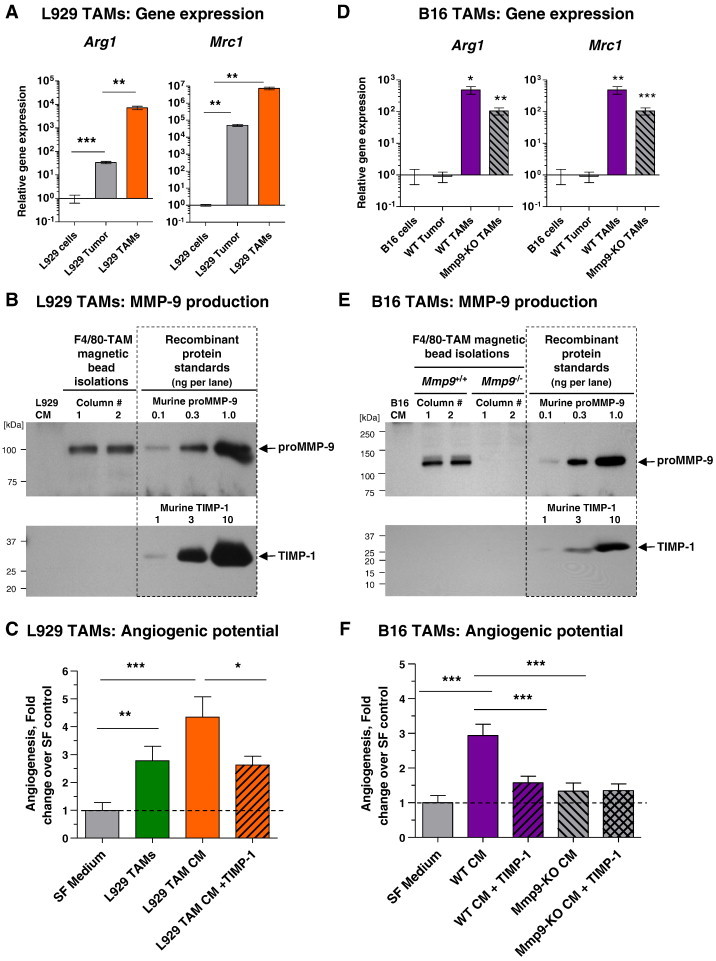
Genetic, biochemical, and functional analyses of TAMs isolated from L929 and B16 tumors. (A) Relative levels of Arg1 (left) and Mrc1 (right) expression were determined in isolated L929 TAMs and enzymatically dissociated tumors in comparison with the levels of gene expression in L929 cells in culture (1.0). Pooled data from four independent experiments, each performed in duplicate, are presented. (B) Samples of SF CM from 1 × 10⁵ parental L929 cells (left lane) or L929 TAMs, isolated independently from two tumors on two magnetic bead columns, were analyzed in the same Western blot for MMP-9 and TIMP-1. (C) Isolated L929 TAMs (3 × 10⁴ per onplant) or their SF 48-hour CM was analyzed for angiogenesis-inducing capacity. CM was incorporated alone or with recombinant TIMP-1 (4 ng per onplant). Pooled data from five independent experiments, each employing from four to six embryos grafted with four to six onplants per variant, are presented. Data are means ± SEM. *P < .05, **P < .001, ***P < .0001. (D) Relative levels of Arg1 (left) and Mrc1 (right) expression were determined in TAMs isolated from B16 tumors grown in WT or Mmp9-KO mice and in enzymatically dissociated WT tumors in comparison with the levels of gene expression in parental B16 cells in culture (1.0). Pooled data from two independent experiments, each performed in duplicate, are presented. (E) CM from 1 × 10⁵ parental B16 cells (left lane) or B16 TAMs isolated from two WT and two Mmp9-KO tumors was analyzed by Western blot analysis for MMP-9 and TIMP-1. (F) CM from B16-TAMs isolated from WT or Mmp9-KO mice was analyzed for angiogenesis-inducing capacity alone or with TIMP-1. Pooled data from three independent experiments, each employing from four to six embryos grafted with four to six onplants per variant, are presented. Data are means ± SEM. ***P < .0001.