

Abstract
ETS factors have been shown to be dysregulated in breast cancer. ETS factors control the expression of genes involved in many biological processes, such as cellular proliferation, differentiation, and apoptosis. FLI1 is an ETS protein aberrantly expressed in retrovirus-induced hematological tumors, but limited attention has been directed towards elucidating the role of FLI1 in epithelial-derived cancers. Using data mining, we show that loss of FLI1 expression is associated with shorter survival and more aggressive phenotypes of breast cancer. Gain and loss of function cellular studies indicate the inhibitory effect of FLI1 expression on cellular growth, migration, and invasion. Using Fli1 mutant mice and both a transgenic murine breast cancer model and an orthotopic injection of syngeneic tumor cells indicates that reduced Fli1 contributes to accelerated tumor growth. Global expression analysis and RNA-Seq data from an invasive human breast cancer cell line with over expression of either FLI1 and another ETS gene, PDEF, shows changes in several cellular pathways associated with cancer, such as the cytokine-cytokine receptor interaction and PI3K-Akt signaling pathways. This study demonstrates a novel role for FLI1 in epithelial cells. In addition, these results reveal that FLI1 down-regulation in breast cancer may promote tumor progression.
Abbreviations: Ad-FLI1, Ad-GFP-FLI1; EMT, Epithelial-mesenchymal transition; ER, Estrogen receptor; FLI1, Friend leukemia virus integration 1; GAPDH, Glyceraldehyde-3-phosphate dehydrogenase; GEO, Gene Expression Omnibus; GOBO, Gene expression-based Outcome for Breast cancer Online; IDC, Invasive ductal carcinoma; IHC, Immunohistochemistry; ILC, Invasive lobular carcinoma; N, Normal Breast Tissue; PDEF, Prostate-derived ETS factor; PyVT, FVB/N-Tg(MMTV-PyVT)634Mul/J; Rb, Retinoblastoma; T, Tumor; uPA, Urokinase plasminogen activator
Introduction
Breast cancer is the second most common cancer-related death among women in the United States. In 2014, approximately 232,670 women will be diagnosed with and 40,000 will die from invasive breast cancer [1]. Most breast cancer-related deaths are due to metastatic progression, as cells migrate from the primary tumor, invade, and re-establish at distant sites [2]. With conventional chemotherapies and radiation having minimal effect, metastatic breast cancer is generally incurable [3]. This failure is, in part, due to the fact that breast cancer is not a single disease, but a heterogeneous disease associated with variations in gene expression that misdirect the cancer cell to invade and migrate [3], [4]. This transcriptional activation or repression of cancer-associated genes is not clearly understood; however, many ETS family members function as oncogenes or tumor suppressors.
ETS transcription factors are highly conserved proteins with a unique winged helix-turn-helix DNA-binding domain. These proteins recognize a core 5′-GGA(A/T)-3′ sequence present in downstream target genes. ETS factors activate or repress genes involved in various biological processes, including cellular proliferation, differentiation, transformation, and apoptosis [5].
Several ETS factors are dysregulated in breast cancer: ETS1 and ETS2 are both up-regulated in breast cancer [6], [7]. PEA3 levels are positively associated with HER2/neu overexpressing human breast tumors [8]. The related PEA3 family gene, ERM is positively correlated with EGFR positive breast cancer and with poor overall survival [9]. ESE1 mRNA is overexpressed in DCIS, an early stage of human breast cancer [10]. In contrast, prostate-derived ETS factor (PDEF) is reduced in human invasive breast cancer tissue and absent in invasive breast cancer cell lines [11], [12], [13].
Friend leukemia virus integration 1 (FLI1) is a member of the ETS family, initially identified as a proto-oncogene as it is aberrantly-expressed in retrovirus-induced hematological tumors in mice [14]. In humans, FLI1 is rearranged in Ewing's sarcoma and related primitive neuroectodermal tumors characterized by a t(11;22)(q24;q12) translocation [15]. FLI1 is essential for embryonic development as its loss results in embryonic lethality due to the absence of megakaryocytes and aberrant vasculogenesis [16], [17], [18]. In normal adult tissues, FLI1 is expressed in hematopoietic cells and tissues, endothelial cells and fibroblasts[16], [17], [19] and along with GATA-1, has a critical role in the regulation of megakaryocyte differentiation [20]. In endothelial cells, FLI1 is important in vascular integrity regulates several vascular homeostasis genes such as VE-cadherin, PECAM1, PDGFB, and SIP1 receptor [21]. In fibroblasts, the loss of FLI1 results in an increase of collagen type I and a decrease in MMP1, thus contributing to the development of fibrosis [22], [23]. FLI1 regulates numerous biological processes in a number of different tissue types; however, limited attention has been directed towards elucidating the potential role of FLI1 in epithelial-derived cancers, including breast cancer.
In this study, we demonstrate that FLI1 is expressed in normal, and decreased in human and mouse mammary tumor tissue and human breast cell lines. Modulation of expression of FLI1 in breast cell lines and animal tumor models alters cell growth, migration, and invasion. Gene expression profiling using RNA-Seq identifies several cellular pathways modified by FLI1 over expression. The results of these experiments provide evidence for a novel and significant role for FLI1 in breast cancer.
Materials and Methods
Cell Culture
Human breast epithelial cell lines were maintained at 37°C with 5% CO2 in medium supplemented with 10% fetal bovine serum and 100 units penicillin/streptomycin. All cell lines were grown as recommended by their source. MCF-10A and MCF-12A were grown in DMEM/F12 with 5% horse serum, 100 U penicillin/streptomycin, EGF (20 ng/ml), insulin (10 μg/ml), cholera toxin (100 ng/ml), and hydrocortisone (0.5 μg/ml). The breast cancer cell lines CAMA-1, HBL-100, BT-474, and MDA-MB-175VII were a kind gift of R. Neve (Cancer Research Institute, University of California, San Francisco, CA; Lawrence Berkeley National Laboratory, Berkeley, CA), the MCF-10A cell line was a kind gift from B. Toole (Medical University of South Carolina, Charleston, SC), and the MCF-12A cell line was a kind gift from A. Gutierrez-Hartmann (University of Colorado Health Sciences Center, Denver, CO). All other lines were obtained from ATCC. During the course of the experiments described herein, all of the breast cell lines have maintained consistent morphology, doubling times, and tested negative for mycoplasma. MCF-10A and MDA-MB-231 were authenticated in July, 2011 at the Genetics Resource Core Facility at The Johns Hopkins University by using the Power Plex 1.2 system described (http://faf.grcf.jhmi.edu/str.html).
Data Mining
To determine the FLI1 mRNA expression levels in human breast tumors, FLI1 expression values were extracted from the public Gene Expression Omnibus data repository (GEO, http://www.ncbi.nlm.nih.gov/geoprofiles/) [24]. A microarray dataset of 60 micro-dissected estrogen receptor (ER) positive primary breast tumors was selected based on the large sample size [25]. The resulting profile displays the expression level of FLI1 across all samples within DataSet Record GDS807. FLI1 expression values in human breast tumors were also extracted from public datasets from Oncomine 4.4 Research Edition (Compendia Bioscience, Ann Arbor, MI). To find the resulting dataset the following filters were used: Gene: FLI1; Analysis Type: Cancer vs. Normal; Cancer Type: Breast. The data sets were ordered by under-expression: p-values and the datasets selected for analysis and visualization were the top two with the most significant P values (Zhao Breast and Richardson Breast 2) [26], [27]. Expression levels of FLI1 in 1881 breast cancer samples, broken down into subtypes, and 51 breast cancer cell lines was obtained from the online tool GOBO, Gene expression-based Outcome for Breast cancer Online (http://co.bmc.lu.se/gobo) [28]. In addition, GOBO was used to assess relapse free survival and overall survival based on expression level of FLI1 in these tumors as well as co-expressed gene pathways [28].
Immunohistochemistry
Tissue microarray slides were obtained through Imgenex (San Diego, CA) from SuperBioChips in Korea (Imgenex is their US distributor) (http://www.tissue-array.com/ver3/index.php) and were collected under discarded tissue protocols (tissue in excess of that needed for diagnosis). Additional human breast cancer samples were obtained from the Pathology Department at the Medical University of South Carolina (MUSC, Charleston, SC). These tissues were obtained from consented patients who agreed to have material not needed for pathological diagnosis be available for research purposes. Specimens were provided under an Exempt IV research MUSC IRB for human research (HR 19968, DKW).
All of the specimens were formalin-fixed and paraffin-embedded. Antigen retrieval and immunohistochemical staining were performed as previously described; however, NovaRed was used for the substrate [12]. Anti-FLI1 antibodies, previously prepared [29], were used at 1:800 dilution. All of the sections were examined independently by a pathologist (T.R.). We regarded cells as immunohistochemically positive when the FLI1 signal was observed in the cell nuclei. The overall IHC score was calculated by multiplying the staining intensity (0 to 4 +) by the % of positive cells [IHC score = Σ(intensity) × % positive cells]. Images were taken at 40 × using a Nikon Eclipse 90i upright semi-automated microscope with a Nikon DS-Fi1 camera.
Mouse tumor and lung tissue sections were processed as above and stained with antibodies recognizing Ki67 (Thermo Scientific, Waltham, MA), CD31 (Abcam, Cambridge, UK) and activated Caspase 3 (Cell Signaling, Beverly, Massachusetts). Quantification of staining for Ki67 was determined by counting of individual stained cells in five 40 × field. For CD31, quantification was determined by counting the number of vessels per field, measuring the length of vessels and area of field occupied by stained vessels using ImageJ. Activated caspase-3 was quantified by counting individual positively stained cells per 20 × field.
Western Blot
Cells were lysed in radioimmunoprecipitation assay buffer (5 mM Tris pH 8.0, 1% NP40, 0.15 M NaCl, 0.1% SDS, 0.5% Na-deoxycholate) containing protease inhibitor cocktail (Pierce, Rockford, IL). Equal amounts of protein were resolved by SDS-PAGE and subjected to Western blot analysis using enhanced chemilluminescence (Pierce). Rabbit polyclonal antibody against FLI1, previously prepared [29], was used at a 1:1000 dilution. Anti-FLAG M5 monoclonal antibody was used at a 1:500 dilution (Sigma-Aldrich, St. Louis, MO). Glyceraldehyde-3-phosphate dehydrogenase (GAPDH) rabbit polyclonal antibody (Abcam, Cambridge, MA) was used at a 1:1000 dilution. Secondary anti-Rabbit and Mouse IgG (GE Healthcare, Piscataway, NJ) were used at a 1:2000 dilution.
Reverse Transcription and Real-Time PCR
RNA extraction, reverse transcription, and real-time PCR were performed as previously described[30]. Primer sequences and probe numbers are described (Supplementary Table SI).
Adenoviral Infection
The construction of FLI1-expressing and PDEF-expressing adenovirus has been previously described [12], [31]. Cells were infected in normal growth medium using the lowest dilution of either control virus expressing green fluorescent protein (Ad-GFP) or virus expressing FLI1/GFP (Ad-FLI1) or PDEF/GFP (Ad-PDEF) that yielded > 95% infected MDA-MB-231 cells assessed by GFP expression. Infected cells were then incubated as normal for 16 to 20 hours.
shRNA Design and Transduction
Five lentiviral transduction particles encoding for shRNA against FLI1 were purchased from Sigma-Aldrich. These five 21-nucleotide shRNA duplexes targeting five different regions of the human FLI1 mRNA (GenBank accession number NM_002017) were designed using the MISSION search database (www.sigma-aldrich.com/missionsearch). The shRNA sequences tested are presented in Supplementary Table SII. MCF-10A cells were transduced with lentivirus, either FLI1 shRNA or non-targeting control, following the manufacturer's protocol. Transduced cells were selected in puromycin-containing (2 μg/ml) cell culture medium. Viable cells from the 96-well plates were expanded and maintained in media containing 1 μg/ml puromycin. Inhibition of FLI1 protein expression was determined by Western blot analysis. Two of the five sequences were selected for biological assays.
Plasmid Transfection
FLI1 cDNA was subcloned into pFcDNA3.1, as previously described [31]. MCF-10A cells stably transfected with FLI1 shRNA were transiently transfected with either FLI1 expressing pFcDNA3.1 or control pFcDNA using FuGENE HD (Roche), per manufacturer's protocol.
Cell growth assays
Cell counts and viability measurements were performed using the Countess optics and image automated cell counter (Invitrogen, Carlsbad, CA) using standard trypan blue staining. Floating and attached cells were combined to obtain numbers of apoptotic and viable cells.
Transwell Migration and Invasion Assays
Treated or untreated control cells were seeded in triplicate into the upper chamber of a Transwell insert (BD Biosciences, San Jose, CA) in 0.1% serum or serum-free medium (MCF-10A or MDA-MB-231; respectively) at a density of 50,000 cells per well. For migration assays, inserts were pre-coated with 5 μg/mL fibronectin (Fisher Scientific, Pittsburgh, PA). Medium containing 0.5% or 10% serum (MCF-10A or MDA-MB-231; respectively) was placed in the lower chamber to act as a chemo-attractant, and cells were further incubated for 6 or 12 hours. (MDA-MB-231 or MCF-10A; respectively). Cells were counted in 10 random microscope fields in three independent inserts. Error bars represent the SD from three separate experiments. Invasion assays were performed as for the migration assays described above, except inserts were pre-coated with the extracellular matrix (ECM) substitute Matrigel (BD Biosciences) and incubated over a 24-hour period. Incubation times were chosen so that cell proliferation would not affect the number of cells invading or migrating.
Animals and Syngeneic Cell Lines
FVB/N-Tg(MMTV-PyVT)634Mul/J mice (PyVT) were obtained from Jackson Laboratory (Bar Harbor, ME) [32] and crossed to wild-type FVB/N and Fli1 heterozygous (FVB/N bkg; N>8) mice [17]. Mice were housed and handled according to approved Institutional Animal Care and Use Committee protocols. PyVT positive animals were identified by PCR and gel electrophoresis using primer sequences and protocol from Jackson Laboratory. Females were palpated biweekly beginning at 6 weeks of age for tumor formation. The first tumor palpated was measured biweekly (volume = width2 × length) until it reached 2 cm3 volume at which time the mouse was sacrificed. At sacrifice, total tumor burden was determined, tumor tissue and lungs were fixed for paraffin embedding and lung, liver, kidney, and spleen tissue was snap frozen for RNA. The EO771 cells [33] were obtained from Dr. Ratna B. Ray, PhD., Saint Louis University [34]. 5 × 10⁵ cells were injected into the left inguinal mammary gland (#4) of a female wild-type C57BL6 mouse. The tumor was harvested three weeks post injection, cells were dispersed, cultured for 48 hours in DMEM with 20% FBS and frozen. These 1 × in vivo passaged cells were then used for the following experiments: EO771 cells (5 × 10⁵) were injected into the left inguinal mammary gland (#4) of wild-type C57BL6, Fli1 (C57BL6 background) heterozygous or Fli1ΔCTA/ΔCTA females. The mammary gland was palpated and measured biweekly until the tumor reached a volume of 2 cm3 or the animal showed distress. The mice were sacrificed, tumor, and lung tissue were fixed for paraffin embedding and snap frozen.
RNA-Seq and Bioinformatics
RNA was isolated from Ad-GFP, Ad-FLI1, and Ad-PDEF infected MDA-MB-231 breast cancer cells and 100–200 ng of total RNA was used to prepare RNASeq libraries using the TruSeq RNA Sample Prep Kit following the protocol as described by the manufacturer (Illumina, San Diego, CA). A bioinformatic pipeline based upon the Tuxedo pipeline [35] was developed to process the RNA-Seq data on a local instance of a Galaxy Project server [36]. Two RNAseq data files, containing forward and reverse reads, were generated from each of the RNA samples using paired end (PE) sequencing. FastQC was used to visualize the quality of the sequenced RNA for each dataset. Each set of PE read files was run through Trimmomatic [37] to remove low quality base pairs and sequence adapters (synthetic sequences of DNA that are used to amplify and sequence the cDNA during RNAseq) using these parameters [ILLUMINACLIP:TruSeq3-PE.fa:2:30:10 LEADING:3 TRAILING:3 SLIDINGWINDOW:4:20 MINLEN:36]. The Trimmomatic website (http://www.usadellab.org/cms/index.php?page=trimmomatic) provides detailed information on the parameters used.
TopHat 2 (v0.5) [35] was used to map the PE files to the human genome (hg19) with default parameters. TopHat outputs a binarily compressed sequence alignment/map (BAM) file containing the accepted transcript alignments. The aligned transcripts were then quantified to ascertain gene and isoform expression values using Cufflinks (v2.1.1) [38] while performing bias correction, quartile normalization, and multi-read correction. hg19 was used for the reference genome (FASTA format) and annotation (GTF format). The assembled isoforms from each of the RNA samples were aggregated using CuffMerge (v1.0.0) [38] without reference annotation or sequences. Cuffdiff (v2.1.1) [38] was used to analyze the samples as a whole, while performing bias correction, quartile normalization, and multi-read correction. The tool takes as input the aggregated isoforms GTF file from CuffMerge and the aligned transcript files from TopHat, which were specified as being one of two phenotypic groups [39].
Pathway Guide (Advaita, Plymouth, MI) was used to identify the significant biological pathways using log base 2-fold changes from the Tuxedo pipeline. The top 20 pathways in PDEF and the top 20 pathways in FLI1 not in the PDEF ranked set were selected for further evaluation. The union of these two sets of pathways was then further explored on a per-gene basis. Specifically, given a pathway, the gene sets in FLI1 were compared to the gene sets in PDEF.
Statistical Analysis
For statistical testing, two-sided paired Student's t tests were performed using Excel spread sheet for migration/invasion and real-time RT-PCR assays. Two-way ANOVA tests were done using GraphPad Prism 4 for cell viability assays. Error bars represent SDs of three independent experiments, unless indicated otherwise. Two sided unpaired Student's t test was used to determine statistical significance of Ki67 and activated Caspase 3 staining. Survival studies used log-rank (Mantell-Cox) test in Graph-Pad Prism 5. P values are given for each individual experiment, but in general, P < .05 was considered statistically significant. Tumor growth curves were analyzed by linear regression and the slopes and y intercepts analyzed to determine if the lines were different (Graph-Pad Prism 5).
Results
FLI1 Levels are Reduced in Human Breast Cancer and Cell Lines
Gene Expression Omnibus (GEO) [24] and Oncomine databases were reviewed to determine FLI1 mRNA expression levels in human breast tumors. Unpublished microarray data on estrogen receptor (ER)-positive invasive human breast tumors [25], obtained from GEO Profiles, demonstrated a decrease in FLI1 expression in 57 of the 60 invasive human breast tumors compared to reference RNA (Figure 1A) (GEO accession GDS807) [24]. The Oncomine database, from two additional studies [26], [27], again demonstrated that FLI1 mRNA levels are significantly decreased in invasive human breast tumors (invasive ductal carcinoma; IDC and invasive lobular carcinoma; ILC) compared to normal breast tissue (Figure 1B).
Figure 1.
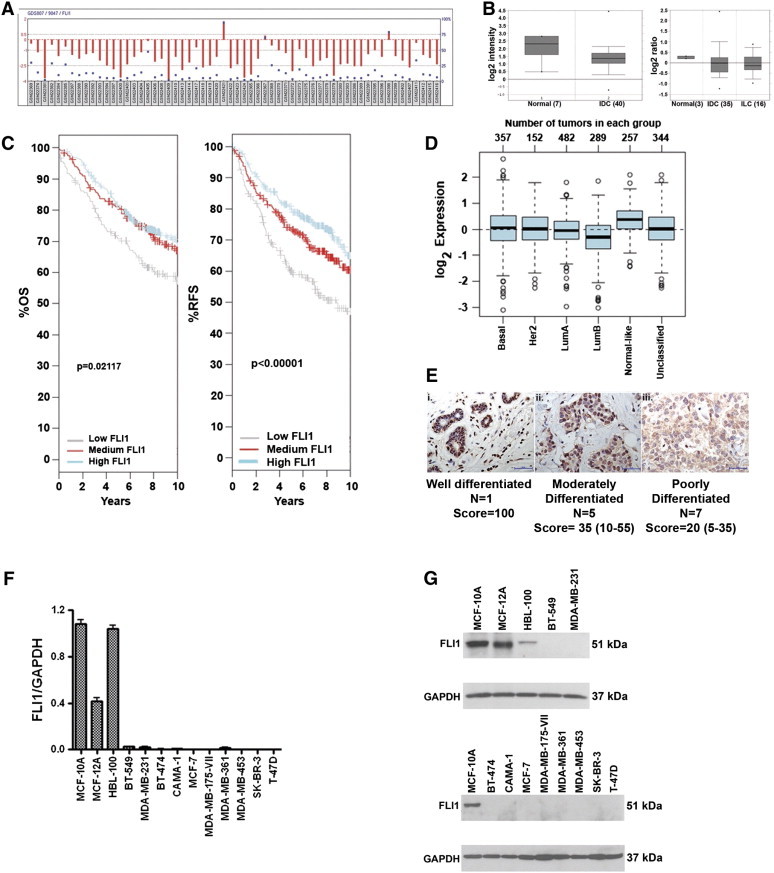
FLI1 expression is reduced in human breast cancer and in breast cell lines. (A) GEO database: FLI1 mRNA levels obtained from 60 ER + invasive breast tumor samples. GEO accession GDS807 (Ref. 30). (B) Oncomine database: Left, FLI1 mRNA levels from 7 normal breast samples compared to 40 invasive ductal carcinomas (IDC) (Ref. 31). Right, FLI1 mRNA levels from 3 normal breast samples compared to 35 IDC and 16 invasive lobular carcinomas (ILC) (Ref. 32). (C) GOBO database: overall survival and relapse-free survival for tertiles of FLI1 expression in 1881 breast tumors. 1 +; occasional nucleus 2 + (IHC score: 115, IHC T/N: 33%)) (magnification = 400 ×; scale bar = 50 μm). (D) (E) Relative FLI1 expression in different subtypes of breast cancer. (F) RT-PCR of FLI1 mRNA from human breast cancer cell lines normalized to GAPDH, (representative of two independent experiments, run in triplicate). (G) Western blot analysis of FLI1 protein expression levels in human breast cell lines.
The GOBO (http://co.bmc.lu.se/gobo) online tool was used to examine FLI1 expression in 1881 breast cancers from eleven different studies [28]. Looking at survival from breast cancer, patients with the lowest third expression level of FLI1 had a shorter overall survival and shorter relapse-free survival than patients in the middle and highest expression level of FLI1 (Figure 1C). Comparing FLI1 expression across different subtypes of breast cancer [40] shows that the more aggressive subtype, Luminal B, has the lowest FLI1 expression, while the less aggressive, normal-like subtype has the highest expression of FLI1 (Figure 1D). FLI1 expression by Breast Cancer subtype is shown in Supplemental Figure 1.
We next examined FLI1 protein expression by immunohistochemistry (IHC). FLI1 protein is expressed in the nuclei of normal human breast epithelial tissue (Figure 1Ei). However, this expression is decreased as the tumor progresses from moderately differentiated (Figure 1Eii) to poorly differentiated invasive breast cancer (Figure 1Eiii). The IHC score for all 13 samples examined is presented under Figure 1E (T: Tumor; N: Normal Breast Tissue). Thus, the IHC analysis demonstrates that FLI1 protein is reduced in less well differentiated tumors and supports the results obtained from the data mining of FLI1 mRNA.
A decrease of FLI1 mRNA and protein was also observed in breast cancer-derived cell lines. 13 breast cell lines were analyzed and only three (HBL-100, MCF-10A, and MCF-12A) have significant mRNA (Figure 1F) and detectable FLI1 protein (Figure 1G). MCF-10A and MCF-12A are non-transformed, spontaneously immortalized human mammary epithelial cell lines, while HBL-100 is an SV40-immortalized human mammary epithelial cell line. In contrast, FLI1 mRNA and protein levels were lost or not detectable in the breast cancer-derived cell lines tested. FLI1 expression was also compared across breast cancer cell lines separated into subtypes, basal A, basal B, and luminal, and clinical subtypes, triple negative (TN), Her2 positive (HER2), and hormone receptor positive (HR) using the GOBO website [41]. Basal A subtype had the lowest expression of FLI1, while basal B subtype had higher and luminal intermediate expression (P = 0.00192) (Supplementary Figure 1). No significant difference was seen between the clinical subtypes (data not shown).
FLI1 Expression Inhibits Cellular Growth
MDA-MB-231 cells were selected as a model to examine the functional consequences of FLI1 re-expression. We first determined if the re-expression of FLI1 impacted viable cell number. MDA-MB-231 cells infected with Ad-GFP-FLI1 (Ad-FLI1) exhibit a 73% and 65% decrease in viable cells by day three post infection when compared to parental and Ad-GFP controls; respectively (Figure 2A). The apoptotic fraction for the parental control and Ad-GFP at 72 hours was 3%, while the re-expression of FLI1 led to an increase in the percentage of apoptotic cells to 8.3% (Figure 2B). Although statistically significant, this is not sufficient to explain the effect on overall cell growth. To better understand the molecular mechanisms for FLI1-mediated inhibition of cell growth, cell-cycle analysis was performed 36 and 72 hours after infection with either Ad-GFP or Ad-FLI1 (Figure 2C). Compared to uninfected and Ad-GFP infected cells, the expression of FLI1 did not significantly change the percent of cells in any of the cell cycle phases.
Figure 2.
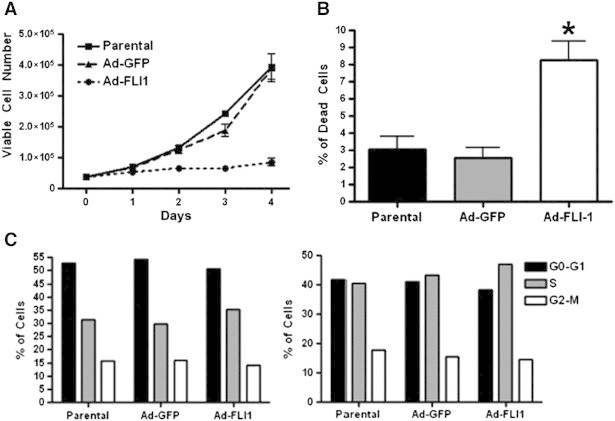
FLI1 re-expression inhibits growth of human invasive breast cancer cells. (A) Cell viability assay of parental (uninfected) cells, or cells infected with Ad-GFP or Ad-FLI1, P < .05 by two-way ANOVA. (B) Percent of dead cells at 72 hours post infection with Ad-GFP or Ad-FLI1, compared to parental (uninfected) cells. (C) Cell cycle analysis by flow cytometry of parental cells, or cells infected with Ad-GFP or Ad-FLI1, 36 hours (left) and 72 hours (right) post adenoviral infection.*P < .05 by Student's t test.
FLI1 Expression Inhibits Migration and Invasion
We next determined the effect of FLI1 expression on the motility and invasiveness of the MDA-MB-231 cells. Compared to both the parental and Ad-GFP controls, FLI1 expression reduced the number of migrating cells by 71% (Figure 3A). The re-expression of FLI1 also reduced the number of invading cells by 87% (Figure 3B). Therefore, the re-expression of FLI1 significantly reduces the migratory and invasive potential of invasive breast cancer cells.
Figure 3.
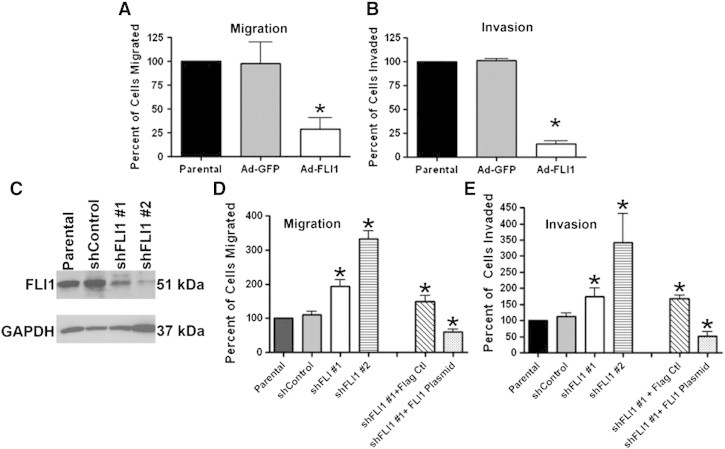
FLI1 expression inhibits cell migration and invasion. (A and B) Quantification of cells migrated across fibronectin-coated (A) or matrigel-coated (B) transwells. The columns represent average values of cells migrating/invading as a percentage of parental (uninfected) cells. (C) Western blot analysis of MCF-10A cells stably infected with either shFLI1 #1 or shFLI1 #2 using anti-FLI1 antibody. (D and E) Quantification of cells migrated across fibronectin-coated (D) or matrigel-coated (E) transwells. The columns represent average values of cells migrating as a percentage of parental (uninfected) cells. *P < .05 by Student's t test.
Reciprocal loss-of-function studies were performed by knocking down FLI1 in MCF-10A cells using two different shRNA lentiviruses (one targeting the 3′ UTR, shFLI1 #1; the other targets the coding sequence, shFLI1 #2). Verification of knockdown was determined by Western blot analysis (Figure 3C), where shFLI #1 had 70% and shFLI1 #2 had 90% knockdown when compared to parental and short hairpin control. Compared to both the parental and shRNA controls, the knockdown of FLI1 expression increased the number of migrating cells by 48% for shFLI1 #1 and 70% for shFLI1 #2 (Figure 3D). The knockdown of FLI1 expression also increased the number of invading cells by 43% for shFLI1 #1 and 71% for shFLI1 #2 (Figure 3E).
To demonstrate that the change in migration and invasion was the result of knocking down FLI1 and not due to off target effects of the short hairpin, the MCF-10A cells stably infected with shFLI1 #1 were transiently transfected with a plasmid vector expressing FLI1. shFLI1 #1 was selected for the rescue experiment due to its target sequence within the 3′UTR. The re-expression of FLI1 in the MCF-10A shFLI1 #1 cells significantly decreased the number of cells able to migrate and invade compared to MCF-10A shFLI1 #1 cells transfected with Flag control (59% and 70% decrease; respectively) (Figure 3E). Taken together these results suggest that FLI1 contributes to the regulation/of migration and invasion in breast cell lines.
Fli1 Mutant Mice Demonstrate Enhanced Tumor Growth Compared to Wild Type Mice
Fli1 knockout mice were created by homologous recombination [17], backcrossed to FVB/N mice and then crossed to mice expressing the MMTV-PyVT transgene [32]. The Fli1 homozygous knockout is embryonic lethal so heterozygous knockout mice were compared to wild-type FVB/N mice. Median tumor-free survival was shorter for the MMTV-PyVT-Fli1 heterozygotes (59.5 days) than the wild type (70 days, P < .03; Figure 4A). The tumors from the heterozygotes also grew faster (rate of growth +/− 34.4 mm3/day vs. wt. 26.8 mm3/day; P < .015; Figure 4B). Overall survival was also significantly different, with median survival for heterozygous being 102 days vs. 109 for wild type (P < .03) (Figure 4C). There was no difference in index tumor volume (heterozygotes=2095 +/− 499 mm3; wild-type=2039 +/− 412) or total weight of all mammary tumors (heterozygotes = 12 +/− 4.6 g; wild type = 12.6 +/− 4.5 g).
Figure 4.
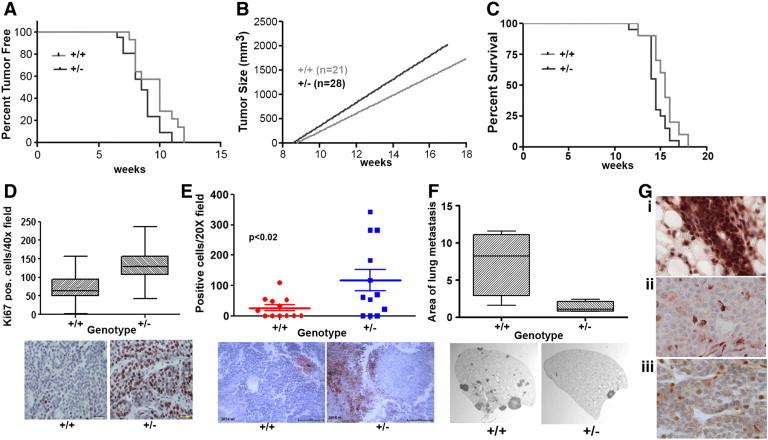
Fli1 expression level effects tumor growth and metastases. (A) Tumor-free survival of PyVT wild-type and PyVT-Fli1 +/− mice (Log-Rank test P = .043). (B) Growth of tumors in PyVT wild-type and PyVT-Fli1 +/− mice. Significance of the difference between the two slopes. (p=0.015) (C) Overall survival of PyVT wild-type and PyVT-Fli1 +/− mice (log-rank test P = .048) (D) Ki67 staining in tumors from PyVT wild-type and Fli1 +/− mice (P < .0001 by t test). Representative tumor sections stained for Ki67, (scale bar = 250 μm). (E) Activated caspase-3 staining in tumors from PyVT wild-type and Fli1 +/− mice (P < .02). Representative tumor sections stained with antibody to activated Caspase-3, (scale bar = 250 μm). (F) Area of lung metastases from PyVT wild-type and Fli1 +/− mice (P = .03). Representative sections of H&E stained lung lobes (12.5 ×). (G) Fli1 staining of normal mouse mammary gland (i) and PyVT tumors from wild-type (ii) and Fli1 +/− (iii) (40 ×) showing loss of Fli1 in tumor cells.
No difference was seen in the number of CD31 positive cells/field, the area of CD31 positive vessels or the length of CD31 positive vessels between the genotypes of the Fli1 PyVT mice (data not shown). Ki67 staining was higher in the heterozygotes than in wild type. In the heterozygotes there were 132.4 Ki-67 positive cells per 40 × field compared to 71.5 positive cells in the wild type (P < .0001) (Figure 4D). In addition, activated caspase-3 was higher in the heterozygotes than the wild type. There was an average of 26.1 positive cells in each 20 × field for the wild type versus 117.6 for the heterozygotes (P = .022) (Figure 4E). The number of lung metastases was higher in the wild-type mice but the difference was not significant; however, lung metastases were larger in the wild-type mice. The total percent area occupied by metastases in the wild-type lungs was 7.4% versus 1.4% for heterozygous lungs (P < .05) (Figure 4F). To determine the difference in Fli-1 protein levels between the two genotypes, the tumors were stained with FLI1 antibody. Tumor epithelial cells in both wild-type and Fli1 heterozygous mice were negative for Fli1 staining (Figure 4Gii and iii). In contrast, normal mammary gland epithelial cells were highly Fli1 positive (Figure 4Gi). Thus, both wild-type and heterozygous tumor cells have lost expression of Fli1, in addition, tumor stromal cells also express reduced Fli1 in wild type (Figure 4Giii), and expression is even lower in heterozygotes (Figure 4Gii).
In order to further evaluate the role of stromal Fli1 in tumor progression, an orthotopic model of breast cancer was also explored in two different mutants of Fli1. The EO771 cell line is derived from a spontaneous mammary gland tumor in a C57BL6 mouse [33]. The Fli1ΔCTA/ΔCTA mice lack the C-terminal regulatory domain of Fli1 involved in activation or repression of gene transcription, thus affecting a subset of Fli1 functions. No difference in tumor initiation was seen between the Fli1ΔCTA/ΔCTA and the wild-type mice; however, the tumor growth rate was significantly different between the two genotypes (Figure 5A). The rate of growth for the wild type was 29 mm3/day and for the Fli1ΔCTA/ΔCTA it was 43 mm3/day (P = .03). Also, the number of lung metastases was greater in the Fli1ΔCTA/ΔCTA (2.29 +/− 0.78) than in the wild type (0.25 +/− 0.16; P = .017) (Figure 5B). The EO771 cells were also orthotopically injected into C57BL6 Fli1 heterozygous mice and wild-type mice. As with the Fli1ΔCTA/ΔCTA mice, the tumors in the Fli1 +/− mice grew faster than in the wild type (wild type 52.5 +/− 5 mm3/day; Fli1 +/−, 71.1 +/− 6 mm3/day; P = .02) (Figure 5C) and survival time was greater for the wild type (median survival, for wild type = 42 days; for Fli1 +/− = 37 days; P < .05; Log-Rank (Mantell-Cox) test) (Figure 5D). There was no significant difference in the number or size of lung metastases, CD31 staining, number of activated caspase-3 positive cells or number of Ki67 positive cells (data not shown).
Figure 5.
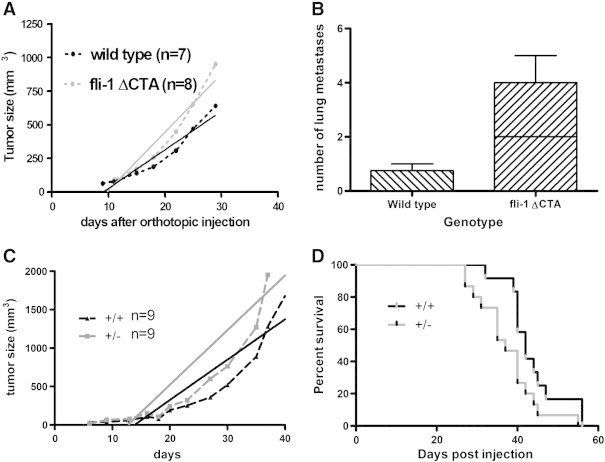
Effect of Fli1 genotype on growth of orthotopically injected EO771 cells. (A) Tumor growth in wild-type C57BL6 and Fli1ΔCTA mice. Dotted lines are actual tumor growth and solid lines are calculated linear regression of tumor growth (significance of difference between slopes P < .03) (B) Number of lung metastases in EO771 injected wild-type C57BL6 and Fli1 ΔCTA mice (P < .02). (C) EO771 tumor growth in wild-type C57BL6 and Fli1 +/− mice. (Significance of difference between slopes P < .02) (D) Overall survival of EO771 injected wild-type and Fli1 +/− mice (log-rank P < .05).
FLI1 Modulates the Expression of Genes That Control Cancer Progression
FLI1 is a transcription factor and its loss in tumors should alter the expression of many genes contributing to cancer progression. PDEF is another ETS family member lost in breast cancer [11], [12], [13]. Our laboratory has previously shown that re-expression of PDEF inhibits proliferation, migration, and invasion [11], [12], [42]. We have identified several direct downstream targets of PDEF responsible for tumor progression. Since FLI1 has similar effects on cellular growth, migration, and invasion, we examined these downstream effectors with over expression of FLI1. We selected three candidates: p21, SLUG and urokinase plasminogen activator (uPA) [12], [13], [30], [43]. Similar to the re-expression of FLI1, an adenoviral delivery system was used to over-express PDEF in MDA-MB-231 cells and the Western blot indicates that the infected MDA-MB-231 cell lines both markedly over express PDEF and FLI1 (Figure 6A). p21 was increased significantly with the re-expression of FLI1 and PDEF (88% and 92% increase, respectively when compared to parental) (Figure 6B). As previously shown [30], PDEF re-expression results in a decrease in the expression level of SLUG mRNA. However, the decrease in SLUG expression was not as robust with the re-expression of FLI1 as was seen with PDEF (FLI1: 46% decrease; PDEF: 86% decrease when compared to parental) (Figure 6C). The re-expression of FLI1 did not inhibit the expression of uPA to the extent observed with PDEF (FLI1: 11% decrease; PDEF: 75% decrease when compared to parental) (Figure 6D).
Figure 6.
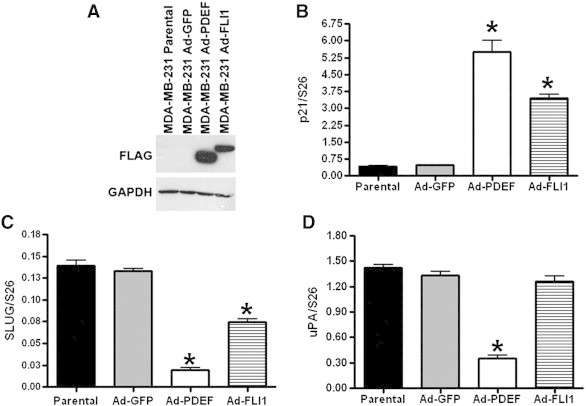
FLI1 and PDEF modulate the expression of genes that control invasion and metastasis. (A) Western blot analysis of parental and Ad-GFP, Ad-FLI1, or Ad-PDEF infected MDA-MB-231 cells using anti-FLAG M5 antibody. (B) p21 mRNA expression levels in breast cancer cell lines normalized to S26: control (uninfected) cells, or cells infected with Ad-GFP or Ad-PDEF or Ad-FLI1. (C) qRT-PCR of SLUG and (D) uPA mRNA expression levels in breast cancer cell lines normalized to S26: control (uninfected) cells, or cells infected with Ad-GFP, Ad-PDEF, or Ad-FLI1. Each graph is an average of two independent experiments, run in triplicate. * P b .05.
FLI1 Targets Cancer Progression by Modulation of Cancer Pathways
Using the parental and MDA-MB-231 cell lines over expressing GFP (Ad-GFP), FLI1 (Ad-FLI1), or PDEF (Ad-PDEF), global gene expression was analyzed using RNA-Seq and our bioinformatic pipeline. Fold expression compared to Ad-GFP was determined and differences between Ad-FLI1 and Ad-PDEF compared. Figure 7A shows a global representation of the FPKM (Fragments per Kilobase of transcript per Million mapped reads) values as a function of the number of genes in each value. To visualize the difference in expression of individual genes by either PDEF or FLI1, scatter plots representing the expression of genes down regulated (Figure 7B) by over expression of PDEF alone, by FLI1 alone and both and the up regulation (Figure 7C) of genes compared to GFP were created. Individual genes have been grouped into categories according to whether or not the fold change observed in PDEF and/or FLI1 is greater than 2. Genes falling near or on the line are responding in approximately equal magnitude. A Venn diagram demonstrates the differences in gene expression caused by FLI1 over expression and PDEF overexpression (Figure 7D). FLI1 expression uniquely up regulated 274 and down regulated 237 genes. PDEF expression uniquely increased expression of 1056 genes and decreased expression of 895 genes. There are 450 genes that are increased by both FLI1 and PDEF and 215 were decreased by both. 24 genes were up regulated by either FLI1 or PDEF and decreased by the other treatment. Log2 values for expression levels of all genes altered either 2 fold up or down is in supplementary tables IV (PDEF) and V (FLI1).
Figure 7.
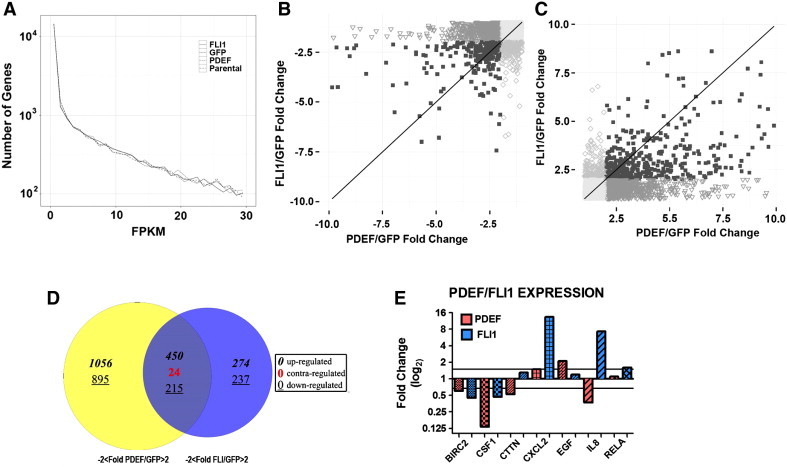
FLI1 and PDEF modulate the expression of many genes associated with cancer. (A) This plot was created by computing the frequency density of the FPKM values for each group using the programming language R and the ggplot2 library. An upper limit on the FPKM (x-axis) was introduced for visibility purposes. (B and C) Plot of the fold change values of PDEF/GFP vs. the fold change values of FLI1/GFP. Individual points on the graph represent genes, and the genes are subdivided into groups based on whether the fold change was above 2 in both phenotypes (■) a single phenotype (▼PDEF; ◊FLI1), or neither phenotype (○). Plots were created with the programming language R using the ggplot2 library. The fold change of FLI1/GFP versus the fold change of PDEF/GFP. Positive fold changes shown in (B) correspond to increases in expression of treatment (FLI1 and PDEF) versus GFP. Negative fold changes shown in (C) correspond to decreases in expression of treatment versus GFP. (D) Venn diagram showing the number of genes over or under expressed in AdPDEF and AdFLI1 treated cells. Italicised numbers are positively altered genes, underlined are negatively altered. Numbers in each circle are those unique to each cell line. In the center is the number of genes that are either changed in the same direction by AdPDEF and AdFLI1 or those changed in the opposite direction (grey number). (E) Fold change levels of selected genes validated by qPCR. Red bars: AdPDEF transfected MDA-MB231. Blue bars: AdFLI1 transfected MDA-MB231.
The RNA-Seq data was downloaded into Pathway Guide (Advaita, Plymouth, MI) to determine which biochemical pathways were affected by over expression of either FLI1 or PDEF. Pathway-Guide incorporates the topology of the pathway into the analysis. Table 1 shows the top 10 pathways for each treatment and where that pathway ranked in the other treatment group. Also shown are the number of genes in each pathway and the number that are changed by either FLI1 or PDEF or both. The complete Pathway Guide results are shown in Supplemtary Table III. Many of these pathways are important to cancer progression, such as cytokine-cytokine receptor interaction and PI3K-Akt signaling pathways, ranked number 1 and 2 for FLI1, and MAPK signaling pathway and TGF-β signaling pathway, ranked 1 and 2 for PDEF. A small set of genes in pathways that were affected by both FLI1 and PDEF were selected for validation by qPCR. Interleukin 8 (IL8) is a member of the cytokine-cytokine receptor interaction pathway and the chemokine family. It is a major mediator of the inflammatory response and a potent angiogenic factor. It is significantly up regulated by FLI1 over expression (~ 10 fold) but is down-regulated by PDEF over expression (~ 2 fold) (Figure 7E). In contrast, BIRC2, baculoviral IAP repeat containing 2, is down regulated by over expression of both PDEF and FLI1 by approximately 2 fold (Figure 7E). EGF, epidermal growth factor, is a member of many biological pathways. It is up regulated by FLI1 (~ 2-fold) and down-regulated by PDEF (2.5-fold). Other genes validated by qPCR are CSF1, CTTN, CXCL2, and RELA. All of these are involved in multiple biological pathways that affect proliferation, survival and migration, and invasion. All of which are characteristics of cancer cells.
Table 1.
Top ten pathways identified by Pathway Guide for over expression of FLI1 (first 10 rows) and PDEF (second 10 rows).
| Pathway | FLI1 Rank | PDEF Rank | Number of Genes in Pathway | Number of Significant in FLI1 | Number of Significant in PDEF | Genes Shared | Unique FLI1 Genes | Unique PDEF Genes |
|---|---|---|---|---|---|---|---|---|
| Cytokine-cytokine receptor interaction | 1 | 45 | 267 | 40 | 54 | 32 | 8 | 22 |
| PI3K-Akt signaling pathway | 2 | 25 | 347 | 155 | 177 | 145 | 10 | 32 |
| Toxoplasmosis | 3 | 65 | 122 | 32 | 37 | 27 | 5 | 10 |
| Phosphatidylinositol signaling system | 4 | 1 | 81 | 18 | 26 | 14 | 4 | 12 |
| Proteoglycans in cancer | 5 | 4 | 226 | 49 | 104 | 44 | 5 | 60 |
| Measles | 6 | 35 | 134 | 24 | 34 | 15 | 9 | 19 |
| Salmonella infection | 7 | 94 | 88 | 14 | 13 | 9 | 5 | 4 |
| Focal adhesion | 8 | 3 | 206 | 95 | 110 | 86 | 9 | 24 |
| Pathways in cancer | 9 | 17 | 327 | 140 | 183 | 123 | 17 | 60 |
| Hippo signaling pathway | 10 | 14 | 156 | 49 | 75 | 46 | 3 | 29 |
| MAPK signaling pathway | 11 | 2 | 260 | 48 | 75 | 39 | 9 | 36 |
| TGF-beta signaling pathway | 41 | 5 | 81 | 50 | 59 | 49 | 1 | 10 |
| Gap junction | 43 | 11 | 89 | 27 | 47 | 25 | 2 | 22 |
| Viral carcinogenesis | 47 | 6 | 207 | 14 | 38 | 10 | 4 | 28 |
| Neurotrophin signaling pathway | 48 | 12 | 120 | 34 | 41 | 28 | 6 | 13 |
| P53 signaling pathway | 49 | 8 | 68 | 55 | 58 | 55 | 0 | 3 |
| Estrogen signaling pathway | 74 | 13 | 100 | 65 | 75 | 64 | 1 | 11 |
| Cell cycle | 88 | 9 | 124 | 37 | 62 | 36 | 1 | 26 |
| Insulin signaling pathway | 102 | 10 | 140 | 62 | 86 | 60 | 2 | 26 |
| Fanconi anemia pathway | 112 | 7 | 54 | 3 | 21 | 2 | 1 | 19 |
Discussion
In this study we investigate a novel role for FLI1 in breast cancer. Most previous studies involving FLI1 used hematopoietic or stromal cells, therefore the function of FLI1 in epithelial cells is not well known. Published data on FLI1 and its role in breast cancer progression is limited. Earlier studies in mice found reduced FLI1 mRNA and cDNA in mammary tumors compared to normal tissue and cell lines [44] and in human breast cancer cell lines and tumor tissue compared to immortalized human breast epithelial cell lines [45]. Contrary to the above studies, another report found that the expression of FLI1 contributes to the progression of human breast cancer by regulating the bcl-2 gene; thus, inhibiting apoptosis [46]. These conflicting results indicate the need for additional biological studies on the role of FLI1 in breast cancer progression. Our studies demonstrate that FLI1 is reduced or lost in human breast cancer tissue; this loss is associated with more aggressive cancer and shorter survival and leads to an increase in proliferation, invasion, migration, and metastasis.
Previous studies defined a role for FLI1 in cell growth and differentiation in erythroleukemic cells. One of these studies demonstrated that FLI1 binds to an ETS consensus site within the retinoblastoma (Rb) gene, leading to the transcriptional repression of Rb and maintenance of cell growth [47]. Other studies in erythroleukemic cells revealed that FLI1 negatively regulates the tumor suppressor p53 by directly binding to and up-regulating MDM2 [48]. These studies suggest that FLI1 may act as an oncogene by promoting proliferation and attenuating p53 function in hematopoietic cells. In addition, tumor cell formation results from the translocation associated production of FLI1 chimeric proteins as has been shown for Ewing's sarcomas (EWS) and related primitive neuroectodermal tumors (PNET). However, these mechanisms may not apply to epithelial cells.
In the animal models, we show the effect of gene dosage of Fli1 on tumor growth and the expression of proteins associated with cancer progression, such as Ki67. In the PyVT model, loss of a single allele of Fli1 in the heterozygotes leads to earlier and accelerated tumor growth and higher Ki67 expression in the tumor cells. However, the wild-type mice show larger lung metastases but no difference in number.
The EO771 cells do not express Fli1, therefore the differences seen between the wild-type and heterozygous mice are due to intra-tumoral stromal cells such as fibroblasts and macrophages. Two different models of in vivo Fli1 manipulation were used for these studies. The Fli1 heterozygous mice express half the level of Fli1 as the wild-type mice, while the Fli1ΔCTA/ΔCTA mice completely lack a functional domain. Both models showed accelerated tumor growth compared to wild-type mice; however, the Fli1ΔCTA/ΔCTA mice also demonstrated an increased number of lung metastases, suggesting that Fli1 activity plays a significant role early in tumor metastasis. Fli1 has been established as a regulator of stromal cell function. Fli1 negatively regulates both α-smooth muscle actin and collagen type 1 both characteristics of activated tumor stroma [23], [49]. Fli1 has also been shown to negatively regulate MMP1, a protein often up regulated in breast cancer and important for tumor cell invasion [50].
Ectopic expression of FLI1 and PDEF, individually, increase the level of p21 mRNA; however, this results in a G0-G1 cell cycle arrest only with PDEF expression [11], [51]. Under stress conditions, p21 is activated by p53 leading to cell cycle arrest, but under normal conditions p21 acts as a cell cycle regulator at the G1/S phase [52], [53]. FLI1 inhibits migration and invasion of human breast cancer cells, similarly to what was observed for PDEF in our previous studies. However, known PDEF targets, SLUG and uPA, did not have similar responses when FLI1 was re-expressed [12], [13]. These results suggest that FLI1 is regulating migration and invasion through alternative as well as overlapping pathways.
To better understand the difference between FLI1 and PDEF directed gene expression, we performed RNA-Seq using a malignant human breast cancer cell line (MDA-MB-231) ectopically expressing either FLI1 or PDEF. Analysis using Pathway Guide ranked the pathways affected by the over-expression of FLI1 or PDEF (Table 1). Two of the higher ranking pathways were phosphatidylinositol signaling (ranked #4 for FLI1 and #1 for PDEF) and proteoglycans in cancer (ranked #5 for FLI1 and #4 for PDEF). The proteoglycans in cancer pathway is involved in cell proliferation and cell migration and invasion, both functions that are modified by FLI1 and PDEF expression. Phosphatidylinositol signaling affects cell survival, again effected by FLI1 and PDEF expression. Other high-ranking pathways for FLI1 expression are Cytokine Receptor Interaction (#1) and PI3K-Akt Signaling (#2). Both of these pathways influence cell survival and proliferation. Additional pathways modified by PDEF are MAPK Signaling (#2) and Focal Adhesion (#3). These pathways also contribute to cell proliferation and survival. In addition, the Focal Adhesion Pathway modulates cell motility. Many of the genes with altered expression are found in multiple pathways, such that altered expression of a few or a single gene will affect many pathways.
Our study supports a novel role for FLI1 in an epithelial setting. Loss of FLI1 in the breast epithelial cells has similar effects, such as increased migration and invasion, as the loss of PDEF. However, in contrast to PDEF, FLI1 is not restricted to the epithelial compartment, being expressed in the endothelium and stromal fibroblasts. Our animal studies show the impact of stromal Fli1 expression and loss. Thus, another focus of future studies will be to further elucidate the role of FLI1 in the tumor microenvironment, and its contribution to the aggressiveness of breast cancer. Furthermore, a greater understanding of how FLI1 regulates cancer progression in breast cancer cells may reveal downstream effectors that can be used as novel markers for improved detection or patient diagnosis, and ultimately serve as unique therapeutic targets.
The following are the supplementary data related to this article.
PCR Primers and Probes for Real Time PCR.
Sequences of Lentiviral shRNA Against FLI1.
Pathway Guide Table.
PDEF log2f.
FLI1 log2f.
FLI1 Expression in Breast Cancer Cell Lines by Subtype.
Competing Interests
The authors declare that they have no competing interests.
Acknowledgments
This work was supported in part by a grant from the National Institutes of Health (P01CA78582). The authors also acknowledge support from Margaret Romano (Hollings Cancer Center Biorepository and Research Pathology Service) and the Flow Cytometry & Cell Sorting (FCCS) Shared Resource of the Hollings Cancer Center, the Hollings Cancer Center Genomics Core Facility, and Matt R. Paul of the College of Charleston Genomics Core. The FCCS shared resource is supported in part by the Hollings Cancer Center, Medical University of South Carolina Support Grant (P30 CA 138313).
This manuscript is dedicated to the fond memory of Victor Fung, Ph.D., a former Program Officer at NCI and former Scientific Review Officer of the Cancer Etiology study section of CSR, NIH, for his wisdom, compassion, integrity, his love of sciences and the arts, his incredible culinary skills, and above all, his contributions to the career development of so many investigators during his own distinguished career.
Contributor Information
Melissa N. Scheiber, Email: morrismn@musc.edu.
Patricia M. Watson, Email: watsondk@musc.edu.
Tihana Rumboldt, Email: tihanarumboldt@gmail.com.
Connor Stanley, Email: stanleyct@g.cofc.edu.
Robert C. Wilson, Email: wilsorc@musc.edu.
Victoria J. Findlay, Email: findlay@musc.edu.
Paul E. Anderson, Email: andersonpe2@cofc.edu.
Dennis K. Watson, Email: watsondk@musc.edu.
References
- 1.Siegel R., Ma J., Zou Z., Jemal A. Cancer statistics, 2014. CA Cancer J Clin. 2014;64(1):9–29. doi: 10.3322/caac.21208. [DOI] [PubMed] [Google Scholar]
- 2.Guarino M., Rubino B., Ballabio G. The role of epithelial-mesenchymal transition in cancer pathology. Pathology. 2007;39(3):305–318. doi: 10.1080/00313020701329914. [DOI] [PubMed] [Google Scholar]
- 3.Mego M., Mani S.A., Cristofanilli M. Molecular mechanisms of metastasis in breast cancer-clinical applications. Nat Rev Clin Oncol. 2010;7(12):693–701. doi: 10.1038/nrclinonc.2010.171. [DOI] [PubMed] [Google Scholar]
- 4.Vargo-Gogola T., Rosen J.M. Modelling breast cancer: one size does not fit all. Nat Rev Cancer. 2007;7(9):659–672. doi: 10.1038/nrc2193. [DOI] [PubMed] [Google Scholar]
- 5.Seth A., Watson D.K. ETS transcription factors and their emerging roles in human cancer. Eur J Cancer. 2005;41(16):2462–2478. doi: 10.1016/j.ejca.2005.08.013. [DOI] [PubMed] [Google Scholar]
- 6.Buggy Y., Maguire T.M., McGreal G., McDermott E., Hill A.D., O'Higgins N., Duffy M.J. Overexpression of the Ets-1 transcription factor in human breast cancer. Br J Cancer. 2004;91(7):1308–1315. doi: 10.1038/sj.bjc.6602128. [DOI] [PMC free article] [PubMed] [Google Scholar]
- 7.Buggy Y., Maguire T.M., McDermott E., Hill A.D., O'Higgins N., Duffy M.J. Ets2 transcription factor in normal and neoplastic human breast tissue. Eur J Cancer. 2006;42(4):485–491. doi: 10.1016/j.ejca.2005.10.018. [DOI] [PubMed] [Google Scholar]
- 8.Benz C.C., O'Hagan R.C., Richter B., Scott G.K., Chang C.H., Xiong X., Chew K., Ljung B.M., Edgerton S., Thor A. HER2/Neu and the Ets transcription activator PEA3 are coordinately upregulated in human breast cancer. Oncogene. 1997;15(13):1513–1525. doi: 10.1038/sj.onc.1201331. [DOI] [PubMed] [Google Scholar]
- 9.Chotteau-Lelievre A., Revillion F., Lhotellier V., Hornez L., Desbiens X., Cabaret V., de Launoit Y., Peyrat J.P. Prognostic value of ERM gene expression in human primary breast cancers. Clin Cancer Res. 2004;10(21):7297–7303. doi: 10.1158/1078-0432.CCR-04-0593. [DOI] [PubMed] [Google Scholar]
- 10.Chang C.H., Scott G.K., Kuo W.L., Xiong X., Suzdaltseva Y., Park J.W., Sayre P., Erny K., Collins C., Gray J.W. ESX: a structurally unique Ets overexpressed early during human breast tumorigenesis. Oncogene. 1997;14(13):1617–1622. doi: 10.1038/sj.onc.1200978. [DOI] [PubMed] [Google Scholar]
- 11.Turner D.P., Moussa O., Sauane M., Fisher P.B., Watson D.K. Prostate-derived ETS factor is a mediator of metastatic potential through the inhibition of migration and invasion in breast cancer. Cancer Res. 2007;67(4):1618–1625. doi: 10.1158/0008-5472.CAN-06-2913. [DOI] [PubMed] [Google Scholar]
- 12.Feldman R.J., Sementchenko V.I., Gayed M., Fraig M.M., Watson D.K. Pdef expression in human breast cancer is correlated with invasive potential and altered gene expression. Cancer Res. 2003;63(15):4626–4631. [PubMed] [Google Scholar]
- 13.Turner D.P., Findlay V.J., Kirven A.D., Moussa O., Watson D.K. Global gene expression analysis identifies PDEF transcriptional networks regulating cell migration during cancer progression. Mol Biol Cell. 2008;19(9):3745–3757. doi: 10.1091/mbc.E08-02-0154. [DOI] [PMC free article] [PubMed] [Google Scholar]
- 14.Ben-David Y., Giddens E.B., Bernstein A. Identification and mapping of a common proviral integration site Fli-1 in erythroleukemia cells induced by Friend murine leukemia virus. Proc Natl Acad Sci U S A. 1990;87(4):1332–1336. doi: 10.1073/pnas.87.4.1332. [DOI] [PMC free article] [PubMed] [Google Scholar]
- 15.Truong A.H., Ben-David Y. The role of Fli-1 in normal cell function and malignant transformation. Oncogene. 2000;19(55):6482–6489. doi: 10.1038/sj.onc.1204042. [DOI] [PubMed] [Google Scholar]
- 16.Hart A., Melet F., Grossfeld P., Chien K., Jones C., Tunnacliffe A., Favier R., Bernstein A. Fli-1 is required for murine vascular and megakaryocytic development and is hemizygously deleted in patients with thrombocytopenia. Immunity. 2000;13(2):167–177. doi: 10.1016/s1074-7613(00)00017-0. [DOI] [PubMed] [Google Scholar]
- 17.Spyropoulos D.D., Pharr P.N., Lavenburg K.R., Jackers P., Papas T.S., Ogawa M., Watson D.K. Hemorrhage, impaired hematopoiesis, and lethality in mouse embryos carrying a targeted disruption of the Fli1 transcription factor. Mol Cell Biol. 2000;20(15):5643–5652. doi: 10.1128/mcb.20.15.5643-5652.2000. [DOI] [PMC free article] [PubMed] [Google Scholar]
- 18.Kawada H., Ito T., Pharr P.N., Spyropoulos D.D., Watson D.K., Ogawa M. Defective megakaryopoiesis and abnormal erythroid development in Fli-1 gene-targeted mice. Int J Hematol. 2001;73(4):463–468. doi: 10.1007/BF02994008. [DOI] [PubMed] [Google Scholar]
- 19.Asano Y., Markiewicz M., Kubo M., Szalai G., Watson D.K., Trojanowska M. Transcription factor Fli1 regulates collagen fibrillogenesis in mouse skin. Mol Cell Biol. 2009;29(2):425–434. doi: 10.1128/MCB.01278-08. [DOI] [PMC free article] [PubMed] [Google Scholar]
- 20.Jackers P., Szalai G., Moussa O., Watson D.K. Ets-dependent regulation of target gene expression during megakaryopoiesis. J Biol Chem. 2004;279(50):52183–52190. doi: 10.1074/jbc.M407489200. [DOI] [PubMed] [Google Scholar]
- 21.Asano Y., Stawski L., Hant F., Highland K., Silver R., Szalai G., Watson D.K., Trojanowska M. Endothelial Fli1 deficiency impairs vascular homeostasis: a role in scleroderma vasculopathy. Am J Pathol. 2010;176(4):1983–1998. doi: 10.2353/ajpath.2010.090593. [DOI] [PMC free article] [PubMed] [Google Scholar]
- 22.Czuwara-Ladykowska J., Shirasaki F., Jackers P., Watson D.K., Trojanowska M. Fli-1 inhibits collagen type I production in dermal fibroblasts via an Sp1-dependent pathway. J Biol Chem. 2001;276(24):20839–20848. doi: 10.1074/jbc.M010133200. [DOI] [PubMed] [Google Scholar]
- 23.Nakerakanti S.S., Kapanadze B., Yamasaki M., Markiewicz M., Trojanowska M. Fli1 and Ets1 have distinct roles in connective tissue growth factor/CCN2 gene regulation and induction of the profibrotic gene program. J Biol Chem. 2006;281(35):25259–25269. doi: 10.1074/jbc.M600466200. [DOI] [PubMed] [Google Scholar]
- 24.Barrett T., Troup D.B., Wilhite S.E., Ledoux P., Rudnev D., Evangelista C., Kim I.F., Soboleva A., Tomashevsky M., Marshall K.A. NCBI GEO: archive for high-throughput functional genomic data. Nucleic Acids Res. 2009;37(Database issue):D885–D890. doi: 10.1093/nar/gkn764. [DOI] [PMC free article] [PubMed] [Google Scholar]
- 25.Ma X.J., Wang Z., Ryan P.D., Isakoff S.J., Barmettler A., Fuller A., Muir B., Mohapatra G., Salunga R., Tuggle J.T. A two-gene expression ratio predicts clinical outcome in breast cancer patients treated with tamoxifen. Cancer Cell. 2004;5(6):607–616. doi: 10.1016/j.ccr.2004.05.015. [DOI] [PubMed] [Google Scholar]
- 26.Richardson A.L., Wang Z.C., De Nicolo A., Lu X., Brown M., Miron A., Liao X., Iglehart J.D., Livingston D.M., Ganesan S. X chromosomal abnormalities in basal-like human breast cancer. Cancer Cell. 2006;9(2):121–132. doi: 10.1016/j.ccr.2006.01.013. [DOI] [PubMed] [Google Scholar]
- 27.Zhao H., Langerod A., Ji Y., Nowels K.W., Nesland J.M., Tibshirani R., Bukholm I.K., Karesen R., Botstein D., Borresen-Dale A.L. Different gene expression patterns in invasive lobular and ductal carcinomas of the breast. Mol Biol Cell. 2004;15(6):2523–2536. doi: 10.1091/mbc.E03-11-0786. [DOI] [PMC free article] [PubMed] [Google Scholar]
- 28.Ringner M., Fredlund E., Hakkinen J., Borg A., Staaf J. GOBO: gene expression-based outcome for breast cancer online. PLoS One. 2011;6(3):e17911. doi: 10.1371/journal.pone.0017911. [DOI] [PMC free article] [PubMed] [Google Scholar]
- 29.Zhang X.K., Papas T.S., Bhat N.K., Watson D.K. Generation and characterization of monoclonal antibodies against the ERGB/FLI-1 transcription factor. Hybridoma. 1995;14(6):563–569. doi: 10.1089/hyb.1995.14.563. [DOI] [PubMed] [Google Scholar]
- 30.Findlay V.J., Turner D.P., Yordy J.S., McCarragher B., Schriver M.R., Szalai G., Watson P.M., LaRue A.C., Moussa O., Watson D.K. Prostate-derived ETS factor regulates epithelial-to-mesenchymal transition through both SLUG-dependent and independent mechanisms. Genes Cancer. 2011;2(2):120–129. doi: 10.1177/1947601911410424. [DOI] [PMC free article] [PubMed] [Google Scholar]
- 31.Kubo M., Czuwara-Ladykowska J., Moussa O., Markiewicz M., Smith E., Silver R.M., Jablonska S., Blaszczyk M., Watson D.K., Trojanowska M. Persistent down-regulation of Fli1, a suppressor of collagen transcription, in fibrotic scleroderma skin. Am J Pathol. 2003;163(2):571–581. doi: 10.1016/S0002-9440(10)63685-1. [DOI] [PMC free article] [PubMed] [Google Scholar]
- 32.Guy C.T., Cardiff R.D., Muller W.J. Induction of mammary tumors by expression of polyomavirus middle T oncogene: a transgenic mouse model for metastatic disease. Mol Cell Biol. 1992;12(3):954–961. doi: 10.1128/mcb.12.3.954. [DOI] [PMC free article] [PubMed] [Google Scholar]
- 33.Kanaya T., Hase K., Takahashi D., Fukuda S., Hoshino K., Sasaki I., Hemmi H., Knoop K.A., Kumar N., Sato M. The Ets transcription factor Spi-B is essential for the differentiation of intestinal microfold cells. Nat Immunol. 2012;13(8):729–736. doi: 10.1038/ni.2352. [DOI] [PMC free article] [PubMed] [Google Scholar]
- 34.Kohyama M., Ise W., Edelson B.T., Wilker P.R., Hildner K., Mejia C., Frazier W.A., Murphy T.L., Murphy K.M. Role for Spi-C in the development of red pulp macrophages and splenic iron homeostasis. Nature. 2009;457(7227):318–321. doi: 10.1038/nature07472. [DOI] [PMC free article] [PubMed] [Google Scholar]
- 35.Trapnell C., Roberts A., Goff L., Pertea G., Kim D., Kelley D.R., Pimentel H., Salzberg S.L., Rinn J.L., Pachter L. Differential gene and transcript expression analysis of RNA-seq experiments with TopHat and Cufflinks. Nat Protoc. 2012;7(3):562–578. doi: 10.1038/nprot.2012.016. [DOI] [PMC free article] [PubMed] [Google Scholar]
- 36.Goecks J., Nekrutenko A., Taylor J. Galaxy: a comprehensive approach for supporting accessible, reproducible, and transparent computational research in the life sciences. Genome Biol. 2010;11(8):R86. doi: 10.1186/gb-2010-11-8-r86. [DOI] [PMC free article] [PubMed] [Google Scholar]
- 37.Lohse M., Bolger A.M., Nagel A., Fernie A.R., Lunn J.E., Stitt M., Usadel B. RobiNA: a user-friendly, integrated software solution for RNA-Seq-based transcriptomics. Nucleic Acids Res. 2012;40(Web Server issue):W622–W627. doi: 10.1093/nar/gks540. [DOI] [PMC free article] [PubMed] [Google Scholar]
- 38.Trapnell C., Williams B.A., Pertea G., Mortazavi A., Kwan G., van Baren M.J., Salzberg S.L., Wold B.J., Pachter L. Transcript assembly and quantification by RNA-Seq reveals unannotated transcripts and isoform switching during cell differentiation. Nat Biotechnol. 2010;28(5):511–515. doi: 10.1038/nbt.1621. [DOI] [PMC free article] [PubMed] [Google Scholar]
- 39.Anderson Paul E., McCaffrey Victoria A., Hazard E. Starr, Watson Patricia M., Paul Matt R., Wilson Robert, Denlinger Chadrick E., Watson Dennis K. 2014. Predictive modeling of lung cancer recurrence using alternative splicing events versus differential expression data; pp. 1–8. (Computational Intelligence in Bioinformatics and Computational Biology, 2014 IEEE Conference on). [Google Scholar]
- 40.Hu Z., Fan C., Oh D.S., Marron J.S., He X., Qaqish B.F., Livasy C., Carey L.A., Reynolds E., Dressler L. The molecular portraits of breast tumors are conserved across microarray platforms. BMC Genomics. 2006;7:96. doi: 10.1186/1471-2164-7-96. [DOI] [PMC free article] [PubMed] [Google Scholar]
- 41.Neve R.M., Chin K., Fridlyand J., Yeh J., Baehner F.L., Fevr T., Clark L., Bayani N., Coppe J.P., Tong F. A collection of breast cancer cell lines for the study of functionally distinct cancer subtypes. Cancer Cell. 2006;10(6):515–527. doi: 10.1016/j.ccr.2006.10.008. [DOI] [PMC free article] [PubMed] [Google Scholar]
- 42.Findlay V.J., Turner D.P., Moussa O., Watson D.K. MicroRNA-mediated inhibition of prostate-derived Ets factor messenger RNA translation affects prostate-derived Ets factor regulatory networks in human breast cancer. Cancer Res. 2008;68(20):8499–8506. doi: 10.1158/0008-5472.CAN-08-0907. [DOI] [PMC free article] [PubMed] [Google Scholar]
- 43.Gu X., Zerbini L.F., Otu H.H., Bhasin M., Yang Q., Joseph M.G., Grall F., Onatunde T., Correa R.G., Libermann T.A. Reduced PDEF expression increases invasion and expression of mesenchymal genes in prostate cancer cells. Cancer Res. 2007;67(9):4219–4226. doi: 10.1158/0008-5472.CAN-06-3689. [DOI] [PubMed] [Google Scholar]
- 44.Galang C.K., Muller W.J., Foos G., Oshima R.G., Hauser C.A. Changes in the expression of many Ets family transcription factors and of potential target genes in normal mammary tissue and tumors. J Biol Chem. 2004;279(12):11281–11292. doi: 10.1074/jbc.M311887200. [DOI] [PubMed] [Google Scholar]
- 45.He J., Pan Y., Hu J., Albarracin C., Wu Y., Dai J.L. Profile of Ets gene expression in human breast carcinoma. Cancer Biol Ther. 2007;6(1):76–82. doi: 10.4161/cbt.6.1.3551. [DOI] [PubMed] [Google Scholar]
- 46.Sakurai T., Kondoh N., Arai M., Hamada J., Yamada T., Kihara-Negishi F., Izawa T., Ohno H., Yamamoto M., Oikawa T. Functional roles of Fli-1, a member of the Ets family of transcription factors, in human breast malignancy. Cancer Sci. 2007;98(11):1775–1784. doi: 10.1111/j.1349-7006.2007.00598.x. [DOI] [PubMed] [Google Scholar]
- 47.Tamir A., Howard J., Higgins R.R., Li Y.J., Berger L., Zacksenhaus E., Reis M., Ben-David Y. Fli-1, an Ets-related transcription factor, regulates erythropoietin-induced erythroid proliferation and differentiation: evidence for direct transcriptional repression of the Rb gene during differentiation. Mol Cell Biol. 1999;19(6):4452–4464. doi: 10.1128/mcb.19.6.4452. [DOI] [PMC free article] [PubMed] [Google Scholar]
- 48.Truong A.H., Cervi D., Lee J., Ben-David Y. Direct transcriptional regulation of MDM2 by Fli-1. Oncogene. 2005;24(6):962–969. doi: 10.1038/sj.onc.1208323. [DOI] [PubMed] [Google Scholar]
- 49.Asano Y., Bujor A.M., Trojanowska M. The impact of Fli1 deficiency on the pathogenesis of systemic sclerosis. J Dermatol Sci. 2010;59(3):153–162. doi: 10.1016/j.jdermsci.2010.06.008. [DOI] [PMC free article] [PubMed] [Google Scholar]
- 50.Gavrilov D., Kenzior O., Evans M., Calaluce R., Folk W.R. Expression of urokinase plasminogen activator and receptor in conjunction with the ets family and AP-1 complex transcription factors in high grade prostate cancers. Eur J Cancer. 2001;37(8):1033–1040. doi: 10.1016/s0959-8049(01)00077-6. [DOI] [PubMed] [Google Scholar]
- 51.Schaefer J.S., Sabherwal Y., Shi H.Y., Sriraman V., Richards J., Minella A., Turner D.P., Watson D.K., Zhang M. Transcriptional regulation of p21/CIP1 cell cycle inhibitor by PDEF controls cell proliferation and mammary tumor progression. J Biol Chem. 2010;285(15):11258–11269. doi: 10.1074/jbc.M109.073932. [DOI] [PMC free article] [PubMed] [Google Scholar]
- 52.Clark D.W., Mitra A., Fillmore R.A., Jiang W.G., Samant R.S., Fodstad O., Shevde L.A. NUPR1 interacts with p53, transcriptionally regulates p21 and rescues breast epithelial cells from doxorubicin-induced genotoxic stress. Curr Cancer Drug Targets. 2008;8(5):421–430. doi: 10.2174/156800908785133196. [DOI] [PubMed] [Google Scholar]
- 53.Hill R., Bodzak E., Blough M.D., Lee P.W. p53 Binding to the p21 promoter is dependent on the nature of DNA damage. Cell Cycle. 2008;7(16):2535–2543. doi: 10.4161/cc.7.16.6440. [DOI] [PubMed] [Google Scholar]
Associated Data
This section collects any data citations, data availability statements, or supplementary materials included in this article.
Supplementary Materials
PCR Primers and Probes for Real Time PCR.
Sequences of Lentiviral shRNA Against FLI1.
Pathway Guide Table.
PDEF log2f.
FLI1 log2f.
FLI1 Expression in Breast Cancer Cell Lines by Subtype.