

Abstract
Selumetinib (AZD6244, ARRY-142886) is a MEK1/2 inhibitor that has gained interest as an anti-tumour agent. We have determined the degree of sensitivity/resistance to Selumetinib in a panel of colorectal cancer cell lines using cell proliferation and soft agar assays. Sensitive cell lines underwent G1 arrest, whereas Selumetinib had no effect on the cell cycle of resistant cells. Some of the resistant cell lines showed high levels of ERK1/2 phosphorylation in the absence of serum. Selumetinib inhibited phosphorylation of ERK1/2 and RSK and had no effect on AKT phosphorylation in both sensitive and resistant cells. Furthermore, mutations in KRAS, BRAF, or PIK3CA were not clearly associated with Selumetinib resistance. Surprisingly, Selumetinib was able to inhibit phosphorylation of p70 S6 kinase (p70S6K) and its downstream target ribosomal protein S6 (RPS6) in sensitive cell lines. However, p70S6K and RPS6 phosphorylation remained unaffected or even increased in resistant cells. Moreover, in some of the resistant cell lines p70S6K and RPS6 were phosphorylated in the absence of serum. Interestingly, colorectal primary cultures derived from tumours excised to patients exhibited the same behaviour than established cell lines. Pharmacological inhibition of p70S6K using the PI3K/mTOR inhibitor NVP-BEZ235, the specific mTOR inhibitor Rapamycin and the specific p70S6K inhibitor PF-4708671 potentiated Selumetinib effects in resistant cells. In addition, biological inhibition of p70S6K using siRNA rendered responsiveness to Selumetinib in resistant cell lines. Furthermore, combination of p70S6K silencing and PF-47086714 was even more effective. We can conclude that p70S6K and its downstream target RPS6 are potential biomarkers of resistance to Selumetinib in colorectal cancer.
Abbreviations: MEK, mitogen-activated protein kinase; ERK, extracellular signal-regulated kinase; p70S6K, p70 S6 kinase; RPS6, ribosomal protein S6; RSK, p90 ribosomal S6 kinase; CRC, colorectal cancer
Introduction
The incidence and mortality rate of colorectal cancer (CRC) have continued to decline, largely owing to improved screening efforts that lead to early detection and removal of precancerous polyps and improvements in anticancer treatment. Despite current therapies, approximately 40% to 50% of patients with CRC who undergo potentially curative surgery ultimately relapse and die of metastatic disease [1]. In addition, approximately 20% of patients with CRC present metastases (stage IV) at diagnosis, for which palliative systemic therapy is the primary treatment modality [2].
The RAF/MEK/ERK pathway has attracted much attention in the search for new chemotherapeutic agents, due to both the high frequency of KRAS (40%) and BRAF (10%) mutations identified in colon tumours [3], [4], [5] and the essential role of this pathway in promoting cell proliferation and survival [6]. Moreover, constitutive activation of ERK1/2 is frequently, though not invariably, observed in CRC cell lines and primary human tumours derived from colon [7].
MEK1/2 is a central component within the RAF/MEK/ERK pathway. This kinase harbours a unique inhibitor-binding pocket next to its ATP binding site that allows for its highly specific inhibition by small molecules. The binding of an inhibitor to this site is proposed to lock MEK1/2 into an inactive conformation that permits binding of ATP and its known substrate, ERK1/2, but alters the molecular interaction required for catalysis and the access to the ERK activation loop [8]. Moreover, because the only known target substrate for MEK1/2 is ERK1/2, and because MEK1/2 is the exclusive known substrate for B-RAF [9], MEK1/2 represents an attractive target for chemotherapy. On the contrary, C-RAF (RAF-1) has effects on a broader range of downstream targets, modulating apoptosis, cell cycle entry, and angiogenesis. In this way, C-RAF has evolved into a less efficient MEK kinase, dedicated to the cross talk and modulation of parallel pathways [10].
Selumetinib (AZD6244, ARRY-142886) is an oral, highly specific, allosteric inhibitor of MEK1/2 that is currently undergoing clinical trials [11], [12]. It inhibits MEK1 in vitro with an IC50 of 14 nM [13] and has shown to exert anti-proliferative and pro-apoptotic effects in various tumour cell lines grown in culture or as xenografts [14]. Binding of Selumetinib to the inhibitor binding pocket of MEK1/2 prevents downstream phosphorylation of ERK1/2 and, thus, inhibits the RAF/MEK/ERK signalling pathway.
In recent years, there have been great efforts in trying to identify predictive biomarkers of response to MEK 1/2, including Selumetinib. To date, studies comprising the identification of molecular biomarkers to MEK inhibitors treatment remain controversial and despite intensive studies, the genetic and molecular basis for Selumetinib resistance remains poorly understood. The main objective of this work was to determine novel molecular markers of response to Selumetinib treatment in CRC cell lines and primary cell cultures derived from tumours excised to patients. With this aim, we analyzed sensitivity to Selumetinib in a panel of CRC cell lines and classified cell lines as sensitive or resistant according to their IC50 value. In this work, we found that resistance, in most cases, was associated with high basal levels of phosphorylated p70S6K and RPS6. Furthermore, treatment of resistant cell lines and primary cultures with Selumetinib did not alter phosphorylation levels of these proteins. We further show that p70S6K and RPS6 pharmacological or biological inhibition was able to sensitize resistant cell lines to Selumetinib. Together, these findings provide a strong rationale for combination therapies of Selumetinib with p70S6K and RPS6 inhibitors to tackle resistance in tumours exhibiting high endogenous levels of activated p70S6K and RPS6, or in tumours that respond to Selumetinib by increasing p70S6K and RPS6 activity.
Materials and Methods
Reagents
Selumetinib and NVP-BEZ235 were obtained from ChemieTek (Indianapolis, IN). PF-4708671 was purchased from Tocris Bioscience (Bristol, UK). Propidium iodide, 3-(4,5-dimethylthiazol-2-yl)-2,5-diphenyltetrazolium bromide (MTT), iodonitrotetrazoluim violet, and Rapamycin were purchased from Sigma-Aldrich (St. Louis, MO).
Cell Culture
Human colorectal cancer cell lines were obtained from the American Type Culture Collection (Manassas, VA), except for HGUE-C-1 cells which were derived from ascites of a patient with CRC at the Hospital General Universitario de Elche, according to human ethic guidelines from the institution (Grasso S, et al., 2013, under revision). All cell lines were maintained in DMEM and supplemented with 10% heat-inactivated fetal bovine serum (FBS), 2 mM glutamine, 1 mM sodium pyruvate, 10 mM HEPES, 50 U/ml of penicillin, and 50 mg/ml streptomycin, and incubated at 37°C in a humidified 5% CO2/air atmosphere. Primary cell culture samples were obtained from colorectal tumours excised to patients at the Hospital Clínico Universitario Virgen de la Arrixaca (Murcia, Spain) with signed written informed consent, according to institutional human ethical guidelines. Surgical samples were digested with 1.5 U/ml dispase, 0.09 mg/ml collagenase II, 0.1 mg/ml pronase E, and 45 U/ml hyaluronidase and incubated at 37°C for 30 minutes. Fragments were incubated with RBC lysis solution (GeneAll Biotechnology, Seoul, Korea) for 10 minutes to eliminate erythrocytes, washed with PBS, filtered through a 70 μm mesh, washed with PBS, and harvested in DMEM-F12 containing 20% heat-inactivated FBS, 2 mM glutamine, 10 μg/ml insulin, 5.5 μg/ml transferrin, 6.7 ng/ml selenium, 0.5 μg/mL hydrocortisone, 20 ng/ml epidermal growth factor, 1 mM sodium pyruvate, 10 mM HEPES, 50 U/ml penicillin, 50 mg/ml streptomycin, 2.5 μg/mL amphotericin B, and 50 μg/ml gentamicine.
MTT Assay
Cells were treated with Selumetinib or DMSO for 72 hours and incubated with 5 mg/ml MTT at 37°C for 3 hours. The formazan crystals formed were solubilized with DMSO and absorbance was measured at 570 nm using a microplate reader (Anthos 2001, Wals, Austria).
Colony Formation Assay in Soft Agar
Cells were suspended in 0.36% agar containing appropriate medium and either Selumetinib or DMSO over a 0.6% solidified agar base layer. After 14 days of incubation, cells were stained with iodonitrotetrazoluim violet and colonies larger than 100 μm were counted with an image scanner (Image Scanner III) and the Image Quant TL software (GE Healthcare).
Mutational Analysis
DNA was extracted from cells using the QIAamp DNA minikit and the QiaCube automatic nucleic acid extractor (Qiagen, Hilden, Germany). DNA sequence fragments containing the BRAFV600E mutation were amplified and injected into a preheated reverse-phase column (Helix DVB; Varian Analytical Instruments, Walnut Creek, CA) in a Helix ProStar denaturing high-performance liquid chromatography (dHPLC) instrument (Varian Analytical Instruments) [15]. KRAS mutations at codons 12 and 13 were also determined by dHPLC after amplification of the corresponding DNA fragments [16]. Presence of PIK3CA mutations in exons 9 and 20 were determined by direct sequencing after a nested PCR reaction. Amplicons were purified using the QiAquick 96 PCR purification kit (Qiagen) and subjected to direct sequencing using the primers PI542-5IF and PI542-5IR for exon 9 and PI1047IF and PI1047IR for exon 20. Analysis was performed using a four-capillary automated sequencer (ABI Prism 3130 Genetic Analyzer; Applied Biosystems, Foster City, CA) [16].
Cell Cycle Analysis
Cells were collected and fixed with chilled 70% ethanol in PBS at − 20°C for at least 30 minutes. Following fixation, cells were resuspended in PBS containing 0.5% Triton X-100, 25 μg/mL RNase A, and 25×10− 3 μg/mL propidium iodide and analysed using a flow cytometer (BD FACSCanto™, Becton Dickinson & Co., Franklin Lakes, NJ).
Western Blot Analysis
Cells were lysed in a lysis buffer (50 mM Tris pH 7.4, 1% NP40, 150 mM NaCl, 40 mM NaF, 1 mM Na3VO4, 1 mM PMSF), and 10 μg/ml of protease inhibitor cocktail (Sigma-Aldrich) for 30 minutes on ice. Protein concentration was determined by the Bradford method (Bio-Rad, Richmond, CA). Total protein content was fractioned by SDS-PAGE and transferred onto nitrocellulose membranes, which were subsequently blocked with 5% nonfat dry milk for 1 hour. Membranes were then incubated overnight with the indicated primary antibodies. Hsp90 antibody was purchased from Santa Cruz Biotechnology (Santa Cruz, CA); phospho ERK1/2, ERK1/2 (Thr202/Tyr204), phospho AKT (Ser473), AKT, phospho p70S6K (Thr389), p70S6K, phospho RPS6 (Ser235/Ser236), RPS6, phospho RSK (Ser380), RSK, phospho mTOR (Ser2481), and mTOR antibodies were purchased from Cell Signaling Technologies (Beverly, MA); β-actin was purchased from Sigma-Aldrich. Membranes were incubated with horseradish peroxidase-linked secondary antibodies (GE Healthcare, Buckinghamshire, UK). Protein bands were detected using the ECL system (GE Healthcare). Densitometric analyses were performed using Scion Image software.
p70S6K Gene Expression Silencing
A smart pool siRNA for p70S6K or control siRNA (Applied Biosystems, Carlsbad, CA) were transfected into cells using Opti-MEM I Reduced Serum medium (Gibco, Life Technologies Corporation, Carlsbad, CA) and Lipofectamine RNAiMAX (Invitrogen Technologies Corporation), according to the manufacturer's instructions. After 48 hours of transfection, cells were treated with DMSO or Selumetinib and harvested for subsequent experiments.
Real-Time Quantitative RT-PCR
Total RNA from cells was isolated using the TRI reagent (Sigma-Aldrich) and reverse transcription was performed using the TaqMan Reverse Transcription Reagents kit (Applied Biosystems). To eliminate potential DNA contamination, total RNA was treated with RQ1 DNase (Promega Corp., Madison, WI) for 30 minutes at 37°C, followed by 2 minutes at 94°C. Real-time quantitative PCR was performed to amplify 15 ng of cDNA using the ABI PRISM 7700 Sequence Detector System (Applied Biosystems). Taqman probes were labeled with 6-FAM in 5′ end as the reporter dye, and with a non fluorescent quencher dye in 3′ end. Glyceraldehyde-3-phosphate-dehydrogenase (GAPDH) was used as endogenous reference in multiplex PCR. S6KBP1 mRNA relative gene expression in CRC cell lines was calculated by the comparative Ct method referred to the GAPDH mRNA housekeeping gene expression.
Statistical Analysis
The experiments were performed with n ≥ 3 and the data is presented as mean ± standard error of the mean (SEM). Statistically significant differences were estimated from P < .05 and evaluated using the Student t test. Statistical analyses were conducted using GraphPad Prism version 5 (GraphPad Software Inc., San Diego, CA). The E-bliss model [17], [18] was utilized to analyze the interaction between Selumetinib and PF-4708671. A theoretical curve (bliss) was calculated by using the following equation: E bliss = EA + EB – EA × EB, where EA and EB are the effects of drug A and drug B, respectively, expressed as the fractional inhibition between 0 and 1. E experimental (E exp) is the actual result obtained by combination of both drugs. When E bliss is equal to E exp, the combination is considered additive. If E bliss is more than E exp the combination is synergistic. On the other hand, if E bliss is less than E exp, the combination is antagonistic.
Results
Effects of Selumetinib on Cell Proliferation and Colony Formation
We first analyzed the antiproliferative effect of Selumetinib on a panel of CRC cell lines by proliferation assays, under anchorage-dependent growth conditions. On the basis of their varied response (Figure 1A), we ranked them in sensitive (IC50 ≤ 1 μM) and resistant (IC50 > 1 μM) cell lines (Table 1). SW620, SW480, HT-29, and LS 174 T cells were sensitive to Selumetinib, whereas HGUE-C-1, Caco-2, HCT-15, and DLD-1 were highly resistant. The IC50 of normal non-tumour fibroblasts for Selumetinib is > 10 μM (data not shown). Due to some concerns published with techniques that employ formazan salts such as MTT [19], we routinely perform crystal violet assays in addition to MTT assays, and we have not found significant differences when using both assays under these conditions (data not shown). We next performed soft agar assays to monitor the anti-tumour activity of Selumetinib under anchorage-independent growth conditions (Figure 1B). There was a significant reduction in colony formation after Selumetinib treatment (1 μM) in the sensitive LS 174 T and HT-29 cell lines (98.1% and 98.8%, respectively), whereas in the resistant DLD-1 and HCT-15 cell lines we observed a minor reduction in colony number (26.8% and 20.8 %, respectively). These results are in accordance with the effect on anchorage-dependent cell growth (Figure 1A).
Figure 1.
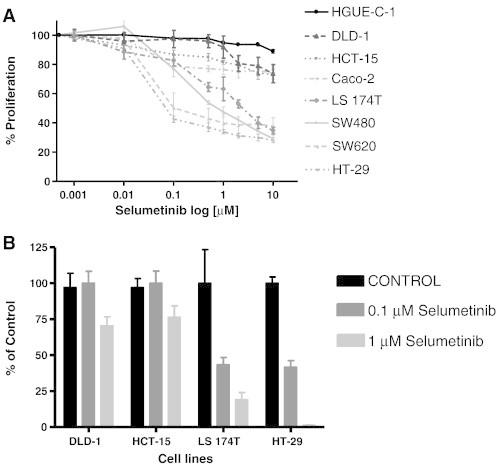
Effect of Selumetinib on proliferation and cell colony formation in colorectal cancer cell lines. (A) Cell proliferation assays. CRC cell lines were treated with increasing doses of Selumetinib for 72 hours. Cell proliferation was measured using the MTT method as described in Materials and Methods. Values represent the mean ± SEM of at least three independent assays performed in sextuplicate. (B) Soft agar assays. CRC cells were seeded over agar plates in the presence of DMSO (control), 0.1 μM, or 1 μM Selumetinib and the colonies formed were stained and counted after 14 days. Each treatment was performed in triplicate, represented as percentage of control and error bars are the S.E.M.
Table 1.
Effect of Selumetinib on Cell Proliferation.
| Selumetinib Effect on Cell Proliferation | ||
|---|---|---|
| Cell line | IC50 (μM) | % Inhibition (10 μM) |
| HT-29 | 0.033 | 71.97±1.68 |
| COLO 201 | 0.034 | 87.93±1.68 |
| SW620 | 0.121 | 62.35±5.96 |
| SW480 | 0.422 | 70.69±2.63 |
| HCT 116 | 0.437 | 58.35±6.59 |
| LS174T | 0.771 | 62.21±2.18 |
| LoVo | 7.357 | 52.18±4.91 |
| Caco-2 | > 1 | 26.16±3.85 |
| HCT-15 | > 1 | 26.87±3.21 |
| DLD-1 | > 1 | 26.37±6.23 |
| HGUE-C-1 | > 1 | 11.01±1.39 |
| COLO 320HSR | > 1 | 24.16±4.83 |
IC50 values and percentage of inhibition of cell proliferation in CRC cell lines. The table shows the IC50 values obtained for each cell line as well as the % inhibition of cell proliferation when the cells were treated with 10 μM Selumetinib. Cells were classified according to their IC50 value in Selumetinib-sensitive (IC50 ≤ 1 μM) and Selumetinib-resistant (IC50 > 1 μM). The percentage (%) of inhibition at 10 μM for each cell line represents the average of at least 3 experiments ± SEM. Each experiment was performed in sextuplicate (n = 6).
Effects of Selumetinib on Cell Cycle
To investigate whether the antiproliferative effects of Selumetinib were caused by cell cycle arrest or induction of cell death, we analyzed cell cycle profiles after treatment for several times (Figure 2, Supplementary Figure 1 and Supplementary Table 1). Selumetinib treatment of sensitive cell lines led to an arrest in the G1 phase of the cell cycle, which was sustained through 72 hours. Comparatively, when the resistant cell lines were treated with Selumetinib, no apparent arrest in any of the cell cycle phases was appreciated. Interestingly, the resistant HCT-15 cells exhibited a transient delay in the G1 phase at 24 hours, with a subsequent escape and progression into S and G2/M after 48 hours. There was no detectable cell death (SubG1 peak) except for the HT-29 cells, where Selumetinib treatment led to some limited cell death, which was maintained for 72 hours. Same results were obtained when we performed cell cycle analyses using 500 nM Selumetinib instead of 1 μM (data not shown).
Figure 2.
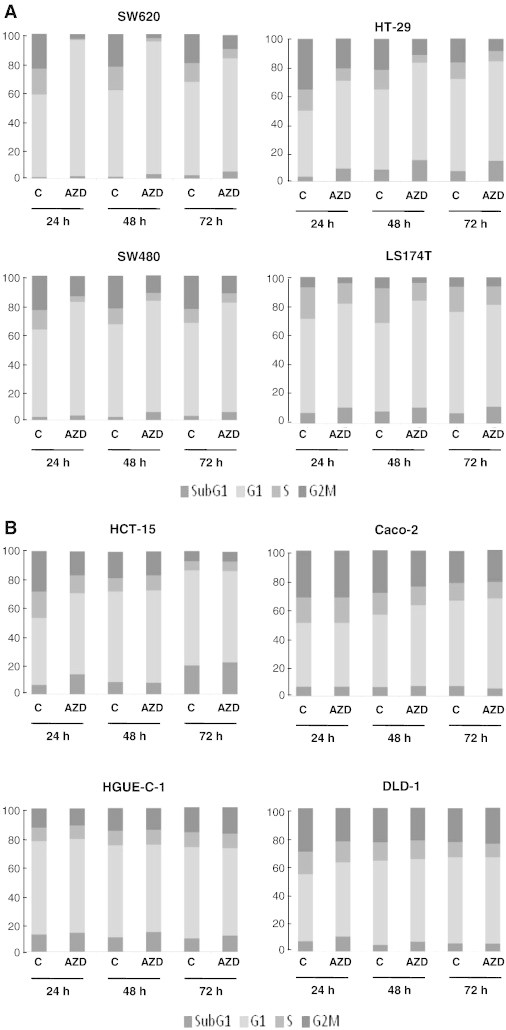
Effect of Selumetinib on cell cycle distribution. (A) Sensitive and (B) resistant CRC cell lines were treated with DMSO or 1 μM Selumetinib (AZD) for 24, 48, and 72 hours, and cell cycle distribution was determined by flow cytometry, as described in Materials and Methods, The percentage of cells in each phase of the cell cycle is represented as the average of at least three separate experiments.
Association Between Basal Levels of p-ERK1/2 or Inhibition of ERK1/2 With Sensitivity to Selumetinib
With the aim of identifying molecular markers of resistance to Selumetinib, we first determined whether there was a correspondence between basal phosphorylation levels of ERK1/2 after serum starvation and resistance. Cell lines with elevated ERK1/2 activity would be more dependent on the RAF/MEK/ERK pathway for growth and survival, and hence more sensitive to the MEK inhibitor Selumetinib. We found that ERK1/2 was highly phosphorylated in HGUE-C-1 and Caco-2 resistant cells, but not in HCT-15 and DLD-1 resistant cells (Figure 3, A and B), suggesting that the degree of basal activation of ERK1/2 is not a predictor of sensitivity to Selumetinib. We next assessed whether inhibition of MEK1/2 would be a reliable determinant to predict sensitivity. Therefore, we analyzed the phosphorylation levels of ERK1/2 after Selumetinib treatment (Figure 3C). Interestingly, the level of ERK phosphorylation was suppressed to the same degree in the resistant and sensitive cell lines after different time treatments.
Figure 3.
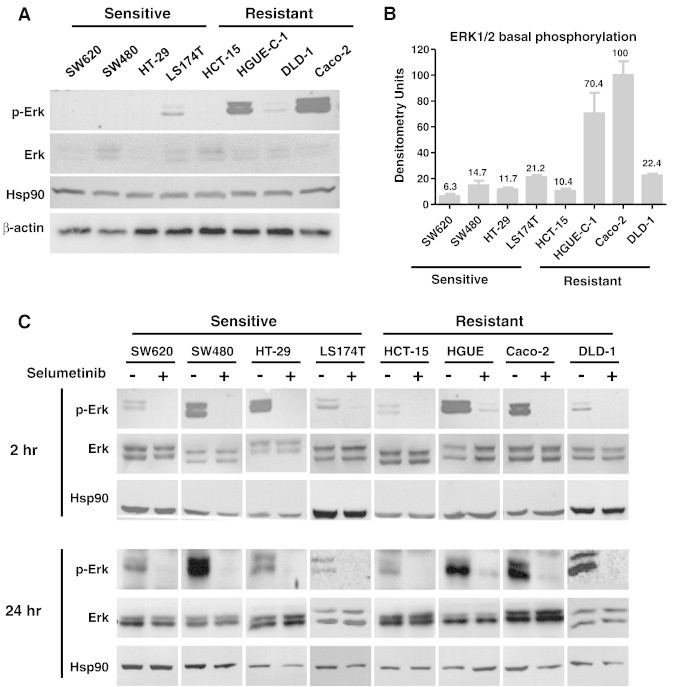
(A) Basal levels of p-ERK1/2 in sensitive and resistant cell lines. Cells were incubated with 0.1% FBS for 48 hours, lysed, and equal amounts of total cellular proteins were subjected to Western blot analysis with phospho-specific and total protein antibodies to ERK1/2. Representative blots of at least three independent experiments are shown. Expression of Hsp90 or β-actin was measured as an invariant control. No differences were found when using either Hsp90 or β-actin as the loading control (B) Densitometric analysis of ERK 1/2 basal phosphorylation. Protein bands corresponding to p-ERK and ERK were quantified and represented as the average of p-ERK/ERK ratio of three separate experiments. Error bars are the S.E.M. (C) Effect of Selumetinib on ERK1/2 phosphorylation. Sensitive and resistant CRC cell lines were grown, treated (+), or left untreated (−) with 500 nM Selumetinib for 2 and 24 hours. Cell extracts were obtained and analyzed by Western blot using p-ERK1/2 and ERK1/2 antibodies to determine ERK1/2 phosphorylation levels. Hsp90 is included as a loading control.
Association Between KRAS, BRAF, and PIK3CA Mutational Status and Selumetinib Sensitivity
To determine whether sensitivity correlates with specific genetic alterations, we analysed the mutational status of KRAS, BRAF, and PIK3CA genes in a panel of 12 CRC cell lines (Table 2). There is no evident association between the distribution of PI3KCA mutations and sensitivity to Selumetinib, as both sensitive and resistant cell lines harbour this mutation (Table 3). Also, the presence of KRAS mutations is most likely unrelated to the fate of the cells, as the sensitivity of the KRAS mutant cell lines to Selumetinib varies drastically; some of the KRAS-mutant cell lines respond to Selumetinib, whereas others do not (Table 3). In addition, there is not a clear association between BRAF mutational status and Selumetinib response, as the most sensitive cell lines (HT-29 and Colo-201) exhibit BRAF mutations. Only when we consider the presence of mutations in the three genes at the same time, a significant association between these mutations and sensitivity to Selumetinib can be found (Table 3). However, the series used in this study is too small to draw definite conclusions.
Table 2.
Mutational Status of KRAS, BRAF, and PIK3CA Genes in Colorectal Cancer Cell Lines.
| Mutational Status | |||
|---|---|---|---|
| Cell line | KRAS (exon 1) | BRAF (exon 15) | PIK3CA (exon 9 and 20) |
| HT-29 | WT | V600E | P449T |
| COLO 201 | WT | V600E | WT |
| SW620 | G12V | WT | WT |
| SW480 | G12V | WT | WT |
| HCT 116 | G13D | WT | H1047R |
| LS174T | G12D | WT | H1047R |
| LoVo | G13D | WT | WT |
| CaCo-2 | WT | WT | WT |
| HCT-15 | G13D | WT | E545K/D549N |
| DLD-1 | G13D | WT | E545K/D549N |
| HGUE-C-1 | WT | WT | WT |
| COLO 320HSR | WT | WT | WT |
DNA from CRC cell lines was extracted and fragments were amplified by PCR. Presence of KRAS mutations in exon 1, BRAF mutations in exon 15, and PIK3CA mutations in exons 9 and 20 were determined by dHPLC or direct sequencing of amplified DNA fragments, as described in Materials and Methods.
Table 3.
Associations Between Presence of KRAS, BRAF, and PIK3CA Mutations and Sensitivity/Resistance to Selumetinib.
| Mutations | Total N° (%) |
Selumetinib (cut off IC50= 1 μM) |
||
|---|---|---|---|---|
| Sensitive N° (%) |
Resistant N° (%) |
P value | ||
| BRAF mut | 2 (16.67 %) | 2 (16.67%) | 0 (0%) | |
| BRAF WT | 10 (83.34%) | 5 (41.67%) | 5 (41.67%) | 0.4697* |
| KRAS mut | 7 (58.33%) | 5 (41.67) | 2 (16.67%) | |
| KRAS WT | 5 (41.67%) | 2 (16.67%) | 3 (25%) | 0.5581* |
| PIK3CA mut | 5 (41.67%) | 3 (25%) | 2 (16.67%) | |
| PIK3CA WT | 7 (58.34%) | 4 (33.34%) | 3 (25%) | 1* |
| 3 mut | 9 (75%) | 7 (58.34%) | 2 (16.67%) | |
| 3 WT | 3 (25%) | 0 (0%) | 3 (25%) | 0.0455* |
Univariate analysis of associations between presence of mutations and sensitivity/resistance to Selumetinib was performed using the Fisher's exact test. Number of cases (cell lines) and percentage (in parenthesis) is shown. The P values are indicated (P < .05 was significant).
Effect of Selumetinib on RSK, AKT, S6K, and RPS6 Phosphorylation
As p90RSK is a downstream ERK target and has been reported as a potential link between the RAS/RAF/MEK/ERK and the PI3K/AKT/mTOR/S6K pathways [20], [21], we sought to determine the effect of Selumetinib in RSK phosphorylation and found that RSK phosphorylation levels decreased in both sensitive and resistant cell lines after Selumetinib treatment (Figure 4A). Instead, AKT phosphorylation was not altered in most cell lines except for HCT-15 and HGUE-C-1 cells, where it appears to be a slight increase in phosphorylation at 2 hours that was not maintained after 24 hours of treatment (data not shown). However, Selumetinib had an obvious impact on the phosphorylation of S6K (p70 and p85 isoforms) and RPS6 in the sensitive but not in Selumetinib-resistant cells (Figure 4A–C) that was sustained even after 24 hours of treatment (Figure 4, D–F), whereas no changes were observed in resistant cells. Curiously, in the resistant HCT-15 cells, an increase in phosphorylation was observed. The sensitive cell line LS 174 T, however, showed an intermediate type of response, as Selumetinib treatment caused a decrease in RPS6 phosphorylation levels but not in S6K phosphorylation. This may be because these cells have an IC50 close to 1 μM (0.771 μM), the cut-off point for considering a cell line as resistant or sensitive (Table 1).
Figure 4.
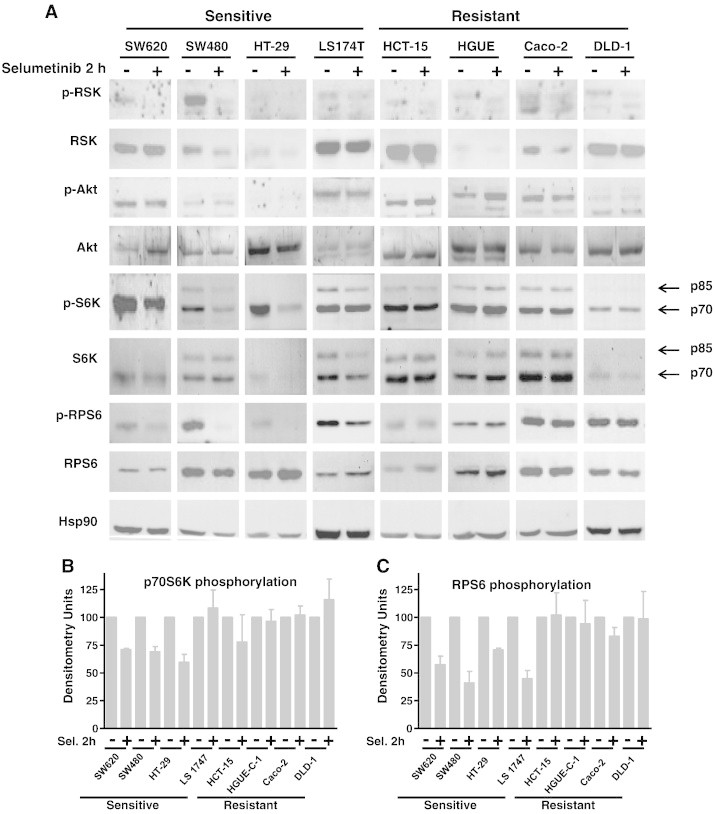
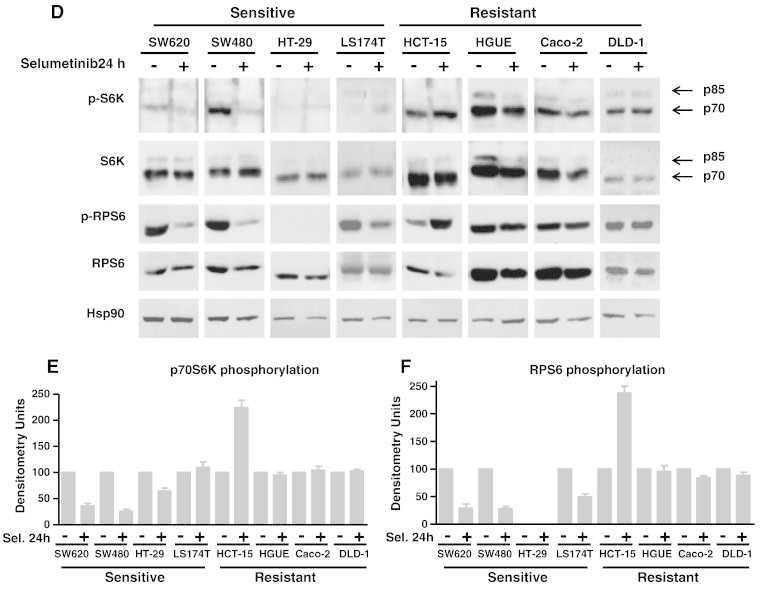
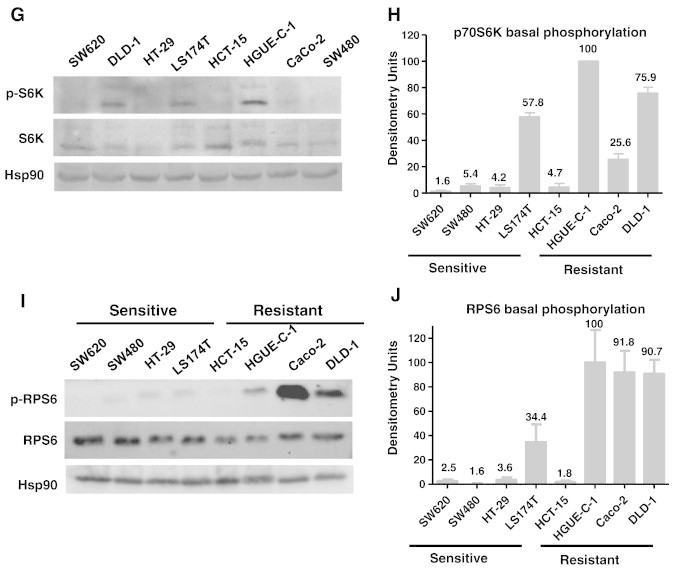
Effect of Selumetinib on RSK, AKT, p70S6K, and RPS6 phosphorylation. Sensitive and resistant CRC cell lines were treated (+) or left untreated (−) with 500 nM Selumetinib for 2 hours (A) and 24 hours (D). Cell extracts were obtained and analyzed by Western blot using the appropriate antibodies to determine phosphorylation levels. Hsp90 was measured as an internal control. Densitometric analysis of the p-S6K/S6K (B and E) and p-RPS6/RPS6 (C and F) ratio is represented as the average of three different experiments. Error bars are the S.E.M. Basal phosphorylation levels of p70S6K (G) and RPS6 (I) in sensitive and resistant cell lines. Equal amounts of total cellular protein from serum-starved cells (0.1% FBS for 48 hours) were separated by electrophoresis and subjected to Western blot analysis with phospho-specific and total protein antibodies to p70S6K and RPS6. Representative blots of at least three independent experiments are shown. Expression of Hsp90 was measured as an internal control. Densitometric analysis of the p-S6K/S6K (H) and p-RPS6/RPS6 (J) ratio is represented as the average of three different experiments. Error bars are the S.E.M.
HGUE-C-1, Caco-2, and DLD-1 Resistant Cells Exhibit High Basal Levels of Phosphorylated p70S6K and RPS6
To explore whether resistant cells exhibit high constitutive activity of p70S6K and/or RPS6, we analysed the basal phosphorylation status of p70S6K and RPS6 after serum starvation (Figure 4, G–J). Interestingly, HGUE-C-1, Caco-2, and DLD-1 resistant cell lines expressed high levels of endogenous phosphorylated p70S6K and RPS6, indicating high constitutive activation of these proteins. In Caco-2 cells, the p70S6K endogenous phosphorylation was only moderate. In contrast, in the sensitive cell lines the phosphorylation status of p70S6K and RPS6 was barely detectable, except for LS 174 T cells, which as indicated earlier, show a “mixed” or intermediate response. Altogether, these results suggest that Selumetinib resistance is associated with phosphorylation and hence, endogenous activation of p70S6K and RPS6 in HGUE-C-1, Caco-2, and DLD-1 cells. Interestingly, the phosphorylated p70S6K and RPS6 levels in serum-starved HCT-15 cells were minimal and comparable to those found in sensitive cells.
Effect of Selumetinib in Primary Cultures from Colorectal Tumours
Similar studies were performed in primary cultures derived from patients with CRC. Some of these primary cultures were sensitive to Selumetinib (HCUVA-CC-34) and others were resistant (HCUVA-CC-58), as measured under anchorage-dependent and independent growth conditions (Figure 5, A and B). As shown in Figure 5C, in the Selumetinib-resistant cells, no alteration was observed in phosphorylation levels of p70S6K and RPS6 after Selumetinib treatment. In contrast, when the sensitive cells were incubated with Selumetinib, a marked decrease in phosphorylation levels of these proteins was observed, confirming a strong association of lack of inhibition of p70S6K and RPS6 and resistance in primary cell cultures. Also, as it was shown with established cell lines, we were not able to find an association between the mutational status of KRAS, BRAF or PI3KCA genes, and resistance to Selumetinib in these primary cell cultures (Figure 5D). Since some primary cultures were not as sensitive as established cell lines to Selumetinib, we had to use higher concentrations, but always within the same range, being 10 μM the highest concentration used.
Figure 5.
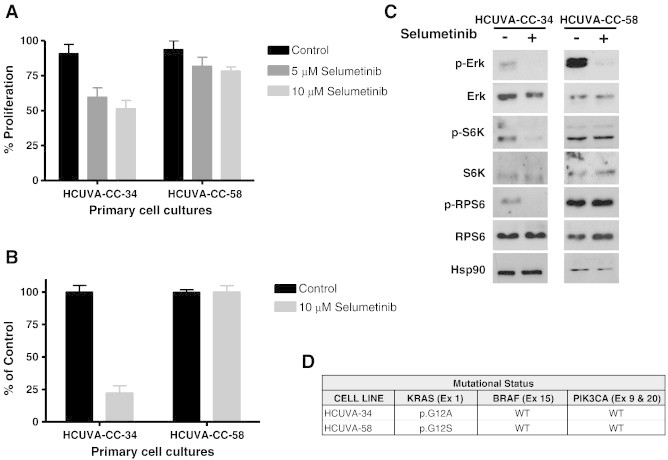
Effect of Selumetinib and mutational status of primary cell culture samples obtained from colorectal tumours. (A) Anchorage-dependent growth. HCUVA-CC-34 and HCUVA-CC-58 primary cultures were treated with DMSO, 5 μM or 10 μM Selumetinib and cell proliferation assays were performed as described in Materials and Methods (B) Anchorage-independent growth. Primary cell cultures were seeded over agar plates with DMSO (control) or 10 μM Selumetinib and after 14 days the number of colonies was counted. Each treatment was performed in triplicate, represented as percentage of control and error bars are the S.E.M. (C) Effect of Selumetinib on ERK, S6K, and RPS6 phosphorylation. Primary cell cultures were treated with Selumetinib for 24 hours and cell extracts were analysed by Western blot with the indicated antibodies (D) Mutational status of KRAS, BRAF, and PIK3CA in HCUVA-CC-58 and HCUVA-CC-34 primary cell cultures. Presence of KRAS mutations in exon 1, BRAF mutations in exon 15, and PIK3CA mutations in exons 9 and 20 was determined as described in Materials and Methods.
p70S6K and RPS6 Phosphorylation Inhibition Reverses Selumetinib Resistance
Selumetinib was combined with agents that inhibit p70S6K and RPS6 in order to investigate whether this combination could potentially overcome resistance to Selumetinib. NVP-BEZ235, a dual PI3K and mTOR inhibitor that indirectly inhibits p70S6K and RPS6 [22], [23], [24], suppressed both p70S6K and RPS6 phosphorylation in HGUE-C-1 and DLD-1 resistant cells (Figure 6A and Supplementary Figure 2). However, as expected, NVP-BEZ235 had no effect on ERK phosphorylation (Figure 6A). Cell proliferation assays (Figure 6B) and cell cycle analyses (Figure 6, C and D) revealed that HGUE-C-1 and DLD-1 cells were resistant to Selumetinib when this drug was used as a single agent. Nonetheless, when Selumetinib was combined with NVP-BEZ235, cells became sensitised to Selumetinib. It is noteworthy that although NVP-BEZ235 alone showed some effect on HGUE-C-1 and DLD-1 cell growth, the combinatory effect was significantly greater compared with the sum of the effects of each drug used alone.
Figure 6.
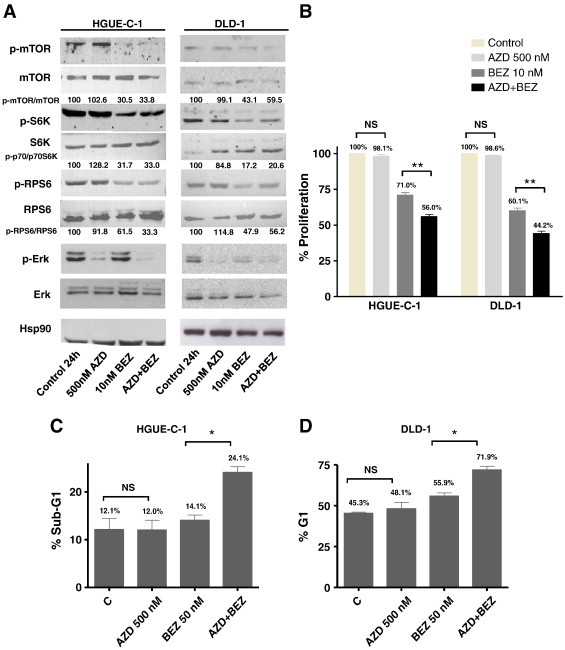
Effect of Selumetinib (AZD) and NVP-BEZ235 (BEZ) on HGUE-C-1 and DLD-1 resistant cell lines. (A) Effect on mTOR, S6K, RPS6, and ERK phosphorylation levels. Cells were treated with DMSO, AZD (500 nM), BEZ (10 nM), or a combination of both for 24 hours and cell extracts were analysed by Western blot using the appropriate antibodies. Densitometric analysis of the p-mTOR/mTOR, p-S6K/S6K, and p-RPS6/RPS6 ratios are indicated. (B) Effect on cell proliferation. Cells were treated as in (A) for 72 hours. Then, cell proliferation was measured using the MTT method as described in Materials and Methods. Values represent mean +/− SEM of at least three independent assays. Difference between means was non-significant (N.S.), or statistically significant **(P < .01), Student t test. (C), (D) Effect on cell cycle. Cell lines were treated with DMSO, AZD (500 nM), BEZ (50nM), or a combination of both for 24 hours and cell cycle was analysed by flow cytometry. SubG1 phase of HGUE-C-1 cells is represented in (C) and G1 phase of DLD-1 cells is represented in (D). Difference between means was non-significant (N.S.), or statistically significant *(P < .05), Student t test.
Then, we performed cell proliferation assays using Rapamycin, a specific mTOR inhibitor and found similar results (Supplementary Figure 3). In fact, we have confirmed that Rapamycin was also able to resensitise resistant cells to Selumetinib.
We next performed the same type of study using the specific p70S6K inhibitor PF-4708671, which has shown to prevent the p70S6K-mediated phosphorylation of RPS6 [25]. First, we performed cell proliferation assays in the presence of 500 nM Selumetinib and different concentrations of PF-4708671(10, 20, and 30 μM) in resistant cell lines and found that PF-4708671 was able to sensitise cells to Selumetinib at the three concentrations utilized (Supplementary Figure 4). Then, we determined the effect of a fixed concentration of PF-4708671 (30 μM) with different concentrations of Selumetinib, using the E-bliss model, which predicts whether the interaction between two compounds can be synergistic, antagonistic, or additive. In this case, the interaction of PF-4708671 with Selumetinib is synergistic (E bliss > E exp), especially at 1, 5, and 10 μM Selumetinib (Supplementary Figure 5). Furthermore, cell cycle analyses with 30 μM PF-470867 and different concentrations of Selumetinib (1, 5, and 10 μM) for 24 hours revealed that PF-470867 could resensitise resistant cells to Selumetinib, as the percentage of cells in the SubG1 cells significantly increased when both drugs were combined. Western blot experiments showed that PF-4708671 suppressed the phosphorylation of RPS6 in all cell lines tested, but it had no effect on ERK phosphorylation, even at the highest concentration used (Figure 7A). The increase in S6K phosphorylation observed after PF-470867 treatment, however, has been described as a result of inhibiting a negative feedback loop mechanism [24]. As it is depicted in Figure 7B, the combination of 30 μM PF-4708671 with Selumetinib resensitized resistant cell lines, as an increase in the SubG1 phase of the cell cycle was observed when cells were treated with both drugs. However, in the sensitive SW480 cells, the potentiation of the Selumetinib effect with PF-4708671 was not as remarkable.
Figure 7.
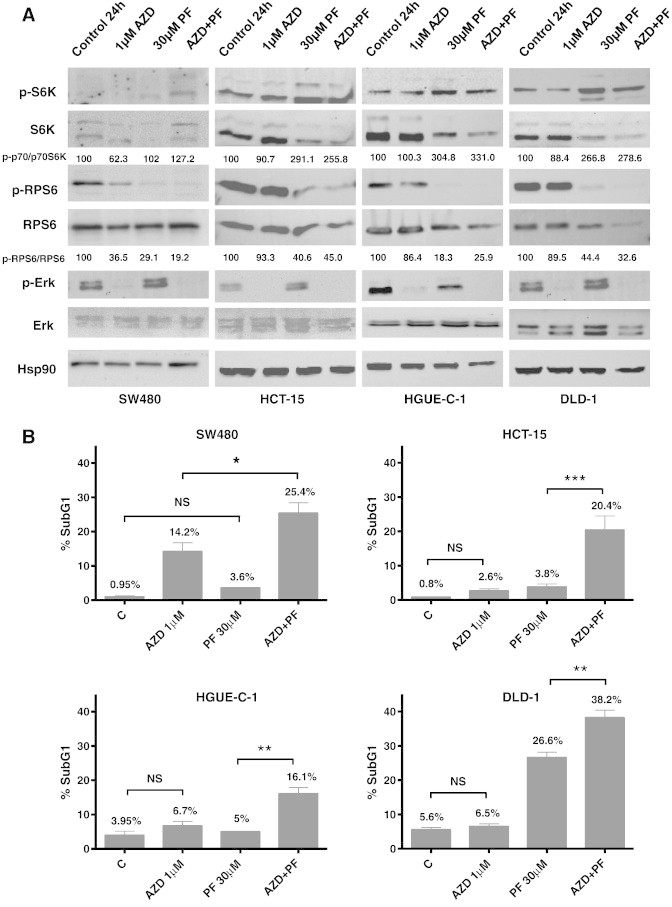
Effect of Selumetinib (AZD) and PF-4708671 (PF) on sensitive and resistant cell lines. (A) Effect on S6K, RPS6, and ERK phosphorylation levels. Cells were treated with DMSO, AZD (1 μM), PF (30 μM), or both for 24 hours and whole cell extracts were analysed by Western blot using the antibodies indicated. Densitometric analysis of the p-S6K/S6K and p-RPS6/RPS6 ratios are indicated (B) Effect on cell cycle. Cells were plated and treated with DMSO, AZD (1 μM), PF (30 μM), or a combination of both (AZD + PF) for 24 hours and cell cycle was analysed by flow cytometry. SubG1 phase is represented. Difference between means was non-significant (N.S.), or statistically significant *(P < .05), **(P < .01), ***(P < .001), Student t test.
Biological Inhibition of S6K Reverses Selumetinib Resistance
Finally, we wanted to determine whether S6K silencing would render sensitivity to Selumetinib-resistant cells. Cells were transiently transfected with a specific siRNA for RPS6KB1 (S6K). S6K knocking down was monitored by measuring S6K mRNA levels (Figure 8A) and protein levels (Figure 8B) after transfection. We can observe that as a result of S6K silencing, S6K mRNA and protein levels decreased and subsequently, phosphorylated RPS6 levels diminished as well. Interestingly, S6K down-regulation sensitized HCT-15 and HGUE-C-1 cells to Selumetinib, as shown in cell proliferation assays (Figure 8C), where the effect was moderate and in cell cycle analyses, where the effect was more evident (Figure 8, D and E). This effect was heightened when S6K silencing was combined with PF-4708671 treatment, as the percentage of cells in the SubG1 phase of the cell cycle significantly increased (Figure 8, D and E). We have used 30 μM PF-4708671 in these experiments since we have previously shown (Supplementary Figures 5 and 6) that we achieved the best results using this concentration.
Figure 8.
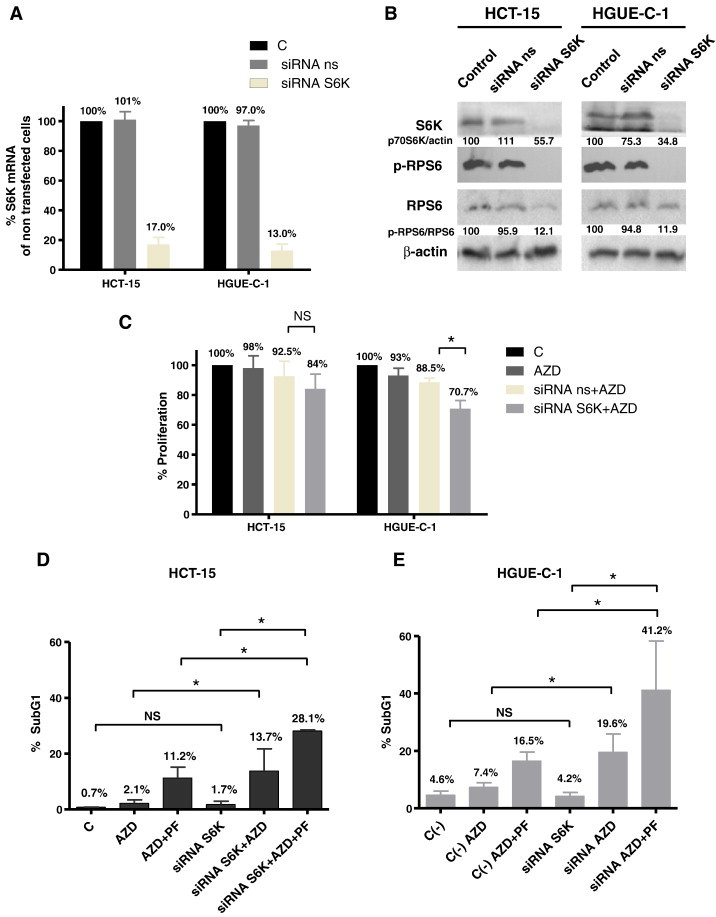
p70S6K silencing by siRNA in CRC lines. (A) Effects of gene silencing measured by RT-PCR. HGUE-C-1 and HCT-15 resistant cells were non transfected (Control), transfected with a non-specific siRNA (ns siRNA) or siRNA targeted against RPS6KB1 (S6K), mRNA was extracted and S6K mRNA levels were determined by RT-PCR, as described in Materials and Methods. (B) Effects of gene silencing measured by Western blot. HGUE-C-1 and HCT-15 resistant cells were non transfected (Control), transfected with ns siRNA or S6K siRNA and whole cell extracts were analysed by Western blot using the antibodies indicated. Densitometric analysis of the S6K/β-actin and p-RPS6/RPS6 ratios are indicated. (C) Effect on cell proliferation. HGUE-C-1 and HCT-15 cells were nontransfected, transfected with ns siRNA or S6K siRNA. After transfection, cells were treated with DMSO or 1 μM Selumetinib (AZD) and cell proliferation assays were performed, as described in Materials and Methods. Difference between means was non-significant (N.S.), or statistically significant *(P < .05), Student t test. (D, E) Effect on cell cycle. HCT-15 (D) and HGUE-C-1 cells (E) were transfected with non-specific siRNA (C-) or with S6K siRNA. After transfection, cells were treated with DMSO, 1 μM Selumetinib (AZD) or a combination of 1 μM Selumetinib and 30 μM PF-4708671 (AZD + PF) for 24 hours. Cell cycle analyses were performed by flow cytometry. SubG1 phase is represented. Difference between means was non-significant (N.S.), or statistically significant *(P < .05), Student t test.
Discussion
Identification of predictive biomarkers is becoming a pivotal aspect in the development of targeted therapies. So far, a large number of studies have addressed the issue of sensitivity to MEK inhibitors, including Selumetinib. However, the molecular and genetic basis for resistance is not well defined. Recent clinical trials in individuals with low-grade serous carcinoma of the ovary or metastasic melanoma have shown that some patients responded efficiently to Selumetinib, whereas tumours of other patients were inherently resistant [26], [27]. Therefore, it is important to identify the underlying mechanisms responsible for resistance to MEK inhibition to facilitate individualized therapy. Also, the understanding of the factors that predict and regulate sensitivity to Selumetinib would enhance its future clinical use and its progression into later-stage clinical trials.
In this report we have ranked a panel of CRC cell lines in sensitive (IC50 ≤ 1 μM) and resistant (IC50 > 1 μM) cells (Figure 1 and Table 1). Ten μM was the maximum concentration used and 1 μM the cut-off concentration to distinguish between sensitive and resistant. These values [14], [28], [29], or even higher [30] have been used by other authors as well. More importantly, it has been reported that in a phase I clinical trial, 1 μM of Selumetinib did not exceed the maximum tolerated dose achieved in the plasma of patients [31]. Both anchorage-dependent and -independent growth of sensitive but not resistant cell lines was inhibited after treatment with Selumetinib (Figure 1, Table 1). In addition, Selumetinib-sensitive cells underwent G1 arrest, whereas Selumetinib-resistant cells were barely affected by this drug (Figure 2 and Supplementary Figure 1 and Table 1).
Whether BRAF mutation status is an efficient biomarker for MEK inhibition cancer treatment has not been strictly evaluated and validated. Previous studies in melanoma cell lines found that BRAF mutation is associated with enhanced sensitivity to MEK inhibition, when compared with either wild-type cells or cells harbouring a RAS mutation [32]. It has also been shown that TORC1 suppression predicts responsiveness to RAF and MEK inhibitors in B-RAF mutant melanoma [33]. However, in a phase II clinical trial in patients with melanoma carrying BRAF mutations, tumour regression was seen only in some patients, which indicates that BRAF mutation “per se” cannot predict sensitivity to Selumetinib [11]. Furthermore, as the frequency of BRAF mutations in CRC is much lower than in melanoma, the response of BRAF mutated CRC patients to MEK inhibitors is very low. In our study, we also observed that some but not all the sensitive cell lines harbour BRAF mutations (Table 2), thus indicating a weak relationship between BRAF mutational status and sensitivity to Selumetinib (Table 3).
It is thought that cell lines or tumours with high constitutive ERK1/2 activity are more dependent on the RAF/MEK/ERK pathway for cell proliferation and survival, and hence, more sensitive to growth inhibition by MEK1/2 inhibitors [34]. In this work, however, we show that basal ERK1/2 phosphorylation levels are unrelated to the degree of cell growth inhibition accomplished after Selumetinib treatment. In particular, HGUE-C-1 and Caco-2 cells with high basal phosphorylation levels of ERK 1/2 (Figure 3, A and B) are not significantly growth inhibited when treated with Selumetinib (Figure 1 and Table 1). Furthermore, Selumetinib-sensitive cell lines exhibit low basal levels, and thus, very weak constitutive activation of ERK1/2. Therefore, inhibition of ERK1/2 by Selumetinib is not a reliable molecular determinant to predict a growth-inhibitory response to MEK inhibitors. In fact, Tentler and coauthors have shown than Mek is not a determinant of sensitivity to Selumetinib in KRAS-mutated cell lines and suggest that members of the Wnt pathway may be involved in Selumetinib resistance [35].
In addition, KRAS mutation has been the focus of extensive study as a predictive marker or response. However, all reports published to date show that KRAS mutation status alone is not sufficient to predict response to MEK inhibitors treatment in CRC and other type of tumours, bringing into question its role as a predictive marker of response [36], [37], [38], [39], [40]. In our study, we found a striking variation in the response of CRC cell lines and primary cultures derived from tumours with KRAS mutations to Selumetinib treatment, showing once again that KRAS mutation do not reliably predict sensitivity to MEK inhibitors. Thus, the complexity of this link may be due to the existence of several Ras effector targets, apart from the RAF/MEK/ERK pathway, that may offer a compensatory route to cell proliferation and survival.
Mutations in the p110α catalytic subunit of PI3K (PIK3CA) have been reported in up to 30% CRC [41] and in the last years, mutations in this gene have been linked to resistance to MEK inhibition. In this study, we found no apparent association between PIK3CA mutations and resistance to Selumetinib, as HCT116 and LS 174 T cells harbour both KRAS and PIK3CA mutations and still are sensitive to Selumetinib treatment. Other studies have reported that cell lines with mutations in both KRAS and PIK3CA genes are more resistant to MEK inhibitor treatment and down-regulation of PIK3CA resensitizes cells to MEK inhibition [40]. It has also been reported that cell lines that are resistant to Selumetinib exhibit low or undetectable ERK phosphorylated levels or show activation of both ERK1/2 and AKT1/2 [37]. Altogether, these results indicate that resistance to MEK inhibitors seems to be associated with a biochemical signature rather than a mutation in a single gene.
As an alternative, we examined whether activation of the PI3K/AKT/mTOR/p70S6K pathway could have an influence on Selumetinib resistance. To address this issue, we analysed the endogenous phosphorylation of AKT1/2, p70S6K, and RPS6 as markers for activation of the PI3K/AKT/mTOR/p70S6K pathway. Whereas no relationship was observed between AKT activation and Selumetinib sensitivity (data not shown), an association between high levels of basal phosphorylated p70S6K and RPS6 and Selumetinib resistance was found in HGUE-C-1, Caco-2, and DLD-1 cells (Figure 4). Also, when non-responsive established cell lines (Figure 4) and primary cultures (Figure 5) were treated with Selumetinib, levels of phosphorylated p70S6K and RPS6 were unaltered, indicating that resistance is associated with high endogenous phosphorylation and lack of inhibition of p70S6K and RPS6 phosphorylation after Selumetinb treatment. The use of primary cultures derived from patients is a very powerful preclinical model, which confirms the findings observed in established cell lines and serves as an ex vivo treatment for the patients. This observation prompted us to investigate whether suppression of p70S6K and RPS6 activity by pharmacologic inhibition using NVP-BEZ235, Rapamycin or PF-4708671 and biological inhibition using siRNA-mediated S6K silencing would sensitize resistant cells to Selumetinib. Very interestingly, we found that p70S6K and consequently, RPS6 inhibition sensitized cells to Selumetinib treatment (Figure 6, Figure 7, Figure 8 and Supplementary Figures 2–6).
Surprisingly, in the case of HCT-15 cells, resistance was not associated with high basal levels of phosphorylated p70S6K and RPS6, as their constitutive phosphorylation was very low, but remarkably increased after Selumetinib treatment. This induction may not be necessary in the other resistant cell lines because p70S6K and RPS6 are already activated in a constitutive manner. However, pharmacological and biological inhibition of p70S6K and consequently, RPS6 inactivation, rendered also HCT-15 cells sensitive to Selumetinib (Figure 7, Figure 8).
To conclude, advances in the understanding of cancer biology have led to the development of selective targeted therapies that are aimed to target specific cell signalling pathways. Selumetinib is a potent and selective inhibitor for MEK1/2 that has shown good anti-proliferative activity in a variety of human CRC cell lines. More recently, a second generation oral MEK inhibitor, Trametinib (GSK1120212) has gained interest and is under clinical evaluation for the treatment of melanoma and CRC [42]. Likewise, Selumetinib has entered numerous clinical trials in patients with solid tumours, including CRC: http://clinicaltrials.gov/ct2/results?term=AZD6244&Search=Search. However, despite intensive study, the molecular and genetic basis for Selumetinib resistance remains poorly understood. Thus, identification of predictive biomarkers of response to Selumetinib is a crucial challenge in cancer drug development, as it may help to recognize a molecular profile of patient's tumours to guide appropriate therapeutic choices, according to the most likely to respond to chemotherapy. In order to properly select patients, we propose to determine p70S6K and/or RPS6 endogenous activation previously to treatment, as it may be one of the causes of inefficacy of MEK inhibitors in some types of solid tumors, including CRC. Furthermore, these findings provide a strong rationale for the combination of Selumetinib and p70S6K inhibitors in cancers with high basal phosphorylation levels and hence, constitutive activation of p70S6K and RPS6. In this light, it will be important in future studies to explore whether combination therapy with Selumetinib and p70S6K and/or RPS6 inhibitors will be able to revert Selumetinib resistance in animal models, before we can proceed to prove the efficacy of these treatments in patients.
Acknowledgments
We are especially grateful to M. Angeles Ros Roca for technical assistance. We would like to thank Rosario Martinez and all the Biobank personnel for their help with the human samples. We are also grateful to our laboratory members for helpful comments. This article has been funded by a FPU fellowship from the Ministerio de Ciencia e Innovación to support Silvina Grasso, by a grant from the Asociación Española Contra el Cancer (AECC) to support M.A. Ros Roca, L. Mayor-López, E. Tristante and I Martínez-Lacaci and to a Seneca Foundation grant and Instituto de Salud Carlos III grant FIS PI10/01123 to I. Martínez-Lacaci.
Footnotes
Conflict of Interest: The authors declare not conflict of interest.
Supplementary data to this article can be found online at http://dx.doi.org/10.1016/j.neo.2014.08.011.
Appendix A. Supplementary Data
Supplementary Material.
References
- 1.Obrand D.I., Gordon P.H. Incidence and patterns of recurrence following curative resection for colorectal carcinoma. Dis Colon Rectum. 1997;40:15–24. doi: 10.1007/BF02055676. [DOI] [PubMed] [Google Scholar]
- 2.Wagner A.D., Arnold D., Grothey A.A., Haerting J., Unverzagt S. Anti-angiogenic therapies for metastatic colorectal cancer. Cochrane Database Syst Rev. 2009;3:1–78. doi: 10.1002/14651858.CD005392.pub3. (CD005392) [DOI] [PubMed] [Google Scholar]
- 3.Downward J. Targeting RAS signalling pathways in cancer therapy. Nat Rev Cancer. 2003;3:11–22. doi: 10.1038/nrc969. [DOI] [PubMed] [Google Scholar]
- 4.Lievre A., Rouleau E., Buecher B., Mitry E. Clinical significance of BRAF mutations in colorectal cancer. Bull Cancer. 2010;97:1441–1452. doi: 10.1684/bdc.2010.1225. [DOI] [PubMed] [Google Scholar]
- 5.Arrington A.K., Heinrich E.L., Lee W., Duldulao M., Patel S., Sanchez J., Garcia-Aguilar J., Kim J. Prognostic and predictive roles of KRAS mutation in colorectal cancer. Int J Mol Sci. 2012;13:12153–12168. doi: 10.3390/ijms131012153. [DOI] [PMC free article] [PubMed] [Google Scholar]
- 6.Peyssonnaux C., Eychene A. The Raf/MEK/ERK pathway: new concepts of activation. Biol Cell. 2001;93:53–62. doi: 10.1016/s0248-4900(01)01125-x. [DOI] [PubMed] [Google Scholar]
- 7.Hoshino R., Chatani Y., Yamori T., Tsuruo T., Oka H., Yoshida O., Shimada Y., Ari-i S., Wada H., Fujimoto J. Constitutive activation of the 41-/43-kDa mitogen-activated protein kinase signaling pathway in human tumors. Oncogene. 1999;18:813–822. doi: 10.1038/sj.onc.1202367. [DOI] [PubMed] [Google Scholar]
- 8.Ohren J.F., Chen H., Pavlovsky A., Whitehead C., Zhang E., Kuffa P., Yan C., McConnell P., Spessard C., Banotai C. Structures of human MAP kinase kinase 1 (MEK1) and MEK2 describe novel noncompetitive kinase inhibition. Nat Struct Mol Biol. 2004;11:1192–1197. doi: 10.1038/nsmb859. [DOI] [PubMed] [Google Scholar]
- 9.Matallanas D., Birtwistle M., Romano D., Zebisch A., Rauch J., von KA Kolch W. Raf family kinases: old dogs have learned new tricks. Genes Cancer. 2011;2:232–260. doi: 10.1177/1947601911407323. [DOI] [PMC free article] [PubMed] [Google Scholar]
- 10.Niault T.S., Baccarini M. Targets of Raf in tumorigenesis. Carcinogenesis. 2010;31:1165–1174. doi: 10.1093/carcin/bgp337. [DOI] [PubMed] [Google Scholar]
- 11.Catalanotti F., Solit D.B., Pulitzer M.P., Berger M.F., Scott S.N., Iyriboz T., Lacouture M.E., Panageas K.S., Wolchok J.D., Carvajal R.D. Phase II trial of MEK inhibitor selumetinib (AZD6244, ARRY-142886) in patients with BRAFV600E/K-mutated melanoma. Clin Cancer Res. 2013;19:2257–2264. doi: 10.1158/1078-0432.CCR-12-3476. [DOI] [PMC free article] [PubMed] [Google Scholar]
- 12.Kirkwood J.M., Bastholt L., Robert C., Sosman J., Larkin J., Hersey P., Middleton M., Cantarini M., Zazulina V., Kemsley K. Phase II, open-label, randomized trial of the MEK1/2 inhibitor selumetinib as monotherapy versus temozolomide in patients with advanced melanoma. Clin Cancer Res. 2012;18:555–567. doi: 10.1158/1078-0432.CCR-11-1491. [DOI] [PMC free article] [PubMed] [Google Scholar]
- 13.Yeh T.C., Marsh V., Bernat B.A., Ballard J., Colwell H., Evans R.J., Parry J., Smith D., Brandhuber B.J., Gross S. Biological characterization of ARRY-142886 (AZD6244), a potent, highly selective mitogen-activated protein kinase kinase 1/2 inhibitor. Clin Cancer Res. 2007;13:1576–1583. doi: 10.1158/1078-0432.CCR-06-1150. [DOI] [PubMed] [Google Scholar]
- 14.Davies B.R., Logie A., McKay J.S., Martin P., Steele S., Jenkins R., Cockerill M., Cartlidge S., Smith P.D. AZD6244 (ARRY-142886), a potent inhibitor of mitogen-activated protein kinase/extracellular signal-regulated kinase kinase 1/2 kinases: mechanism of action in vivo, pharmacokinetic/pharmacodynamic relationship, and potential for combination in preclinical models. Mol Cancer Ther. 2007;6:2209–2219. doi: 10.1158/1535-7163.MCT-07-0231. [DOI] [PubMed] [Google Scholar]
- 15.Carbonell P., Turpin M.C., Torres-Moreno D., Molina-Martinez I., Garcia-Solano J., Perez-Guillermo M., Conesa-Zamora P. Comparison of allelic discrimination by dHPLC, HRM, and TaqMan in the detection of BRAF mutation V600E. J Mol Diagn. 2011;13:467–473. doi: 10.1016/j.jmoldx.2011.03.009. [DOI] [PMC free article] [PubMed] [Google Scholar]
- 16.Garcia-Solano J., Conesa-Zamora P., Carbonell P., Trujillo-Santos J., Torres-Moreno D.D., Pagan-Gomez I., Rodriguez-Braun E., Perez-Guillermo M. Colorectal serrated adenocarcinoma shows a different profile of oncogene mutations, MSI status and DNA repair protein expression compared to conventional and sporadic MSI-H carcinomas. Int J Cancer. 2012;131:1790–1799. doi: 10.1002/ijc.27454. [DOI] [PubMed] [Google Scholar]
- 17.Berenbaum M.C. Criteria for analyzing interactions between biologically active agents. Adv Cancer Res. 1981;35:269–335. doi: 10.1016/s0065-230x(08)60912-4. [DOI] [PubMed] [Google Scholar]
- 18.Buck E., Eyzaguirre A., Brown E., Petti F., McCormack S., Haley J.D., Iwata K.K., Gibson N.W., Griffin G. Rapamycin synergizes with the epidermal growth factor receptor inhibitor erlotinib in non-small-cell lung, pancreatic, colon, and breast tumors. Mol Cancer Ther. 2006;5:2676–2684. doi: 10.1158/1535-7163.MCT-06-0166. [DOI] [PubMed] [Google Scholar]
- 19.Huang K.T., Chen Y.H., Walker A.M. Inaccuracies in MTS assays: major distorting effects of medium, serum albumin, and fatty acids. Biotechniques. 2004;37:406–412. doi: 10.2144/04373ST05. [DOI] [PubMed] [Google Scholar]
- 20.Davies C.C., Mason J., Wakelam M.J., Young L.S., Eliopoulos A.G. Inhibition of phosphatidylinositol 3-kinase- and ERK MAPK-regulated protein synthesis reveals the pro-apoptotic properties of CD40 ligation in carcinoma cells. J Biol Chem. 2004;279:1010–1019. doi: 10.1074/jbc.M303820200. [DOI] [PubMed] [Google Scholar]
- 21.Roux P.P., Shahbazian D., Vu H., Holz M.K., Cohen M.S., Taunton J., Sonenberg N., Blenis J. RAS/ERK signaling promotes site-specific ribosomal protein S6 phosphorylation via RSK and stimulates cap-dependent translation. J Biol Chem. 2007;282:14056–14064. doi: 10.1074/jbc.M700906200. [DOI] [PMC free article] [PubMed] [Google Scholar]
- 22.Baumann P., Mandl-Weber S., Oduncu F., Schmidmaier R. The novel orally bioavailable inhibitor of phosphoinositol-3-kinase and mammalian target of rapamycin, NVP-BEZ235, inhibits growth and proliferation in multiple myeloma. Exp Cell Res. 2009;315:485–497. doi: 10.1016/j.yexcr.2008.11.007. [DOI] [PubMed] [Google Scholar]
- 23.Masuda M., Shimomura M., Kobayashi K., Kojima S., Nakatsura T. Growth inhibition by NVP-BEZ235, a dual PI3K/mTOR inhibitor, in hepatocellular carcinoma cell lines. Oncol Rep. 2011;26:1273–1279. doi: 10.3892/or.2011.1370. [DOI] [PubMed] [Google Scholar]
- 24.Leung E., Kim J.E., Rewcastle G.W., Finlay G.J., Baguley B.C. Comparison of the effects of the PI3K/mTOR inhibitors NVP-BEZ235 and GSK2126458 on tamoxifen-resistant breast cancer cells. Cancer Biol Ther. 2011;11:938–946. doi: 10.4161/cbt.11.11.15527. [DOI] [PMC free article] [PubMed] [Google Scholar]
- 25.Pearce L.R., Alton G.R., Richter D.T., Kath J.C., Lingardo L., Chapman J., Hwang C., Alessi D.R. Characterization of PF-4708671, a novel and highly specific inhibitor of p70 ribosomal S6 kinase (S6K1) Biochem J. 2010;431:245–255. doi: 10.1042/BJ20101024. [DOI] [PubMed] [Google Scholar]
- 26.Farley J., Brady W.E., Vathipadiekal V., Lankes H.A., Coleman R., Morgan M.A., Mannel R., Yamada S.D., Mutch D., Rodgers W.H. Selumetinib in women with recurrent low-grade serous carcinoma of the ovary or peritoneum: an open-label, single-arm, phase 2 study. Lancet Oncol. 2013;14:134–140. doi: 10.1016/S1470-2045(12)70572-7. [DOI] [PMC free article] [PubMed] [Google Scholar]
- 27.Patel S.P., Lazar A.J., Papadopoulos N.E., Liu P., Infante J.R., Glass M.R., Vaughn C.S., LoRusso P.M., Cohen R.B., Davies M.A. Clinical responses to selumetinib (AZD6244; ARRY-142886)-based combination therapy stratified by gene mutations in patients with metastatic melanoma. Cancer. 2013;119:799–805. doi: 10.1002/cncr.27790. [DOI] [PubMed] [Google Scholar]
- 28.Troiani T., Vecchione L., Martinelli E., Capasso A., Costantino S., Ciuffreda L.P., Morgillo F., Vitagliano D., D'Aiuto E., De P.R. Intrinsic resistance to selumetinib, a selective inhibitor of MEK1/2, by cAMP-dependent protein kinase A activation in human lung and colorectal cancer cells. Br J Cancer. 2012;106:1648–1659. doi: 10.1038/bjc.2012.129. [DOI] [PMC free article] [PubMed] [Google Scholar]
- 29.Garon E.B., Finn R.S., Hosmer W., Dering J., Ginther C., Adhami S., Kamranpour N., Pitts S., Desai A., Elashoff D. Identification of common predictive markers of in vitro response to the Mek inhibitor selumetinib (AZD6244; ARRY-142886) in human breast cancer and non-small cell lung cancer cell lines. Mol Cancer Ther. 2010;9:1985–1994. doi: 10.1158/1535-7163.MCT-10-0037. [DOI] [PMC free article] [PubMed] [Google Scholar]
- 30.Yang J.Y., Chang C.J., Xia W., Wang Y., Wong K.K., Engelman J.A., Du Y., Andreeff M., Hortobagyi G.N., Hung M.C. Activation of FOXO3a is sufficient to reverse mitogen-activated protein/extracellular signal-regulated kinase kinase inhibitor chemoresistance in human cancer. Cancer Res. 2010;70:4709–4718. doi: 10.1158/0008-5472.CAN-09-4524. [DOI] [PMC free article] [PubMed] [Google Scholar]
- 31.Adjei A.A., Cohen R.B., Franklin W., Morris C., Wilson D., Molina J.R., Hanson L.J., Gore L., Chow L., Leong S. Phase I pharmacokinetic and pharmacodynamic study of the oral, small-molecule mitogen-activated protein kinase kinase 1/2 inhibitor AZD6244 (ARRY-142886) in patients with advanced cancers. J Clin Oncol. 2008;26:2139–2146. doi: 10.1200/JCO.2007.14.4956. [DOI] [PMC free article] [PubMed] [Google Scholar]
- 32.Solit D.B., Garraway L.A., Pratilas C.A., Sawai A., Getz G., Basso A., Ye Q., Lobo J.M., She Y., Osman I. BRAF mutation predicts sensitivity to MEK inhibition. Nature. 2006;439:358–362. doi: 10.1038/nature04304. [DOI] [PMC free article] [PubMed] [Google Scholar]
- 33.Corcoran R.B., Rothenberg S.M., Hata A.N., Faber A.C., Piris A., Nazarian R.M., Brown R.D., Godfrey J.T., Winokur D., Walsh J. TORC1 suppression predicts responsiveness to RAF and MEK inhibition in BRAF-mutant melanoma. Sci Transl Med. 2013;5(196):196ra98. doi: 10.1126/scitranslmed.3005753. [DOI] [PMC free article] [PubMed] [Google Scholar]
- 34.Sebolt-Leopold J.S., Dudley D.T., Herrera R., Van B.K., Wiland A., Gowan R.C., Tecle H., Barrett S.D., Bridges A., Przybranowski S. Blockade of the MAP kinase pathway suppresses growth of colon tumors in vivo. Nat Med. 1999;5:810–816. doi: 10.1038/10533. [DOI] [PubMed] [Google Scholar]
- 35.Tentler J.J., Nallapareddy S., Tan A.C., Spreafico A., Pitts T.M., Morelli M.P., Selby H.M., Kachaeva M.I., Flanigan S.A., Kulikowski G.N. Identification of predictive markers of response to the MEK1/2 inhibitor selumetinib (AZD6244) in K-ras-mutated colorectal cancer. Mol Cancer Ther. 2010;9:3351–3362. doi: 10.1158/1535-7163.MCT-10-0376. [DOI] [PMC free article] [PubMed] [Google Scholar]
- 36.Yeh J.J., Routh E.D., Rubinas T., Peacock J., Martin T.D., Shen X.J., Sandler R.S., Kim H.J., Keku T.O., Der C.J. KRAS/BRAF mutation status and ERK1/2 activation as biomarkers for MEK1/2 inhibitor therapy in colorectal cancer. Mol Cancer Ther. 2009;8:834–843. doi: 10.1158/1535-7163.MCT-08-0972. [DOI] [PMC free article] [PubMed] [Google Scholar]
- 37.Balmanno K., Chell S.D., Gillings A.S., Hayat S., Cook S.J. Intrinsic resistance to the MEK1/2 inhibitor AZD6244 (ARRY-142886) is associated with weak ERK1/2 signalling and/or strong PI3K signalling in colorectal cancer cell lines. Int J Cancer. 2009;125:2332–2341. doi: 10.1002/ijc.24604. [DOI] [PubMed] [Google Scholar]
- 38.Little A.S., Balmanno K., Sale M.J., Newman S., Dry J.R., Hampson M., Edwards P.A., Smith P.D., Cook S.J. Amplification of the driving oncogene, KRAS or BRAF, underpins acquired resistance to MEK1/2 inhibitors in colorectal cancer cells. Sci Signal. 2011;4(166):ra17. doi: 10.1126/scisignal.2001752. [DOI] [PubMed] [Google Scholar]
- 39.Meng J., Peng H., Dai B., Guo W., Wang L., Ji L., Minna J.D., Chresta C.M., Smith P.D., Fang B. High level of AKT activity is associated with resistance to MEK inhibitor AZD6244 (ARRY-142886) Cancer Biol Ther. 2009;8:2073–2080. doi: 10.4161/cbt.8.21.9844. [DOI] [PMC free article] [PubMed] [Google Scholar]
- 40.Wee S., Jagani Z., Xiang K.X., Loo A., Dorsch M., Yao Y.M., Sellers W.R., Lengauer C., Stegmeier F. PI3K pathway activation mediates resistance to MEK inhibitors in KRAS mutant cancers. Cancer Res. 2009;69:4286–4293. doi: 10.1158/0008-5472.CAN-08-4765. [DOI] [PubMed] [Google Scholar]
- 41.Samuels Y., Velculescu V.E. Oncogenic mutations of PIK3CA in human cancers. Cell Cycle. 2004;3:1221–1224. doi: 10.4161/cc.3.10.1164. [DOI] [PubMed] [Google Scholar]
- 42.Zeiser R. Trametinib. Recent Results Cancer Res. 2014;201:241–248. doi: 10.1007/978-3-642-54490-3_15. [DOI] [PubMed] [Google Scholar]
Associated Data
This section collects any data citations, data availability statements, or supplementary materials included in this article.
Supplementary Materials
Supplementary Material.