

Abstract
The delivery of bioactive molecules into cells has broad applications in biology and medicine. Polymer-modified graphene oxide (GO) has recently emerged as a de facto noncovalent vehicle for hydrophobic drugs. Here, we investigate a different approach using native GO to deliver hydrophilic molecules by co-incubation in culture. GO adsorption and delivery were systematically studied with a library of 15 molecules synthesized with Gd(III) labels to enable quantitation. Amines were revealed to be a key chemical group for adsorption, while delivery was shown to be quantitatively predictable by molecular adsorption, GO sedimentation, and GO size. GO co-incubation was shown to enhance delivery by up to 13-fold and allowed for a 100-fold increase in molecular incubation concentration compared to the alternative of nanoconjugation. When tested in the application of Gd(III) cellular MRI, these advantages led to a nearly 10-fold improvement in sensitivity over the state-of-the-art. GO co-incubation is an effective method of cellular delivery that is easily adoptable by researchers across all fields.
Keywords: graphene oxide, delivery vehicle, surface interaction, gadolinium, adsorption, sedimentation, cell culture
Graphene oxide (GO) is a two-dimensional mosaic of hydroxyls, epoxides, carbonyls, and aromatic rings.1,2 Its specific surface area surpasses that of other nanomaterials by 10-fold and encroaches on the theoretical maximum.3 These quintessential surfaces noncovalently interact with each other and with molecules in solution through a rich, multivalent combination of hydrogen bonding, charge interactions, π chemistry, and hydrophobic effects.4,5 The unparalleled surface area and the diverse surface chemistry make GO an attractive platform as a cellular delivery vehicle.6
Recently, surface-modified GO7−9 has been shown to deliver a variety of molecules,10−15 with hydrophobic drugs8,16−22 and single-stranded DNA7,23−27 being the most actively explored. However, an incomplete understanding of the GO system and the synthetic proficiency required to produce the nanocomplexes have hindered the adoption of these approaches by the larger biomedical community. Of equal importance, hydrophilic small molecules as a class have been largely overlooked in the studies of GO delivery thus far due to the presumed critical role of π–π stacking and hydrophobic effects in the cargo–GO interaction.3,4,8,16−18,28
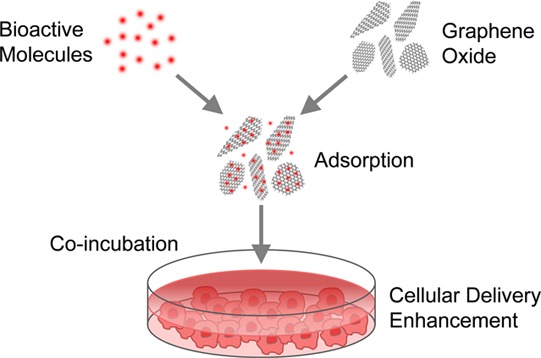
To gain a better fundamental understanding and to expand the practical horizons of GO cellular delivery, we used native GO to deliver a library of 15 hydrophilic, Gd(III)-labeled small molecules by co-incubation in culture (Figure 1). Fundamentally, the Gd(III) labels and the chemical variety found in the library enabled a quantitative understanding of the molecular adsorption and delivery process. Practically, the use of unmodified GO allowed for the unconventional exploitation of sedimentation in delivery, while the co-incubation approach enabled the use of extremely high molecular incubation concentrations. To demonstrate the advantages of these properties, GO co-incubation was evaluated in the application of Gd(III) cellular magnetic resonance imaging (MRI). The systematic studies performed inform the use of GO co-incubation in other applications. The simplicity of the described strategy makes it immediately accessible to the biomedical community at large.
Figure 1.
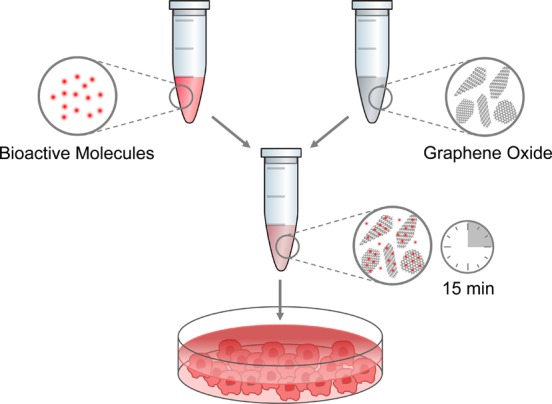
Cellular delivery of bioactive molecules can be enhanced by simple mixing and co-incubation with graphene oxide in culture.
Results and Discussion
Two GO sizes with characteristic lateral lengths of 150 or 1500 nm were studied (Figure S1, Table S1). Both samples were unmodified single sheets (Table S1) with similar chemical compositions consisting of an average C–C:C–O:C=O:C(O)O distribution of 10:5.5:4.1:1.4 (Figures S2, S3). The small-molecule library studied consisted of 12 synthesized and three commercially available molecules (Figure 2). Their chemical characteristics spanned a wide range of charges (4 negative, 6 neutral, 5 positive), hydrophobicity (−4.3 < logP < −1.3), and functional groups (Table S2). For each of the 30 molecule–GO pairs, molecular adsorption, GO sedimentation, and cellular delivery enhancement were measured in 10% serum-supplemented minimum essential media (Figure 3). From these results, the relative importance of different chemical groups in GO surface interaction and the factors controlling GO delivery performance were assessed.
Figure 2.

Structures of the 15 molecules tested with GO for adsorption, sedimentation, and cellular delivery. The quenching properties of GO usually hinder quantitative studies. The challenge is overcome by using Gd(III) to enable analytical quantitation by ICP.
Figure 3.

(a) GO adsorbed a variety of molecules in cell culture media with amines (9, 10, 11, 13) producing the strongest interaction. (b) GO sedimentation induced by molecular adsorption was measured by the fraction of GO remaining in the supernatant after centrifugation at varying speeds. The area under each curve can be used to quantify sedimentation. (c) In cell culture, co-incubation with GO enhanced the cellular delivery of a variety of molecules up to 13-fold. The Gd(III) and GO incubation concentrations were 188 μM and 18.8 μg/mL, respectively. Error bars show SEM.
Molecular Adsorption on GO
Out of the 15 molecules in the library, nine showed appreciable adsorption on GO up to a loading ratio of 27 wt % (Figure 3a). For comparison, reported loading ratios for camptothecin, Magnevist-PDDA, and doxorubicin are 5,18 31,22 and 131–400 wt %,17,18,22 respectively. The 1500 nm GO exhibited similar to slightly higher adsorption compared to the 150 nm GO, indirectly suggesting that the molecules may be interacting with the GO basal planes as opposed to their edges.
On the basis of molecules 1–7, alkyls, hydroxyls, phosphates, and amines promote adsorption to GO over carboxyls, quaternary ammoniums, and benzenes. The low adsorption of 7 contradicts the prevalent view on the role of π chemistry in cargo–GO interaction but is consistent with the density functional theory studies performed by Saikia and Deka.29 The adsorption of camptothecin on GO was shown to be facilitated by hydrogen bonding rather than π stacking due to significant distortion of the GO basal plane.
Molecules functionalized by amines without the triazole ring formed via click chemistry (9, 10, 11, and 13) showed the most prominent adsorption out of the library. Replacement of the triazole in 4 by an alkyl chain increased adsorption by 10–20-fold, suggesting that triazoles do not interact with GO favorably. The strong interaction between amines and GO is consistent with similar observations published for graphenes30 and carbon nanotubes.31 The commonality suggests that the sp2 carbon network contributed to the amine–GO interaction in addition to the oxygen groups.
Further quantitative analysis was prompted by the adsorption of Magnevist (12), as the molecule lacks apparently available chemical groups that would mediate a strong interaction. The result showed that adsorption could not be easily predicted by the charge, hydrophobicity, or hydrogen-bonding potential of the adsorbing molecule (Figure S4). Therefore, the intricacies of GO adsorption in complex media are beyond prediction by simple chemical variables.
GO Sedimentation
Surface-adsorbing molecules have the potential to modify the sedimentation behavior of GO by influencing the attractive and repulsive forces between sheets. Sedimentation is generally regarded as an undesirable property of nanomaterials due to the additional variability it introduces into the system.32 However, the same phenomenon can benefit cellular delivery via a local concentrating effect at the bottom of the cell culture.33 Therefore, the increased sedimentation of native GO in media compared to polymer-stabilized GO can be advantageous for cellular delivery in culture. To investigate this aspect of GO delivery, the GO sedimentation of each molecule–GO pair was measured by recording the percentage of GO remaining in the supernatant after centrifugation at varying speeds (Figure 3b). Quantitative comparisons were made by a calculation of the area under the sedimentation curve (AUC). As expected, the results showed increased GO sedimentation in media compared to water (Figure S5), with the 1500 nm GO experiencing more sedimentation than the smaller GO. Additionally, a minimum adsorption of 100 molecules/105 C was found to be necessary to influence sedimentation, with the degree of impact varying depending on the adsorbing molecule.
Cellular Delivery Enhancement by GO Co-incubation
When the library of 15 molecules was co-incubated with GO in cell culture (HeLa), delivery enhancement of up to 13-fold was observed (Figure 3c, Table S3). Varying degrees of adsorption among the different molecules explain 70–80% of the variances in their delivery enhancement by GO (Figure 4a). Additionally, molecules that induced GO sedimentation, as indicated by smaller AUC, gained the most in delivery (Figure 4b).
Figure 4.
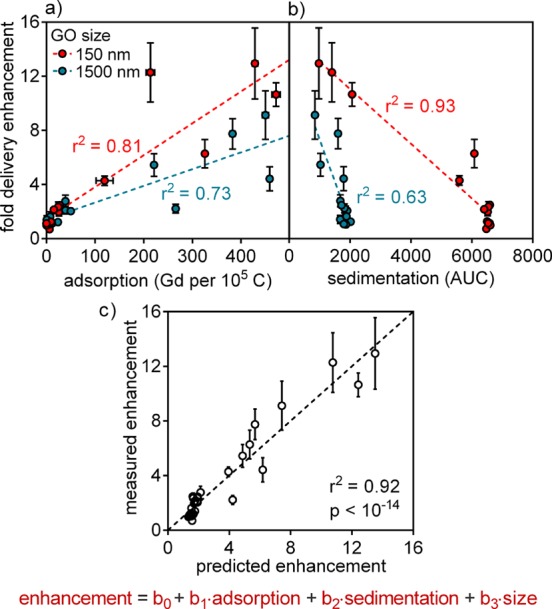
Molecular adsorption, GO sedimentation, and GO size control the cellular delivery process. Molecules that (a) exhibited higher adsorption and (b) induced increased sedimentation experienced greater delivery enhancement by GO. Simple linear regression required separate fits for the two GO sizes. (c) Multiple linear regression united the data sets with a model that explained 92% of all observed variances in delivery enhancement. Each of adsorption, sedimentation, and size was found to be a significant factor at p < 10–6. Error bars show SEM.
Univariate analysis is limited by factor interactions and confounding variables; therefore, multiple linear regression was employed to build a more robust quantitative model. Regression analysis shows that adsorption, sedimentation, and size are all highly significant independent predictors of delivery enhancement (Figures 4c, S6, Table S4). The regression coefficients for adsorption (b1), sedimentation (b2), and size (b3) are 1.0 × 10⁻², −1.4 × 10⁻³, and −7.2 × 10⁻³, respectively, when the variables are expressed in units of Gd/105C, AUC, and nm. The negative sign of b3 indicates that cells intrinsically favor the smaller GO over the larger GO. Importantly, this conclusion was reached after removing the confounding effects of sedimentation.33 The higher delivery of the smaller GO suggests that it experiences more frequent endocytic uptake34 and cell membrane insertion35,36 relative to the larger GO. The combination of statistical modeling and a quantitative library was proven to be a powerful approach for gaining mechanistic insights into the GO system.
To further validate GO as the effector of delivery and to better understand the practical parameters that control the process, the co-incubation protocol was studied in more detail on a single cargo–GO combination. Magnevist was selected for the studies because it exhibited high adsorption and is commercially available. The 150 nm GO was selected over the 1500 nm GO due to its superior delivery performance. Co-incubation allowed for the independent control of cargo and GO concentrations in culture, with GO enhancing delivery across 2 orders of magnitude of Magnevist concentration (0.19–35 mM) (Figure 5a). Significantly, in the co-incubation approach, it was possible to use a Magnevist concentration that is 100-fold greater compared to using purified Magnevist–GO nanocomplexes reported by our own group37 and others.38 Additionally, the cargo-to-GO ratio achievable in co-incubation far exceeds that achievable in a nanocomplex. At 35 mM Magnevist and 20 μg/mL GO, the cargo-to-GO ratio is 2.1 × 10⁶ Gd/105 C, compared to the measured adsorption of only 326 Gd/105 C after repeated washing (Figure 3a). The substantially higher cargo-to-GO ratio attainable in co-incubation compared to noncovalent conjugation allows weak and transient interactions to contribute to the delivery process. The ability to exploit weak interactions and extremely high cargo concentrations are unique advantages of the co-incubation approach.
Figure 5.
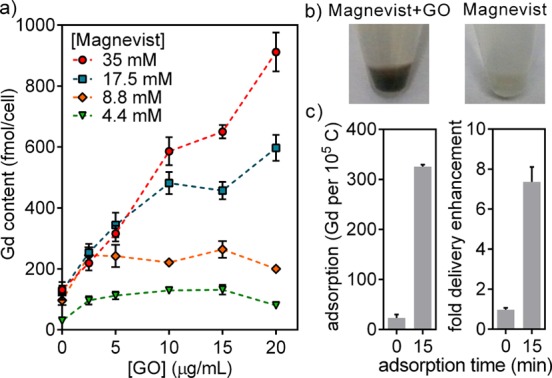
Delivery by GO is (a) dose-dependent, (b) observable by cell coloration, and (c) abolished without sufficient adsorption time. Co-incubation enabled the independent control of molecular and GO concentrations. The use of Magnevist in the mM range is 100-fold greater compared to purified Magnevist–GO complexes. The 150 nm GO was used for the studies. Error bars show SEM.
In addition to the demonstrated dose-dependent uptake in culture, GO delivery was further validated by two lines of evidence. First, GO coloration can be directly observed in cell pellets after incubation (Figure 5b). Second, direct addition of Magnevist and GO into media without a preincubation period in water eliminated both adsorption and delivery enhancement (Figures 5c, S7). The kinetics of GO adsorption and desorption are parameters that can potentially be engineered through the choice of incubation media to further control the delivery process.
Next, the cytotoxicity of GO was evaluated at varying cargo concentrations on HeLa cells. Cell viability remained above 90% for GO concentrations up to 250 μg/mL and Magnevist concentrations up to 35 mM (Figures 6, S8). When Magnevist concentration was increased to 70 mM, synergistic cytotoxicity was observed. However, concentrations as high as 70 mM Magnevist and 250 μg/mL GO were required to decrease the cell viability to below 60%. The high tolerance of cells toward GO is consistent with literature reports and has been shown to be mediated by serum proteins.39 On the basis of these results, there is no cytotoxicity concern for GO at the doses and time scales required to achieve delivery enhancement.
Figure 6.
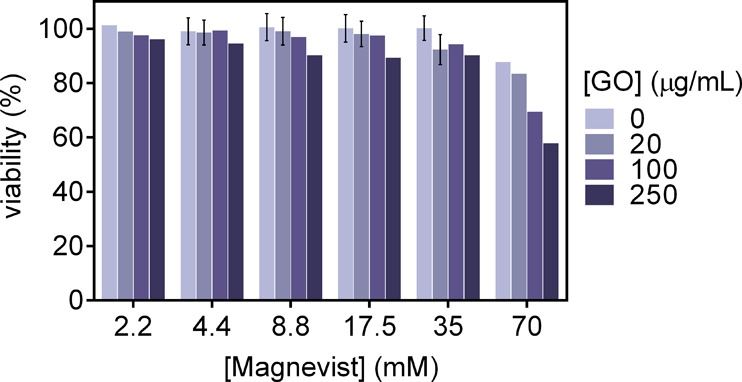
Twenty-four-hour cytotoxicity assay using HeLa cells at increasing Magnevist and GO concentrations. No significant cytotoxicity was observed up to a Magnevist concentration of 35 mM and a GO concentration of 250 μg/mL. The maximum GO dose required for cellular delivery enhancement is 20 μg/mL, or an order of magnitude below the highest tested dose. The 150 nm GO was used for the study.
Finally, the robustness of the co-incubation protocol was evaluated in terms of generalizability to other cell lines, inherent variability, and sensitivity to procedural parameters (Figures S9–S11). GO co-incubation was shown to consistently enhance cellular delivery across the entire range of tested conditions, although the degree of enhancement achieved varied. Parameters such as plated cell density, incubation vessel, and GO concentration influence the performance of GO delivery.
Evaluation of GO Co-incubation in Gd(III) Cellular MRI
In addition to serving as a quantitative label, the contrast-enhancing properties of Gd(III) in MRI provide a convenient application for comparing GO co-incubation with the nanoconjugation approach.40,41 In cellular MRI, the sensitivity for Gd(III)-labeled cells is directly related to the Gd(III) label relaxivity and the cellular Gd(III) content, with the minimum requirement being 0.1–1 fmol/cell.42 The highest cellular labeling reported to date is 31 fmol Gd/cell using the clinical agent ProHance at an incubation concentration of 100 mM.43 Gd(III) agents attached to nanomaterial scaffolds are an attractive alternative because they exhibit increased relaxivity and show efficient cell labeling.38,44−51 However, their incubation concentration is typically limited to the μM range due to colloidal instability or increased toxicity compared to clinical agents.38,47−50,52−54 Consequently, typical cellular labeling achieved with nanomaterial agents ranges from 0.1 to 2 fmol Gd/cell, or approximately an order of magnitude below the state-of-the-art.47,50,55 GO co-incubation combines the relaxivity and delivery advantages of nanomaterials with the ability to use extremely high label incubation concentrations.
HeLa cells labeled by Magnevist with and without GO were suspended in agarose at various densities to characterize their sensitivity on MRI (Figure 7). Procedural changes needed to produce the cell–agarose phantoms, including a change in culturing plates and the need to centrifuge cells, decreased the cellular Gd(III) contents in this experiment compared to the other studies performed (Figures S10, S11). The labeling achieved using Magnevist alone (35 mM) and with GO co-incubation (10 μg/mL) was 30 and 47 fmol Gd/cell, respectively. As expected, the labeling by Magnevist was comparable to the highest reported literature value, while that attained with GO represented a further improvement of 57%. Compared to Gd(III)-DNA gold nanoparticles,47 Gd(III)-labeled polymer-liposomes,50 gadonanotubes, and gadofullerenols,55 GO co-incubation achieved a cellular Gd(III) payload that is 30–50-fold greater. The co-incubation approach provided an advantage in Gd(III) delivery over nanoconjugation by allowing the use of millimolar cargo concentrations during incubation.
Figure 7.
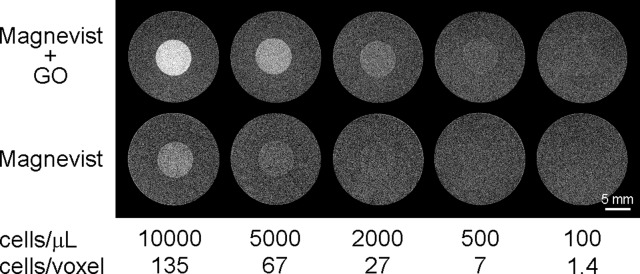
GO co-incubation enhanced the sensitivity of Magnevist-labeled cells from 5000 cells/μL to 500 cells/μL on T1-weighted MRI at 7 T. For comparison, a packed cell pellet has approximately 385 000 cells/μL using the reported HeLa cellular volume of 2.6 pL. The 150 nm GO was used for the study.56
In addition to Gd(III) payload, the sensitivity of cellular MRI is affected by Gd(III) relaxivity. Relaxivity is a measure of the ability of a paramagnetic label to generate contrast. GO has been known to increase the relaxivity of Gd(III) agents through a slowing of molecular tumbling.37,38,57 Additionally, studies suggest that GO interacts with cells by both endocytosis34 and direct membrane insertion,35,36 resulting in the delivery of cargos to the cytosol,15,23 the cell membrane, and the endosomes.34 Therefore, the Gd(III) labels delivered by GO are not expected to experience significant barriers to water access. In contrast, Gd(III) labels without nanomaterial delivery are sequestered into cells by pinocytosis and experience a phenomenon known as relaxivity quenching due to reduced water exchange.42 The combination of increased Gd(III) payload and enhanced relaxivity mediated by GO has a multiplicative effect that evidently increased the MRI sensitivity for labeled cells by nearly 10-fold compared to Magnevist alone (Figure 7). In other words, the use of GO provided a dual advantage of both increased cellular Gd(III) content and improved Gd(III) potency. To our knowledge, the level of sensitivity achieved has not been previously reported for a Gd(III)-nanomaterial and serves as a testament to the benefits of GO co-incubation over nanoconjugation as an approach to nanomaterial delivery.
Conclusion
In conclusion, GO co-incubation enhances the cellular delivery of a variety of hydrophilic small molecules in culture. The strategy is simple and inexpensive and requires no synthetic expertise. High degrees of enhancement up to 13-fold were achieved for molecules that adsorbed strongly and induced sedimentation. Adsorption was found to be mediated by alkyls, hydroxyls, phosphates, and amines, while triazoles disrupt the interactions. GO with a lateral dimension of 150 nm achieved intrinsically higher cellular delivery compared to its 1500 nm counterpart independent of sedimentation. Compared to using purified nanocomplexes, co-incubation allowed for a 100-fold increase in cargo incubation concentration. As a direct consequence, GO co-incubation circumvented a key shortcoming of other nanomaterial solutions in the application of Gd(III) cellular MRI.
Guided by the results of the systematic studies performed, the strategy of GO co-incubation can be expected to generalize to other cargos and applications. Further optimization of the co-incubation protocol may be achievable using centrifugation, high-density 2D materials, or engineered incubation media. Potential opportunities await in translating the co-incubation approach in vivo via co-injection and in further understanding the forces that control molecular adsorption and desorption in GO.
Materials and Methods
Synthesis of Gd(III)-Labeled Molecules
All reactions were conducted under an atmosphere of nitrogen gas, and all solvents and chemical reagents were obtained from Sigma-Aldrich Chemical Co. (St. Louis, MO, USA) unless otherwise noted and used without further purification. Deionized water (18.2 MΩ·cm at 25 °C) was obtained from a Millipore Q-Guard System equipped with a quantum Ex cartridge. Thin-layer chromatography (TLC) was performed using 60F 254 silica gel plates (EMD Biosciences), and flash column chromatography was performed with standard grade 60 Å 230–400 mesh silica gel (Sorbent Technologies).
Purification and characterization were performed using reverse-phase HPLC/MS. Electrospray ionization mass spectrometry (ESI-MS) spectra were acquired on a Varian 1200L single-quadrupole mass spectrometer. Unless otherwise noted, analytical reverse-phase HPLC-MS was performed on a Varian Prostar 500 system with a Waters 4.6 × 250 mm 5 μm Atlantis C18 column, and preparative runs were performed on a Waters 19 × 250 mm Atlantis C18 column.
Syntheses of 1–7 were carried out via copper(I)-catalyzed azide–alkyne click chemistry between Gd(HPN3DO3A) and the corresponding alkyne-functionalized pendant group. Gd(HPN3DO3A) is an azide-bearing Gd(III) chelate synthesized using previously published procedures.588 was synthesized following previously published procedures.599–11 were synthesized following a synthetic route reported in the literature with modifications.4812 was purchased from Sigma-Aldrich (catalogue number 381667) and used as supplied. When preparing solutions of 12, the pH was adjusted to 7 using 2.0 M NaOH. 13 was synthesized following previously published procedures.3714 was synthesized by reacting DO3A with propylene oxide, followed by metalation with Gd(OAc)3. 15 was generated by metalating the DOTA ligand purchased from Macrocyclics, Inc. Details of the reaction conditions and purification methods are reported in the Supporting Information.
Graphene Oxide Synthesis
GO was synthesized using a modified Hummers method as previously reported.60 A 115 mL amount of concentrated sulfuric acid (Mallinckrodt Baker) were cooled to 0 °C in an ice water bath. Five grams of natural graphite flakes (Asbury Graphite Mills, 3061 grade) was added to the cooled acid. A 15 g portion of KMnO4 was then slowly added to the acid and graphite mixture with stirring and further cooling to keep the temperature below 20 °C. The mixture was then heated and held at 35 °C for 2 h under constant stirring. Then 230 mL of deionized water (DI) was added to the mixture slowly to avoid a rapid increase in temperature. The reaction was terminated 15 min later by the further addition of 700 mL of DI. Finally, 12.5 mL of 30% H2O2 was slowly added under constant stirring. The slurry was then vacuum filtered and washed with 1.25 L of 1:10 HCl solution to remove metal ions and other contaminants. Following washing, the solution was resuspended in 500 mL of DI and centrifuged for 12 h at 7500 rpm in an Avanti J-26XPI centrifuge (Beckman Coulter) with a JS-7.5 swinging bucket rotor to sediment the GO. The supernatant containing residual HCl was decanted. This wash step in DI water was repeated six times so that the final resuspension in DI resulted in a pH 6 mixture. For the 150 nm GO, 90 mL batches of the resuspended solution were ultrasonicated in 150 mL stainless steel beakers using a Fisher Scientific model 500 Sonic Dismembrator with a 1/2 in. tip for 1 h at 50% amplitude (∼55 W) while cooled in an ice water bath. For the 1500 nm GO, 90 mL batches of the resuspended solution were bath-sonicated for 1 h. For both the 150 nm and the 1500 nm GO, a final centrifugation step of 5000 rpm for 10 min was performed to remove any unoxidized graphite.
Atomic Force Microscopy
For sample preparation, GO was deposited onto silicon wafers with a 300 nm oxide layer as a substrate. This process is similar to a previously reported procedure.61 The substrates were washed with acetone and 2-propanol and thoroughly rinsed with DI water. They were then submerged in a 2.5 mM (3-aminopropyl)triethoxysilane (APTES) solution for 30 min. The substrates were then rinsed twice with DI water and dried with nitrogen. Immediately, 15 μL of a 0.005–0.01 mg/mL GO solution was placed on the surface and left undisturbed for 10 min. The substrates were again rinsed twice with DI water and dried with nitrogen. The samples were annealed at 250 °C in air for 30 min to remove residual APTES. AFM was performed with a procedure reported elsewhere61 using a Thermo Microscopes Autoprobe CP-Research AFM in tapping mode with conical, symmetric tips (Budget Sensors, All-In-One, cantilever B).
Raman Spectroscopy
Sample preparation for Raman spectroscopy was performed as with the AFM samples except the final annealing step at 250 °C was omitted. Raman spectra were obtained using an Acton TriVista CRS confocal Raman system with excitation radiation of an Ar–Kr 514.5 nm gas laser at a power of ∼10 mW. Spectra were recorded in the range of 1100–3500 cm–1 over several different GO sheets and samples. Backgrounds were subtracted and spectra were normalized for comparison.
X-ray Photoelectron Spectroscopy
For sample preparation, approximately 0.5 mg of GO was vacuum filtered onto a 0.025 μm membrane (Millipore, CSWP) and rinsed with 10 mL of DI. The filters were allowed to dry in air before measurement. XPS measurements were performed using a Thermo Scientific ESCALAB 250Xi system. Several spectra were recorded for each sample. Data were corrected for charge shifting and fitted using the Thermo Scientific Avantage data system.
Inductively Coupled Plasmon–Mass Spectrometry
ICP-MS samples were prepared in 15 mL conical tubes by adding ACS reagent grade nitric acid (70%), followed by incubation at 70 °C overnight to allow for complete sample digestion. The effectiveness of this digestion protocol was previously validated for GO.37 After incubation, a multielement internal standard (containing Bi, Ho, In, Li, Sc, Tb, and Y, Inorganic Ventures, Christiansburg, VA, USA) and milli-Q water (18.2 MΩ·cm) were added to produce a final sample of 3% (v/v) nitric acid and 5 ng/mL internal standard.
ICP-MS was performed on a computer-controlled (Plasmalab software) Thermo X series II ICP-MS (Thermo Fisher Scientific, Waltham, MA, USA) operating in standard mode equipped with an ESI SC-2 autosampler (Omaha, NE, USA). Each sample was acquired using 1 survey run (10 sweeps) and 3 main (peak jumping) runs (100 sweeps). The isotopes selected for analysis were 154,157,158Gd with 115In and 165Ho isotopes selected as internal standards for data interpolation. Instrument performance is optimized daily through an autotune followed by verification via a performance report (passing manufacturer specifications). Instrument calibration was accomplished by preparing individual-element Gd standards (Inorganic Ventures) using concentrations of 0.781 25, 1.5625, 3.125, 6.25, 12.50, 25.00, 50.00, 100.0, and 200.0 ng/mL containing 3.0% nitric acid (v/v) and 5.0 ng/mL of multielement internal standard.
Molecular Adsorption Assay
Solutions of Gd(III)-labeled molecules were prepared by dissolving approximately 1 mg of compound in 1 mL of Milli-Q water. The exact concentration of Gd in each sample was determined by ICP-MS. These solutions were then diluted to 1 mM Gd concentration and stored at 4 °C. GO (150 and 1500 nm) solutions were prepared by diluting the stock solutions to a concentration of 0.1 mg/mL as measured by UV–vis absorbance at 300 nm (extinction coefficient 3650 mL mg–1 m–1).61
To test adsorption, 75 μL of small molecules and 75 μL of GO were mixed together and left undisturbed for at least 15 min. Then 250 μL of MEM (Life Technologies, Carlsbad, CA, USA) supplemented with 10% FBS (VWR Scientific, Radnor, PA, USA) was added to result in a 400 μL mixture. The ratios and volumes chosen replicate the conditions used in cell delivery experiments. The mixtures were gently rotated for 30–60 min, followed by centrifugation at 14 800 rpm for 20 min (Thermo Scientific, model Legend Micro 21R). A 385 μL amount of supernatant was removed and saved for T2 relaxation time measurement. The pellet was resuspended with 385 uL of 5:3 MEM/Milli-Q water. The centrifugation wash step was repeated until the T2 relaxation time of the supernatant approximates that of 5:3 MEM/Milli-Q water without Gd (2300–2500 ms) as measured by a Bruker mq60 Minispec relaxometer (Bruker Canada, Milton, Ontario, Canada). Typically, three washes were necessary to satisfy this criterion. After the final wash, all supernatant was removed and the pellet was resuspended in 400 μL of Milli-Q water to minimize UV–vis interference. A 200 μL portion of the final resuspended solution was used to prepare ICP-MS samples for Gd concentration determination; the remaining 200 μL was measured by UV–vis at 300 nm wavelength to determine GO concentration. For samples that flocculated, as evidenced by increased contribution from light scattering during UV–vis measurement, the recorded absorbance was reduced by an empirical correction factor of 1.353.
A control experiment was performed for each of the 14 small molecules by replacing the 75 μL of GO with pure Milli-Q water. After the final wash, 385 μL of supernatant was removed and replaced with 385 μL of Milli-Q water. A 200 μL amount of the final solution was used to prepare ICP-MS samples for Gd concentration determination.
To calculate adsorption, Gd concentration of the control was subtracted from the Gd concentration of the Gd–GO mixtures. GO concentration was converted to carbon concentration by atomic mass. The carbon concentration was overestimated because oxygen was not taken into account in the conversion. Adsorption was obtained by taking the ratio of the corrected Gd concentration to the calculated carbon concentration.
Adsorption Time Study
For studies investigating zero adsorption time, 75 μL of GO was added to 250 μL of media, followed by the addition of 75 μL of the Gd(III)-labeled molecule. The solution was left undisturbed for at least 15 min before being transferred to a rotator. The rest of the study was performed following the procedures as already described.
Octanol–Water Partition Coefficients
Approximately 1 mg of each compound was dissolved in 1 mL of a 1:1 mixture of water/1-octanol. After shaking the sample tube vigorously for 30 s, the tube was placed on a rotator for gentle mixing over 6 h. The tube was then removed from the rotator and allowed to sit for 12 h to ensure complete separation of the aqueous and organic phases. Once separation was complete, 10 μL was removed from each layer to determine the concentration of Gd by ICP-MS. The partition coefficient was calculated from the following equation: log10P = log10(Co/Cw), where log10P is the logarithm of the partition coefficient, Co is the concentration of Gd in the 1-octanol layer, and Cw is the concentration of Gd in the water layer.
Sedimentation Assay
Solutions of Gd(III)-labeled molecules were prepared by dissolving approximately 1 mg of compound in 1 mL of Milli-Q water. The exact concentration of Gd in each sample was determined by ICP-MS. These solutions were then diluted to 1 mM Gd concentration and stored at 4 °C. GO (150 and 1500 nm) solutions were prepared by diluting the stock solutions to a concentration of 0.1 mg/mL as measured by UV–vis absorbance at 300 nm (extinction coefficient 3650 mL mg–1 m–1).61
In a 1.5 mL microcentrifuge tube, 75 μL of small molecule and 75 μL of GO were mixed together and left undisturbed for at least 15 min, followed by addition of 250 μL of MEM supplemented with 10% FBS to result in a 400 μL mixture. The ratios and volumes chosen replicate the conditions used in cell delivery experiments. After mixing, the solutions were gently rotated for 30–60 min. To measure sedimentation, the solutions were centrifuged for 10 min in a Legend Micro 21R model centrifuge (Thermo Scientific) at predetermined speeds (e.g., 0, 2000, 4000, 6000, 8000 rpm). Following each round of centrifugation, 100 μL of supernatant was removed and measured with UV–vis at 325 nm wavelength using 5:3 MEM/Milli-Q water as the blank. The supernatant was returned to the original solution and mixed using a pipet for another round of centrifugation at a different speed. A sedimentation curve was constructed by plotting the fraction of GO remaining in the supernatant against centrifugation speed. Sedimentation was quantified by taking the area under the sedimentation curve, with more significant sedimentation being indicated by a smaller AUC.
General Cell Culture
Dulbecco’s modified phosphate-buffered saline, media, and dissociation reagents were purchased from Life Technologies. CorningBrand cell culture consumables (flasks, plates, etc.) and sera were purchased from VWR Scientific. HeLa cells (ATCC CCL-2) and KB cells (ATCC CCL-17) were purchased from the American Type Culture Collection (ATCC, Manassas, VA, USA) and cultured in phenol red-free minimum essential media (MEM) supplemented with 10% fetal bovine serum (FBS). Prior to all experiments, cells were plated and allowed to incubate for 24 h before dosing. Cells were harvested with 0.25% TrypLE for 5 min at 37 °C in a 5.0% CO2 incubator. For sterilization, all Gd(III)-labeled molecules were filtered with 0.2 μm sterile filters prior to concentration determination and storage at 4 °C. GO was used as prepared without further sterilization. Literature reports suggest that GO in water is inherently bactericidal.62−64 Cells were grown in a humidified incubator operating at 37 °C and 5.0% CO2.
Guava ViaCount Assay for Cell Counting
Cell counting was conducted using a Guava EasyCyte mini personal cell analyzer (EMD Millipore, Billerica, MA, USA). After cell harvesting, an aliquot (50 μL) of the cell suspensions was mixed with Guava ViaCount reagent (150 μL) and allowed to stain at room temperature for at least 5 min. The dilution factor of 4 was determined based upon optimum machine performance (20–150 cells/μL). After vortexing for 10 s, stained cells were counted using a Guava EasyCyte mini personal cell analyzer using the ViaCount software module. For each sample, 1000 events were acquired. Gating of live/dead and cell/debris classifications was performed manually by the operator. Instrument reproducibility was assessed biweekly using GuavaCheck beads and following the manufacturer’s suggested protocol using the Daily Check software module.
Cellular Delivery Studies
Cellular delivery studies were performed with HeLa and KB cells. HeLa and KB were plated at a cell density of approximately 25 000 and 50 000 cells per well, respectively, in a 24-well plate as counted by a hemocytometer. Stock solutions of 1–15 (1 mM), 150 nm GO (100 μg/mL), and 1500 nm GO (100 μg/mL) were prepared using sterile Milli-Q water. Prior to dosing, 80 μL (8.0 ng) of each GO (150 and 1500 nm) and 80 μL (80 nmol) of each Gd(III)-labeled molecule (1–15) were mixed and allowed to adsorb for at least 15 min. Gd(III)–GO solutions of 150 μL were added to 250 μL of media to give a final concentration of 188 μM Gd and 18.8 μg/mL GO. Cells were incubated with the mixture of Gd(III)-labeled molecules and GO for 24 h. To harvest, cells were rinsed in-plate three times with 500 μL of PBS and trypsinized using 100 μL of 0.25% TrypLE. Following trypsin treatment, 150 μL of media was added to each well and mixed by a pipet to ensure that all cells were lifted into suspension. A 50 μL portion of the cell suspension was used for cell counting, and 150 μL was used for Gd content analysis via ICP-MS.
For studies investigating zero adsorption time, 75 μL of GO was added to 250 μL of media, followed by the addition of 75 μL of the Gd(III)-labeled molecule. The mixture was left undisturbed for 15 min before being added to the cells. The rest of the study was performed following the procedures as already described.
To examine concentration-dependent delivery by GO, the concentration and ratio of Magnevist/150 nm GO were varied. Prior to dosing, stock solutions of 150 nm GO (107, 80, 53, 27, 13, and 0 μg/mL) and Magnevist (186.7, 93.3, 46.7, and 23.3 mM) were prepared. An 80 μL amount of each concentration of GO and 80 μL of each concentration of Magnevist were mixed and allowed to adsorb for at least 15 min before adding to 250 μL of media, creating a total of 24 separate conditions. The final concentrations of GO were 20, 15, 10, 5, 2.5, and 0 μg/mL; the final concentrations of Magnevist were 35, 17.5, 8.8, and 4.4 mM. All other procedures were performed as already described.
Statistical and Error Analysis
Simple and multiple linear regression were performed using IBM SPSS Statistics software (ver. 19, IBM, New York, NY, USA). The r2 reported are adjusted r2 that take into account the number of explanatory variables in the model so that comparisons across different models are valid. Coefficients of variation (%CV) were calculated by taking the ratio of the standard deviation to the mean. For quantities that were calculated from several different raw measurements (e.g., adsorption and fold delivery enhancement), the errors were propagated according to the arithmetic operations performed. Where applicable, Table S5 lists the number of replicates and the %CV of each experiment.
Cell MR Imaging
HeLa cells were labeled by Magnevist with and without 150 nm GO co-incubation in six-well plates. Two plates seeded at 300 000 cells per well were needed to produce a sufficient number of cells for imaging. For the condition of GO co-incubation, 4500 μL of a Magnevist–GO mixture was prepared at a concentration of 93.3 mM Magnevist and 27 μg/mL GO. The mixture was allowed to adsorb for at least 15 min. Then 375 μL of the Magnevist–GO mixture was added to 625 μL of media in each well to reach a final concentration of 35 mM Magnevist and 10 μg/mL GO. The cells were incubated with the mixture for 24 h. To harvest, cells were rinsed in-plate three times with 3000 μL of PBS and trypsinized using 400 μL of 0.25% TrypLE. After 5 min of incubation at 37 °C, 600 μL of media was added to each well and mixed by a pipet to ensure that all cells were lifted into suspension. After combining all the wells into a 12 mL cell suspension, three aliquots of 25 μL each were obtained for cell counting by Guava. A 175 μL amount of Guava ViaCount reagent was used for dilution. Additionally, 200 μL of the cell suspension was transferred to a 1.5 mL microcentrifuge tube, centrifuged at 1000 rpm for 5 min (Thermo Scientific, model Legend Micro 21R), and resuspended in 200 μL of media to wash the cells. From the washed cell suspension, two aliquots of 25 μL each were used for cell counting by Guava and two aliquots of 25 μL each were used for Gd content analysis by ICP-MS. For the condition without GO co-incubation, the same procedures were followed except GO was replaced by Milli-Q water.
To create the cellular phantoms in agarose, 1% media/agarose was prepared by mixing media and 2% low-melting-point agarose (Life Technologies) in equal parts. At 7 T, the media/agarose has a T1 of 2952 ± 152 ms and a T2 of 96 ± 1 ms. In a 4 mL 15 × 45 mm glass vial, 2 mL of media/agarose was gelled at room temperature around a 5 mm o.d. NMR tube that was later removed to create a cylindrical bore. To fill the bore, the suspension of labeled cells was centrifuged at 1000 rpm for 5 min. After removing the supernatant, the cell pellet was resuspended in media/agarose and further diluted to densities of 10 000, 5000, 2000, 500, and 100 cells/μL. A 300 μL portion of each cell suspension was used to fill the bores in the 4 mL vials. After filling, the vials were cooled to 4 °C for 20 min to solidify the suspension. Approximately 3 mL of media was added on top of the media/agarose to completely fill the vial.
T1- and T2-weighted imaging were performed on a Bruker PharmaScan 7.05 T imaging spectrometer fitted with shielded gradient coils and an RF RES 300 1H 089/023 quadrature transceiver volume coil at 25 °C (Bruker BioSpin, Billerica, MA, USA). Imaging was performed using a rapid acquisition with refocused echoes (RARE) pulse sequence. For T1-weighted imaging, the imaging parameters were TR = 200 ms, TE = 11.7 ms, NEX = 1, FOV = 21 × 21 mm2, slice thickness = 2 mm, and matrix size = 256 × 256. For T2-weighted imaging, the imaging parameters were TR = 5000 ms, TE = 100 ms, NEX = 1, FOV = 15 × 15 mm2, slice thickness = 2 mm, and matrix size = 256 × 256. The signal intensities of the acquired images were normalized such that the blank media/agarose has the same intensity across all images. Image processing was performed using ImageJ (NIH, Bethesda, MD, USA). T1- and T2-weighted images were processed separately.
Acknowledgments
We gratefully acknowledge support by NIH Grants R01EB014806 and R01EB005866, the National Cancer Institute Center for Cancer Nanotechnology Excellence Initiative at Northwestern University Award No. U54CA151880, and a Cooperative Agreement between the National Science Foundation and the Environmental Protection Agency (DBI-1266377). The authors thank the Integrated Molecular Structure Education and Research Center (IMSERC), the Quantitative Bioelemental Imaging Center (QBIC), and the NUANCE Center at Northwestern University. The NUANCE Center has received support from the MRSEC (NSF DMR-1121262), NSEC (NSF EEC-0118025/003), State of Illinois, and Northwestern University. The Northwestern University Center for Advanced Molecular Imaging was supported by NCI CCSG P30 CA060553 awarded to the Robert H. Lurie Comprehensive Cancer Center. The 7 T Bruker PharmaScan system was purchased with the support of NCRR 1S10RR025624-01.
Supporting Information Available
AFM, Raman, and XPS characterizations of GO, adsorption as a function of chemical variables, comparison of GO sedimentation in media and in water, multiple linear regression analysis, additional adsorption time studies, GO delivery in KB cells, assessment of cell study variability and performance as a function procedural parameters, additional cytotoxicity evaluations, and alternative adsorption measurement. This material is available free of charge via the Internet at http://pubs.acs.org.
The authors declare no competing financial interest.
Funding Statement
National Institutes of Health, United States
Supplementary Material
References
- Gao W.; Alemany L. B.; Ci L.; Ajayan P. M. New Insights into the Structure and Reduction of Graphite Oxide. Nat. Chem. 2009, 1, 403–408. [DOI] [PubMed] [Google Scholar]
- Dreyer D. R.; Park S.; Bielawski C. W.; Ruoff R. S. The Chemistry of Graphene Oxide. Chem. Soc. Rev. 2010, 39, 228–240. [DOI] [PubMed] [Google Scholar]
- Sanchez V. C.; Jachak A.; Hurt R. H.; Kane A. B. Biological Interactions of Graphene-Family Nanomaterials: An Interdisciplinary Review. Chem. Res. Toxicol. 2011, 25, 15–34. [DOI] [PMC free article] [PubMed] [Google Scholar]
- Makharza S.; Cirillo G.; Bachmatiuk A.; Ibrahim I.; Ioannides N.; Trzebicka B.; Hampel S.; Rümmeli M. H. Graphene Oxide-Based Drug Delivery Vehicles: Functionalization, Characterization, and Cytotoxicity Evaluation. J. Nanopart. Res. 2013, 15, 1–26. [Google Scholar]
- Georgakilas V.; Otyepka M.; Bourlinos A. B.; Chandra V.; Kim N.; Kemp K. C.; Hobza P.; Zboril R.; Kim K. S. Functionalization of Graphene: Covalent and Non-Covalent Approaches, Derivatives and Applications. Chem. Rev. 2012, 112, 6156–6214. [DOI] [PubMed] [Google Scholar]
- Novoselov K.; Fal V.; Colombo L.; Gellert P.; Schwab M.; Kim K. A Roadmap for Graphene. Nature 2012, 490, 192–200. [DOI] [PubMed] [Google Scholar]
- Sheng L.; Ren J.; Miao Y.; Wang J.; Wang E. Pvp-Coated Graphene Oxide for Selective Determination of Ochratoxin a via Quenching Fluorescence of Free Aptamer. Biosens. Bioelectron. 2011, 26, 3494–3499. [DOI] [PubMed] [Google Scholar]
- Liu Z.; Robinson J. T.; Sun X.; Dai H. PEGylated Nanographene Oxide for Delivery of Water-Insoluble Cancer Drugs. J. Am. Chem. Soc. 2008, 130, 10876–10877. [DOI] [PMC free article] [PubMed] [Google Scholar]
- Rana V. K.; Choi M. C.; Kong J. Y.; Kim G. Y.; Kim M. J.; Kim S. H.; Mishra S.; Singh R. P.; Ha C. S. Synthesis and Drug-Delivery Behavior of Chitosan-Functionalized Graphene Oxide Hybrid Nanosheets. Macromol. Mater. Eng. 2011, 296, 131–140. [Google Scholar]
- Cao Y.; Yang T.; Feng J.; Wu P. Decoration of Graphene Oxide Sheets with Luminescent Rare-Earth Complexes. Carbon 2011, 49, 1502–1504. [Google Scholar]
- Liu J.; Fu S.; Yuan B.; Li Y.; Deng Z. Toward a Universal “Adhesive Nanosheet” for the Assembly of Multiple Nanoparticles Based on a Protein-Induced Reduction/Decoration of Graphene Oxide. J. Am. Chem. Soc. 2010, 132, 7279–7281. [DOI] [PubMed] [Google Scholar]
- Pandey H.; Parashar V.; Parashar R.; Prakash R.; Ramteke P. W.; Pandey A. C. Controlled Drug Release Characteristics and Enhanced Antibacterial Effect of Graphene Nanosheets Containing Gentamicin Sulfate. Nanoscale 2011, 3, 4104–4108. [DOI] [PubMed] [Google Scholar]
- Zhou L.; Wang W.; Tang J.; Zhou J. H.; Jiang H. J.; Shen J. Graphene Oxide Noncovalent Photosensitizer and Its Anticancer Activity in Vitro. Chem.–Eur. J. 2011, 17, 12084–12091. [DOI] [PubMed] [Google Scholar]
- Zhang M.; Yin B.-C.; Wang X.-F.; Ye B.-C. Interaction of Peptides with Graphene Oxide and Its Application for Real-Time Monitoring of Protease Activity. Chem. Commun. 2011, 47, 2399–2401. [DOI] [PubMed] [Google Scholar]
- Shen H.; Liu M.; He H.; Zhang L.; Huang J.; Chong Y.; Dai J.; Zhang Z. PEGylated Graphene Oxide-Mediated Protein Delivery for Cell Function Regulation. ACS Appl. Mater. Interfaces 2012, 4, 6317–6323. [DOI] [PubMed] [Google Scholar]
- Sun X.; Liu Z.; Welsher K.; Robinson J. T.; Goodwin A.; Zaric S.; Dai H. Nano-Graphene Oxide for Cellular Imaging and Drug Delivery. Nano Res. 2008, 1, 203–212. [DOI] [PMC free article] [PubMed] [Google Scholar]
- Yang X.; Zhang X.; Liu Z.; Ma Y.; Huang Y.; Chen Y. High-Efficiency Loading and Controlled Release of Doxorubicin Hydrochloride on Graphene Oxide. J. Phys. Chem. C 2008, 112, 17554–17558. [Google Scholar]
- Zhang L.; Xia J.; Zhao Q.; Liu L.; Zhang Z. Functional Graphene Oxide as a Nanocarrier for Controlled Loading and Targeted Delivery of Mixed Anticancer Drugs. Small 2010, 6, 537–544. [DOI] [PubMed] [Google Scholar]
- Yang X.; Wang Y.; Huang X.; Ma Y.; Huang Y.; Yang R.; Duan H.; Chen Y. Multi-Functionalized Graphene Oxide Based Anticancer Drug-Carrier with Dual-Targeting Function and pH-Sensitivity. J. Mater. Chem. 2011, 21, 3448–3454. [Google Scholar]
- Depan D.; Shah J.; Misra R. Controlled Release of Drug from Folate-Decorated and Graphene Mediated Drug Delivery System: Synthesis, Loading Efficiency, and Drug Release Response. Mater. Sci. Eng., C 2011, 31, 1305–1312. [Google Scholar]
- Yang Y.; Zhang Y. M.; Chen Y.; Zhao D.; Chen J. T.; Liu Y. Construction of a Graphene Oxide Based Noncovalent Multiple Nanosupramolecular Assembly as a Scaffold for Drug Delivery. Chem.—Eur. J. 2012, 18, 4208–4215. [DOI] [PubMed] [Google Scholar]
- Shen A. J.; Li D. L.; Cai X. J.; Dong C. Y.; Dong H. Q.; Wen H. Y.; Dai G. H.; Wang P. J.; Li Y. Y. Multifunctional Nanocomposite Based on Graphene Oxide for in Vitro Hepatocarcinoma Diagnosis and Treatment. J. Biomed. Mater. Res., Part A 2012, 100, 2499–2506. [DOI] [PubMed] [Google Scholar]
- Wang Y.; Li Z.; Hu D.; Lin C.-T.; Li J.; Lin Y. Aptamer/Graphene Oxide Nanocomplex for in Situ Molecular Probing in Living Cells. J. Am. Chem. Soc. 2010, 132, 9274–9276. [DOI] [PubMed] [Google Scholar]
- Lu C. H.; Yang H. H.; Zhu C. L.; Chen X.; Chen G. N. A Graphene Platform for Sensing Biomolecules. Angew. Chem., Int. Ed. 2009, 48, 4785–4787. [DOI] [PubMed] [Google Scholar]
- Lu C.-H.; Zhu C.-L.; Li J.; Liu J.-J.; Chen X.; Yang H.-H. Using Graphene to Protect DNA from Cleavage during Cellular Delivery. Chem. Commun. 2010, 46, 3116–3118. [DOI] [PubMed] [Google Scholar]
- Xu Y.; Wu Q.; Sun Y.; Bai H.; Shi G. Three-Dimensional Self-Assembly of Graphene Oxide and DNA into Multifunctional Hydrogels. ACS Nano 2010, 4, 7358–7362. [DOI] [PubMed] [Google Scholar]
- Wu M.; Kempaiah R.; Huang P.-J. J.; Maheshwari V.; Liu J. Adsorption and Desorption of DNA on Graphene Oxide Studied by Fluorescently Labeled Oligonucleotides. Langmuir 2011, 27, 2731–2738. [DOI] [PubMed] [Google Scholar]
- Gonçalves G.; Vila M.; Portolés M.-T.; Vallet-Regi M.; Gracio J.; Marques P. A. A. Nano-Graphene Oxide: A Potential Multifunctional Platform for Cancer Therapy. Adv. Healthcare Mater. 2013, 2, 1072–1090. [DOI] [PubMed] [Google Scholar]
- Saikia N.; Deka R. C. Ab Initio Study on the Noncovalent Adsorption of Camptothecin Anticancer Drug onto Graphene, Defect Modified Graphene and Graphene Oxide. J. Comput.-Aided Mol. Des. 2013, 27, 807–821. [DOI] [PubMed] [Google Scholar]
- Choi E.-Y.; Han T. H.; Hong J.; Kim J. E.; Lee S. H.; Kim H. W.; Kim S. O. Noncovalent Functionalization of Graphene with End-Functional Polymers. J. Mater. Chem. 2010, 20, 1907–1912. [Google Scholar]
- Sun Y.; Wilson S. R.; Schuster D. I. High Dissolution and Strong Light Emission of Carbon Nanotubes in Aromatic Amine Solvents. J. Am. Chem. Soc. 2001, 123, 5348–5349. [DOI] [PubMed] [Google Scholar]
- Hong B. J.; Compton O. C.; An Z.; Eryazici I.; Nguyen S. T. Successful Stabilization of Graphene Oxide in Electrolyte Solutions: Enhancement of Biofunctionalization and Cellular Uptake. ACS Nano 2011, 6, 63–73. [DOI] [PMC free article] [PubMed] [Google Scholar]
- Cho E. C.; Zhang Q.; Xia Y. The Effect of Sedimentation and Diffusion on Cellular Uptake of Gold Nanoparticles. Nat. Nanotechnol. 2011, 6, 385–391. [DOI] [PMC free article] [PubMed] [Google Scholar]
- Yue H.; Wei W.; Yue Z.; Wang B.; Luo N.; Gao Y.; Ma D.; Ma G.; Su Z. The Role of the Lateral Dimension of Graphene Oxide in the Regulation of Cellular Responses. Biomaterials 2012, 33, 4013–4021. [DOI] [PubMed] [Google Scholar]
- Li Y.; Yuan H.; von dem Bussche A.; Creighton M.; Hurt R. H.; Kane A. B.; Gao H. Graphene Microsheets Enter Cells through Spontaneous Membrane Penetration at Edge Asperities and Corner Sites. Proc. Natl. Acad. Sci. U.S.A. 2013, 110, 12295–12300. [DOI] [PMC free article] [PubMed] [Google Scholar]
- Tu Y.; Lv M.; Xiu P.; Huynh T.; Zhang M.; Castelli M.; Liu Z.; Huang Q.; Fan C.; Fang H. Destructive Extraction of Phospholipids from Escherichia Coli Membranes by Graphene Nanosheets. Nat. Nanotechnol. 2013, 8, 594–601. [DOI] [PubMed] [Google Scholar]
- Hung A. H.; Duch M. C.; Parigi G.; Rotz M. W.; Manus L. M.; Mastarone D. J.; Dam K. T.; Gits C. C.; MacRenaris K. W.; Luchinat C.; et al. Mechanisms of Gadographene-Mediated Proton Spin Relaxation. J. Phys. Chem. C 2013, 117, 16263–16273. [DOI] [PMC free article] [PubMed] [Google Scholar]
- Zhang M.; Cao Y.; Chong Y.; Ma Y.; Zhang H.; Deng Z.; Hu C.; Zhang Z. A Graphene Oxide Based Theranostic Platform for T1-Weighted Magnetic Resonance Imaging and Drug Delivery. ACS Appl. Mater. Interfaces 2013, 5, 13325–13332. [DOI] [PubMed] [Google Scholar]
- Hu W.; Peng C.; Lv M.; Li X.; Zhang Y.; Chen N.; Fan C.; Huang Q. Protein Corona-Mediated Mitigation of Cytotoxicity of Graphene Oxide. ACS Nano 2011, 5, 3693–3700. [DOI] [PubMed] [Google Scholar]
- Caravan P.; Ellison J. J.; McMurry T. J.; Lauffer R. B. Gadolinium (III) Chelates as MRI Contrast Agents: Structure, Dynamics, and Applications. Chem. Rev. 1999, 99, 2293–2352. [DOI] [PubMed] [Google Scholar]
- Sherry A. D.; Caravan P.; Lenkinski R. E. Primer on Gadolinium Chemistry. J. Magn. Reson. Imaging 2009, 30, 1240–1248. [DOI] [PMC free article] [PubMed] [Google Scholar]
- Gianolio E.; Stefania R.; Di Gregorio E.; Aime S. MRI Paramagnetic Probes for Cellular Labeling. Eur. J. Inorg. Chem. 2012, 2012, 1934–1944. [Google Scholar]
- Crich S. G.; Biancone L.; Cantaluppi V.; Duò D.; Esposito G.; Russo S.; Camussi G.; Aime S. Improved Route for the Visualization of Stem Cells Labeled with a Gd-/Eu-Chelate as Dual (MRI and Fluorescence) Agent. Magn. Reson. Med. 2004, 51, 938–944. [DOI] [PubMed] [Google Scholar]
- Hsiao J. K.; Tsai C. P.; Chung T. H.; Hung Y.; Yao M.; Liu H. M.; Mou C. Y.; Yang C. S.; Chen Y. C.; Huang D. M. Mesoporous Silica Nanoparticles as a Delivery System of Gadolinium for Effective Human Stem Cell Tracking. Small 2008, 4, 1445–1452. [DOI] [PubMed] [Google Scholar]
- Aime S.; Castelli D. D.; Lawson D.; Terreno E. Gd-Loaded Liposomes as T1, Susceptibility, and Cest Agents, All in One. J. Am. Chem. Soc. 2007, 129, 2430–2431. [DOI] [PubMed] [Google Scholar]
- Garimella P. D.; Datta A.; Romanini D. W.; Raymond K. N.; Francis M. B. Multivalent, High-Relaxivity MRI Contrast Agents Using Rigid Cysteine-Reactive Gadolinium Complexes. J. Am. Chem. Soc. 2011, 133, 14704–14709. [DOI] [PMC free article] [PubMed] [Google Scholar]
- Song Y.; Xu X.; MacRenaris K. W.; Zhang X. Q.; Mirkin C. A.; Meade T. J. Multimodal Gadolinium-Enriched DNA–Gold Nanoparticle Conjugates for Cellular Imaging. Angew. Chem., Int. Ed. 2009, 48, 9143–9147. [DOI] [PMC free article] [PubMed] [Google Scholar]
- Manus L. M.; Mastarone D. J.; Waters E. A.; Zhang X.-Q.; Schultz-Sikma E. A.; MacRenaris K. W.; Ho D.; Meade T. J. Gd (III)-Nanodiamond Conjugates for MRI Contrast Enhancement. Nano Lett. 2009, 10, 484–489. [DOI] [PMC free article] [PubMed] [Google Scholar]
- Endres P. J.; Paunesku T.; Vogt S.; Meade T. J.; Woloschak G. E. DNA-TiO2 Nanoconjugates Labeled with Magnetic Resonance Contrast Agents. J. Am. Chem. Soc. 2007, 129, 15760–15761. [DOI] [PubMed] [Google Scholar]
- Lee S. M.; Song Y.; Hong B. J.; MacRenaris K. W.; Mastarone D. J.; O’Halloran T. V.; Meade T. J.; Nguyen S. T. Modular Polymer-Caged Nanobins as a Theranostic Platform with Enhanced Magnetic Resonance Relaxivity and pH-Responsive Drug Release. Angew. Chem., Int. Ed. 2010, 49, 9960–9964. [DOI] [PMC free article] [PubMed] [Google Scholar]
- Bryant L. H.; Brechbiel M. W.; Wu C.; Bulte J. W.; Herynek V.; Frank J. A. Synthesis and Relaxometry of High-Generation (G = 5, 7, 9, and 10) Pamam Dendrimer-Dota-Gadolinium Chelates. J. Magn. Reson. Imaging 1999, 9, 348–352. [DOI] [PubMed] [Google Scholar]
- Song Y.; Kohlmeir E. K.; Meade T. J. Synthesis of Multimeric MR Contrast Agents for Cellular Imaging. J. Am. Chem. Soc. 2008, 130, 6662–6663. [DOI] [PMC free article] [PubMed] [Google Scholar]
- Allen M. J.; MacRenaris K. W.; Venkatasubramanian P.; Meade T. J. Cellular Delivery of MRI Contrast Agents. Chem. Biol. 2004, 11, 301–307. [DOI] [PubMed] [Google Scholar]
- Hong B. J.; Swindell E. P.; MacRenaris K. W.; Hankins P. L.; Chipre A. J.; Mastarone D. J.; Ahn R. W.; Meade T. J.; O’Halloran T. V.; Nguyen S. T. pH-Responsive Theranostic Polymer-Caged Nanobins: Enhanced Cytotoxicity and T1MRI Contrast by Her2 Targeting. Part. Part. Syst. Charact. 2013, 30, 770–774. [DOI] [PMC free article] [PubMed] [Google Scholar]
- Hassan A. A.; Chan B. T. Y.; Tran L. A.; Hartman K. B.; Ananta J. S.; Mackeyev Y.; Hu L.; Pautler R. G.; Wilson L. J.; Lee A. V. Serine-Derivatized Gadonanotubes as Magnetic Nanoprobes for Intracellular Labeling. Contrast Media Mol. Imaging 2010, 5, 34–38. [DOI] [PubMed] [Google Scholar]
- Zhao L.; Kroenke C.; Song J.; Piwnica-Worms D.; Ackerman J.; Neil J. Intracellular Water-Specific MR of Microbead-Adherent Cells: The Hela Cell Intracellular Water Exchange Lifetime. NMR Biomed. 2008, 21, 159–164. [DOI] [PMC free article] [PubMed] [Google Scholar]
- Caravan P. Strategies for Increasing the Sensitivity of Gadolinium Based MRI Contrast Agents. Chem. Soc. Rev. 2006, 35, 512–523. [DOI] [PubMed] [Google Scholar]
- Mastarone D. J.; Harrison V. S. R.; Eckermann A. L.; Parigi G.; Luchinat C.; Meade T. J. A Modular System for the Synthesis of Multiplexed Magnetic Resonance Probes. J. Am. Chem. Soc. 2011, 133, 5329–5337. [DOI] [PMC free article] [PubMed] [Google Scholar]
- Axelsson O.; Olsson A. Synthesis of Cyclen Derivatives. WO/2006/112723, 2006.
- Chowdhury I.; Duch M. C.; Mansukhani N. D.; Hersam M. C.; Bouchard D. Colloidal Properties and Stability of Graphene Oxide Nanomaterials in the Aquatic Environment. Environ. Sci. Technol. 2013, 47, 6288–6296. [DOI] [PubMed] [Google Scholar]
- Duch M. C.; Budinger G. S.; Liang Y. T.; Soberanes S.; Urich D.; Chiarella S. E.; Campochiaro L. A.; Gonzalez A.; Chandel N. S.; Hersam M. C. Minimizing Oxidation and Stable Nanoscale Dispersion Improves the Biocompatibility of Graphene in the Lung. Nano Lett. 2011, 11, 5201–5207. [DOI] [PMC free article] [PubMed] [Google Scholar]
- Liu S.; Zeng T. H.; Hofmann M.; Burcombe E.; Wei J.; Jiang R.; Kong J.; Chen Y. Antibacterial Activity of Graphite, Graphite Oxide, Graphene Oxide, and Reduced Graphene Oxide: Membrane and Oxidative Stress. ACS Nano 2011, 5, 6971–6980. [DOI] [PubMed] [Google Scholar]
- Hu W.; Peng C.; Luo W.; Lv M.; Li X.; Li D.; Huang Q.; Fan C. Graphene-Based Antibacterial Paper. ACS Nano 2010, 4, 4317–4323. [DOI] [PubMed] [Google Scholar]
- Akhavan O.; Ghaderi E. Toxicity of Graphene and Graphene Oxide Nanowalls against Bacteria. ACS Nano 2010, 4, 5731–5736. [DOI] [PubMed] [Google Scholar]
Associated Data
This section collects any data citations, data availability statements, or supplementary materials included in this article.