

Abstract
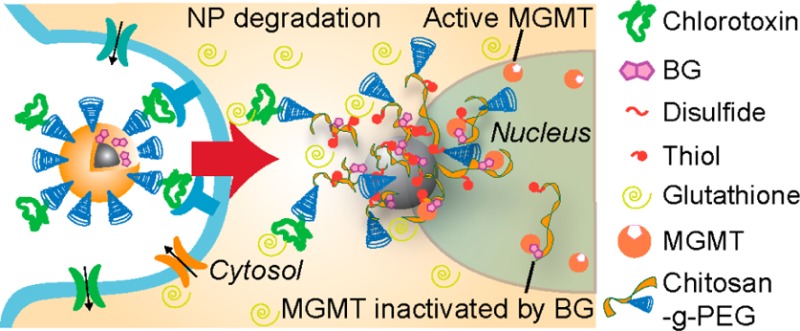
Resistance to temozolomide (TMZ) based chemotherapy in glioblastoma multiforme (GBM) has been attributed to the upregulation of the DNA repair protein O6-methylguanine-DNA methyltransferase (MGMT). Inhibition of MGMT using O6-benzylguanine (BG) has shown promise in these patients, but its clinical use is hindered by poor pharmacokinetics that leads to unacceptable toxicity. To improve BG biodistribution and efficacy, we developed superparamagnetic iron oxide nanoparticles (NP) for targeted convection-enhanced delivery (CED) of BG to GBM. The nanoparticles (NPCP-BG-CTX) consist of a magnetic core coated with a redox-responsive, cross-linked, biocompatible chitosan-PEG copolymer surface coating (NPCP). NPCP was modified through covalent attachment of BG and tumor targeting peptide chlorotoxin (CTX). Controlled, localized BG release was achieved under reductive intracellular conditions and NPCP-BG-CTX demonstrated proper trafficking of BG in human GBM cells in vitro. NPCP-BG-CTX treated cells showed a significant reduction in MGMT activity and the potentiation of TMZ toxicity. In vivo, CED of NPCP-BG-CTX produced an excellent volume of distribution (Vd) within the brain of mice bearing orthotopic human primary GBM xenografts. Significantly, concurrent treatment with NPCP-BG-CTX and TMZ showed a 3-fold increase in median overall survival in comparison to NPCP-CTX/TMZ treated and untreated animals. Furthermore, NPCP-BG-CTX mitigated the myelosuppression observed with free BG in wild-type mice when administered concurrently with TMZ. The combination of favorable physicochemical properties, tumor cell specific BG delivery, controlled BG release, and improved in vivo efficacy demonstrates the great potential of these NPs as a treatment option that could lead to improved clinical outcomes.
Keywords: iron oxide, drug delivery, glioblastoma multiforme, theranostic, nanomedicine
Multifunctional nanoparticles (NPs) that enable diagnostic imaging and therapeutic drug delivery are rapidly emerging as a powerful modality in cancer therapy.1−3 The ability to monitor drug delivery noninvasively in situ will provide clinicians with an unprecedented tool that may facilitate personalized therapeutic regimens for each patient’s tumor.4 Additionally, NPs are attractive as drug delivery vehicles because they can deliver potent doses of therapeutic agents to cancer cells with significantly improved specificity and reduced toxicities.5,6 These advantages are achieved through targeted delivery and release of chemotherapeutics specifically in tumor cells.2 Proper integration of these favorable attributes in a single nanoparticle formulation is expected to offer a solution for highly intractable cancers such as glioblastoma multiforme (GBM).
GBMs are malignant brain tumors that are among the most lethal cancers, striking 14 000 individuals in the U.S. each year.7 Therapy has long included surgery followed by conformal radiotherapy (RT). Clinical trials have documented that the inclusion of the DNA methylating agent temozolomide (TMZ) in the postoperative therapy of newly diagnosed GBMs has produced the first significant improvement in survival in the last 30 years.8 The clinical efficacy of TMZ reflects, in part, its ability to cross the blood–brain barrier (BBB). Clinical outcome, however, is not improved by TMZ in the majority of GBMs because of resistance mediated in large part by O6-methylguanine-DNA methyltransferase (MGMT), a DNA repair protein that removes the cytotoxic O6-methylguanine lesions produced by TMZ.9−11
In vitro studies suggest that GBM resistance to TMZ can be overcome by ablating MGMT activity with DNA repair inhibitors such as O6-benzylguanine (BG).12,13 BG serves as a pseudo-substrate for MGMT and irreversibly inactivates the DNA repair protein. However, clinical trials have shown that the inclusion of BG in TMZ treatment regimens reduces the maximum tolerated dose (MTD) of TMZ by 50%.14 The significant reduction in MTD is primarily caused by the poor pharmacokinetics of BG; BG poorly permeates across the BBB, is limited by a short blood half-life, and rapidly accumulates in clearance organs and bone marrow producing significant myelosuppression in combination with TMZ.14−16 Hence, prognosis remains dismal with only 2% of patients surviving 5 years. This necessitates the development of novel therapeutic agents and utilization of delivery methods that can circumvent resistance mediated by tumor biology (e.g., drug resistance due to DNA repair) and by normal physiological barriers (e.g., the BBB).
The inability of many systemically delivered therapeutic drugs to cross the BBB or to accumulate in the brain at therapeutic levels have led researchers to develop more direct delivery methods.17,18 Diffusion controlled delivery methods such as general intraneoplastic injection or the placement of drug loaded wafers in the resection cavity during brain surgery present some advantages, but are limited by poor volume of distribution (Vd) due to the diffusion limited delivery.19 In contrast, convection-enhanced delivery (CED) utilizes fluid convection by maintaining a pressure gradient during interstitial infusion to enhance simple diffusion, leading to better Vd.20 However, not all drugs are effectively delivered by CED. Small hydrophobic molecules in particular are subject to high rates of elimination by transport into cerebrospinal fluid or blood21 and do not distribute well.22 These limitations require the development of therapeutic agents engineered to take full advantage of CED.
We hypothesized that a multifunctional NP formulation carrying a targeting ligand specific to GBMs, loaded with a BG chemotherapeutic payload, and administered via CED represents a more effective and less toxic treatment strategy. Our aim was to reformulate BG in combination with a theranostic nanoparticle platform to improve its intracellular delivery to GBM cells while minimizing its localization to healthy tissue. Here we report the development of an NP formulation for BG delivery that contains a superparamagnetic iron oxide core coated with a redox responsive biopolymer shell of PEG and chitosan conjugated to a tumor-targeting peptide CTX.23,24 NP stability, in vitro BG intracellular trafficking, reduction of MGMT activity, potentiation of TMZ cytotoxicity in GBM cells, in vivo biodistribution, and toxicity were evaluated and compared against free BG. Furthermore, the efficacy of CED NPCP-BG-CTX was evaluated in orthotopic human primary GBM6 xenograft tumors. Importantly, this new BG loaded NP formulation could be integrated into the existing therapeutic protocol for GBM management and offers the potential to significantly improve the prognosis of GBM patients.
Results and Discussion
Formulation and Characterization of Nanoparticles
Figure 1 shows the synthesis of chitosan-PEG (CP) copolymer coated nanoparticles (NPCP), cross-linked and functionalized with BG (NPCP-BG) and CTX (NPCP-BG-CTX). NPCP consists of a 7.5 nm iron oxide core coated with CP (Figure 1a).25 It should be noted that the carrier’s core material, iron oxide, is biocompatible and biodegradable, and enables the monitoring of drug trafficking and delivery by magnetic resonance imaging (MRI) when administrated both in vitro and in vivo. Reactive sulfhydryl groups were then introduced to the CP shell by reaction of 2-iminothiolane to amine groups of chitosan (Figure 1b). The sulfhydryl groups then oxidized and formed disulfide bridges producing a redox sensitive cross-linked polymer shell. A 5:1 weight ratio of 2-iminothiolane to iron was determined to be optimal for stability of NPCP and to ensure an adequate number of amines remained for further NP modifications (Supporting Information Figure 1). BG was then activated with N-bromosuccinimide (BG-Br) rendering it amine reactive (Figure 1c). Bromination of BG was confirmed by tandem liquid chromatography–mass spectrometry (LC–MS) (Supporting Information Figure 2a). NPCP was then reacted with the brominated BG, followed by addition of CTX and Cy5.5 to produce NPCP-BG-CTX (Figure 1d). The BG loaded nanoparticles were readily soluble in PBS and cell culture media without the need of excipients.
Figure 1.

Synthesis of NPCP-BG-CTX. (a) Illustration of fully functionalized NPCP-BG-CTX. (b) Cross-linking of NPCP coating through intracellular reducible disulfide linkages. (c) Activation of BG by bromination and subsequent reaction with amines on the chitosan backbone. (d) Modification of NPCP with BG and CTX to produce NPCP-BG-CTX.
Table 1 summarizes the key physicochemical properties of NPCP-BG-CTX. The hydrodynamic size and zeta potential of nanoparticles can drastically influence their in vivo functionality, clearance, and overall safety.3 The intensity based hydrodynamic size of NPCP-BG-CTX in 20 mM HEPES, pH 7.4, were measured by dynamic light scattering (DLS) (Supporting Information Figure 2b). The Z-average size of NPCP-BG-CTX was 76 nm in HEPES and remained stable in biological fluid (Dulbecco’s modfied Eagle’s medium (DMEM) with 10% FBS) for over 10 days (Supporting Information Figure 2c). Notably, the hydrodynamic size distributions for the NP remained appropriate for in vivo navigation and evasion of rapid clearance by the reticuloendothelial system (5 nm < d < 200 nm)26 and for CED (<100 nm).21 Additionally, a strong positive surface charge can lead to nonspecific interactions with negatively charged cell membranes and reduced Vd,27 whereas a strong negative surface charge can lead to nonspecific interactions with the positively charged extracellular matrix.28 The average zeta potential of NPCP-BG-CTX was measured to be near neutral at 4 ± 7.4 mV (Supporting Information Figure 2d). NP core size was determined to be 7.5 ± 1.3 nm (Supporting Information Figure 3). Using UV/vis spectroscopy, we estimated the number of BG molecules per NP to be 150. Furthermore, with the use of a gel electrophoresis assay, the number of CTX peptide per NP was found to be approximately three peptides per NP.
Table 1. Primary Physicochemical Properties of NPCP-BG-CTX.
| core size (nm) | hydrodynamic size (nm) | poly dispersion index | zeta potential (mV) | BG molecules/NP | CTX molecules/NP |
|---|---|---|---|---|---|
| 7.5 ± 1.3 | 76 ± 4 | 0.16 | 4 ± 7.4 | 150 ± 14 | 3 ± 1 |
A challenge in developing drug carrier NP formulations is ensuring rapid and effective intracellular release of drugs in target cells while minimizing release in the blood or extracellular matrix. Several strategies have been investigated to create NP formulations that selectively respond to environmental stimuli such as temperature, pH, ionic strength, redox potential, and electrical or magnetic fields.29−32 Among them, redox responsive NPs are most attractive as cells regulate the reducing potential in their environment both intracellularly and extracellularly through the expression and secretion of reducing enzymes such as glutathione.33 These enzymes are known to be present in the cytoplasm at 1000-fold higher levels than those found in the blood.
To determine the redox responsive properties of our NPs, NPCP-BG-CTX was incubated in solutions similar to blood conditions (BC environment, PBS pH 7.4) and intracellular conditions (IC environment, acetate buffer pH 5 and 100 mM glutathione) to examine drug release under reducing conditions likely encountered following NP tumor uptake and intracellular sequestration.30 Gel electrophoresis was used to monitor biodegradation of the polymer/BG/CTX conjugate (CP-BG-CTX) coating from the iron oxide core in response to BC and IC environments (Figure 2a). NPs and any bound polymer coating remained in the gel loading wells while unbound polymer freely moved down the gel lanes. On the basis of the intensity of the bands remaining in the loading wells, the IC environment resulted in more degradation of the CP-BG-CTX coating than the BC environment. CP-BG-CTX release was quantitatively monitored using a fluorescence assay where BG was fluorescently labeled with Alexa Fluor 488 (BG-AF488) and biodegradation of CP-(BG-AF488)-CTX from the iron oxide core was determined in BC and IC environments by collecting the filtrate at 0, 1, 8, and 24 h using centrifugal filters (Figure 2b). CP-(BG-AF488)-CTX was released rapidly under conditions mimicking intracellular environments reaching maximum CP-(BG-AF488)-CTX release at 1 h. However, under conditions mimicking blood, maximum CP-(BG-AF488)-CTX release was not achieved until 24 h. The significantly elevated CP-(BG-AF488)-CTX release under IC conditions demonstrates that controlled intracellular BG drug release can be achieved using this NP formulation.
Figure 2.
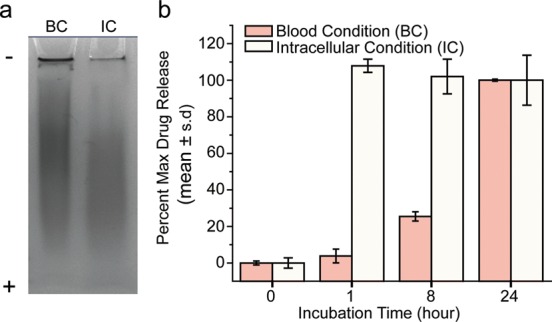
NPCP-BG-CTX drug release. (a) Coomassie blue stained polyacrylamide gel electrophoresis image of NPCP-BG-CTX incubated for 1 h under blood conditions (BC) and intracellular conditions (IC) showing pH and glutathione sensitive degradation of the CP-BG-CTX coating from NP. (b) Drug release profiles showing the pH and glutathione sensitive release of CP-(BG-AF488)-CTX from NPCP-(BG-AF488)-CTX. BC = pH 7.4 and no glutathione, and IC = pH 5.0 and 100 mM glutathione.
Internalization of NPCP-BG-CTX by Human GBM Cells in Vitro
To efficiently deliver BG in vivo, NPs must be equipped with ligands that bind to tumor cells with high specificity and avidity. CTX, a small peptide of scorpion venom that has been shown to bind to MMP234 and Annexin A235 on cell surfaces, has high specificity and avidity for GBM but not normal brain tissue.36,37 We have previously shown that CTX-conjugated NPs are efficiently taken up through endocytosis in rodent glioma cells.3,38 Unlike other ligands, which target only certain types of brain tumors, CTX targets the majority of brain tumors examined (74 out of 79).37,39 In addition, CTX facilitates BBB permeation via receptor-mediated transcytosis through vessel endothelial cells (Supporting Information Figure 4a-b).25
CTX targeting of the human GBM cell line SF767 was confirmed by flow cytometry (Supporting Information Figure 5). Visual confirmation of NP internalization and BG delivery was established by confocal microscopy. Images were obtained from SF767 cells treated with NPCP-AF647-CTX (NPs labeled with fluorophore), BG-AF647 (fluorophore labeled BG), and NPCP-(BG-AF647)-CTX (NPs carrying fluorophore labeled BG). In all images (Figure 3), cells were fixed after NP/BG treatments, and nuclei were stained with DAPI (blue) and membranes with WGA-555 (green). Treatments with these formulations were administered at a concentration of 50 μM of BG or its NP equivalence. In the top panel, NPCP-AF647-CTX (red, third column) can be visualized in the treated cells. The overlay images (fourth column) reveal that the NPCP-AF647-CTX formulation is bound to the SF767 cells. The middle panel shows CP-(BG-AF647)-CTX localized in the nucleus with NPCP-(BG-AF647)-CTX delivery. Similarly, the lower panels show free BG-AF647 localized in the nucleus. This observation suggests the proper release and trafficking of BG within cells.
Figure 3.

Confocal fluorescence images of SF767 cells treated with one of three treatment formulations: NPCP-AF647-CTX (fluorophore labeled NPs), NPCP-(BG-AF647)-CTX (NPs loaded with fluorophore labeled BG), and BG-AF647 (fluorophore labeled BG). Cells were imaged 24 h post treatment. Cell nuclei are shown in blue, cell membranes in green, and NPCP-AF647-CTX, CP-(BG-AF647)-CTX or BG-AF647 in red. The scale bar corresponds to 10 μm.
NPCP-BG-CTX Inhibition of MGMT and Potentiation of TMZ Cytotoxicity in Human GBM Cells
MGMT is the sole repair activity that removes O6-methylguanine (O6-meG) adducts from DNA in human cells and plays an important role in GBM resistance to TMZ.40 Suppressing DNA repair activity is a promising strategy for improving TMZ-based therapies.41Figure 4a shows the effect of free BG and NPCP-BG-CTX treatments on MGMT activity in SF767 cells. In this experiment, MGMT activity was assayed in untreated cells, cells incubated with 10 μM free BG and NPCP-BG-CTX equivalent to 10 μM BG for 2 or 24 h. Untreated cells had an activity of 39 fmol/106 cells or ∼23 500 MGMT molecules/cell. All treatment conditions were normalized as a percent MGMT activity of untreated SF767 cells. Exposure to free BG for 2 h reduced the activity by ∼4.8-fold (∼21% of untreated activity) and exposure for 24 h reduced activity by ∼10.3-fold (∼9.7% of untreated activity). Importantly, incubation with NPCP-BG-CTX for 2 h also reduced MGMT activity ∼1.5-fold (∼67% of untreated activity), and achieved a greater than 5.4-fold (∼18.7% of untreated activity) reduction in activity 24 h after the initial exposure to NPCP-BG-CTX. Control NPs with no BG conjugated (NPCP-CTX) showed no reduction in MGMT activity at 2 and 24 h. These results demonstrate that NP-conjugated BG produces similar reduction of MGMT activity in a human GBM cell line as free BG after 24 h exposure.
Figure 4.
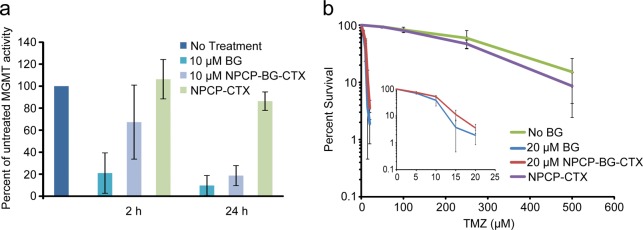
NPCP-BG-CTX inhibits MGMT and sensitizes GBM cells to TMZ. (a) Suppression of MGMT activity in SF767 cells treated with BG, NPCP-BG-CTX, or NPCP-CTX. Cells were harvested 2 and 24 h after inhibitor exposure and MGMT activity was determined in cleared supernatants of whole cell homogenates by quantitating transfer of radioactivity from DNA containing O6-[3H]methylguanine to protein.43 Data represent the results of cells treated with a single preparation of NPCP-BG-CTX and are representative of results observed using independent preparations of NPCP-BG-CTX. (b) Suppression of MGMT activity with NPCP-BG-CTX increases TMZ cell killing of the GBM line SF767. Survival of SF767 cells treated with TMZ alone (no BG) or exposed to 20 μM BG or NPCP-BG-CTX containing 20 μM BG for 24 h prior to 24 h exposure to TMZ was determined by a clonogenic colony-forming assay. The inset displayed at a finer scale reveals the comparable effect of BG and NPCP-BG-CTX on cell killing.
SF767 cells are noted for their pronounced resistance to TMZ (LD10 ∼640 μM) mediated in large part by MGMT.42 The effect of suppression of MGMT activity by NPCP-BG-CTX on TMZ-mediated reduction in clonogenic survival of SF767 is illustrated in Figure 4b. Cells were exposed to NPCP-BG-CTX equivalent to 20 μM free drug for 24 h followed by incubation with TMZ for 24 h in the presence of inhibitor. Controls were treated either with 20 μM free BG, NPCP-CTX or with an equivalent volume of DMSO. A linear regression analysis was performed on the linear portions of the survival curves to determine LD10. NPCP-BG-CTX reduced the resistance by ∼40-fold (LD10 15.7 ± 1.1 μM), a potentiation of cytotoxicity comparable to that produced by free BG (LD10 12.8 ± 1.6 μM). These results demonstrate that NPCP-BG-CTX mediated suppression of MGMT is accompanied by greater sensitivity to TMZ in human GBM cells.
CED and in Vivo Efficacy of NPCP-BG-CTX
To evaluate CED and combination therapy of NPCP-BG-CTX with TMZ in vivo, we used a clinically relevant primary GBM6 xenograft tumor model which expresses high levels of MGMT and have shown resistance to TMZ.44 CTX targeting of GBM6 cells was confirmed in vitro by flow cytometry (Supporting Information Figure 6). The use of primary cells is advantageous for drug screening, since prolonged tissue culture can lead to phenotypic changes including loss of amplified epidermal growth factor receptor45 and hypermethylation of DNA MGMT promoter46 in GBM cell lines, which can significantly affect tumor response to treatment. Primary GBM xenografts avoid these issues by serial transplantation in mouse flanks to preserve important genetic features of the primary cell.47 Thus, we established orthotopic human primary GBM xenografts using luciferase expressing GBM6 cells maintained as flank tumors in mice. Orthotopic brain tumor growth could then be monitored through Xenogen IVIS luminescent imaging.
Prior to treatment, NPs were suspended in 2.5% 400 MW PEG (w/w) and 2.5% dextrose (w/w), aliquoted at the predetermined treatment dose, and flash-frozen in liquid nitrogen. The addition of PEG and dextrose was to both stabilize the NP during freeze for storage and to increase viscosity, which has been shown to increase Vd of therapeutics when administered by CED.48,49 Before each NP treatment, NPs were quickly thawed and placed on ice until administered. NPCP-BG-CTX (5 μL, 15 μg BG/kg) and NPCP-CTX (5 μL, Fe concentration equivalent to NPCP-BG-CTX dosage) were administered via CED 24 h prior to TMZ treatment (66 mg TMZ/kg, via oral gavage). The 24 h NP pretreatment time point was selected based on in vitro MGMT inhibition results that showed maximum MGMT inhibition at 24 h. CED was performed using a stereotaxic frame to securely hold the mouse and Hamilton syringe. A new burr hole was produced at the same location as for the tumor implantation and the tip of the Hamilton syringe was placed at a depth of 3 mm (tumor implant location) prior to infusion of 5 μL of NPs at 1 μL/min.
MR imaging was utilized to evaluate the extent of NP delivery via CED. Figure 5 shows T2-weighted transverse and sagittal images of (a) mice brains bearing GBM6 tumor without NP treatment, as well as CED NP injected tumors at (b) t = 0 h, (c) t = 24 h, and (d) t = 48 h after NP treatment. Excellent NP distribution was observed at all three time points. The outer edge of the injected margin at t = 0 was somewhat blurred (Figure 5b), but became significantly well-defined at t = 24 h (Figure 5c). To further examine the brain parenchyma outside the tumor capsule, T2*-weighted images, which are highly sensitive to small quantities of NP, were acquired (Figure 5e). The red arrows in Figure 5e represent (at t = 0) the blurry outer NP margin, (at t = 24 h) the highly defined NP edge, and (at t = 48 h) the appearance of NPs in the process of elimination from the outer margin of the tumor. To best capture the behavior between 24 and 48 h, separate images were acquired with a short echo time (TE = 6 ms; Figure 5f). The short TE reduces the effects of NP contrast and better displays the removal of NP from the outer margin at 48 h post CED (Figure 5f). We used a multispin multiecho sequence to calculate the T2 value within this outer margin, in comparison to untreated tumor (Figure 5g). The quantitative results suggested that a significant quantity of NP remained within the outer tumor margin at 48 h (red ROI). Conceptually, the early extraction at 48 h of NP from the outer tumor margin corresponds well to the known presence of extensive tumor perfusion within this area. The persistence of NP within the small central region may thus correspond to the dysfunctional vascular and cytologic architecture of the necrotic core.
Figure 5.

MR evaluation of CED delivery of NPCP-BG-CTX. Transverse and sagittal T2-weighted images of a mouse brain (a) untreated, (b) immediately after CED, (c) 24 h after CED, and (d) 48 h after CED. (e) T2*-weighted images illustrating changes in NP contrast margins at 0 h (red arrow indicates diffuse NP contrast margin), 24 h (well-defined NP contrast margin), and 48 h (loss of NP from outer margin inward) post CED. (f) Quantitative T2-weighted images with short TE of an untreated animal, and 0, 24, and 48 h post CED of NPCP-BG-CTX. (g) T2 relaxation time differences between untreated and 48 h post CED of NPCP-BG-CTX for contralateral brain and tumor ROI indicated a significant quantity of NPCP-BG-CTX remained in the outer tumor margin 48 h after treatment. Bar color outlines correspond to ROI outlines in (f).
NPCP-BG-CTX localization was further examined through histological analysis on brain sections near the tumor margin. After MR imaging, fixed brains (10% formalin) were embedded in paraffin, sectioned, and stained with Prussian blue and hematoxylin and eosin (H&E) (Figure 6a,b). The Prussian blue staining revealed the presence of NPCP-BG-CTX well beyond the tumor boundary immediately after CED, but confined within the tumor at 48 h post CED. Figure 6c displays a model for the behavior that we visualize here; upon completion of CED, NPCP-BG-CTX diffused outward beyond the tumor boundary. By 24 and 48 h, NPCP-BG-CTX cleared from the healthy brain and remained only within the tumor boundary. Both MRI and histology results confirm the successful delivery and distribution of NPCP-BG-CTX throughout the tumor, validating CED as a promising mode of delivery for these NPs.
Figure 6.

NPCP-BG-CTX is preferentially retained in the tumor region. (a) Representative Prussian blue and (b) H&E stained subsequent tissue sections of brain at the tumor margin obtained from untreated or NPCP-BG-CTX treated animals immediately post CED or 48 h post CED. The scale bar corresponds to 100 μm. (c) Schematic illustration of time dependent changes of NP localization before and after CED.
In vivo efficacy of NPCP-BG-CTX in combination with TMZ was compared to control NPCP-CTX in combination with TMZ and animals that received no treatment. Treatments were administered twice weekly for 2 weeks (Figure 7a). Overall median survival was determined with the first treatment day as day 0 and a log rank statistical analysis of the Kaplan–Meier plot was performed (Figure 7b,c). Animals treated with NPCP-BG-CTX/TMZ showed a 3-fold increase in survival as compared to untreated animals with a median survival time of 9 days in comparison to 4 days for NPCP-CTX/TMZ, and 3 days for untreated animals. The log rank statistic for comparison between NPCP-BG-CTX/TMZ and untreated animals showed a statistical increase in survival probability for mice receiving NPCP-BG-CTX/TMZ (P = 0.0003). Importantly, the log rank statistic for survival probability comparison between NPCP-BG-CTX/TMZ and NPCP-CTX/TMZ showed a statistically significant difference (P = 0.009) between the groups. There was no statistical difference in survival probability between NPCP-CTX/TMZ treated and untreated animals (P = 0.7). These results indicate that the prolonged time of survival for NPCP-BG-CTX/TMZ treated animals was caused by the therapeutic effect of BG on the NP polymer surface and was not induced by local NP toxicity.
Figure 7.
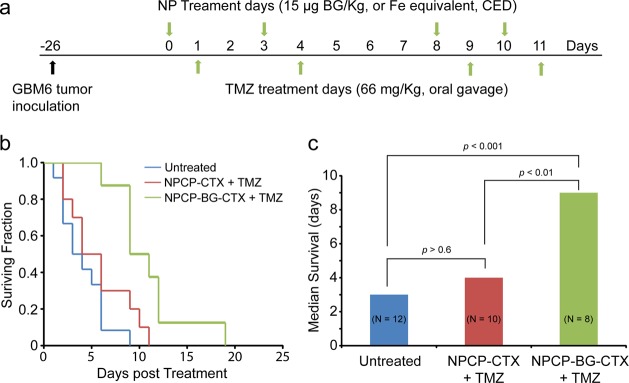
Increased survival by CED of NPCP-BG-CTX in combination with TMZ in an orthotopic GBM6 xenograft model. (a) Tumor inoculation and treatment time-line. NPs were administered 24 h prior to TMZ treatment. Treatments were performed twice weekly for 2 weeks. (b) Kaplan–Meier survival curve. (c) Median survival and log rank statistical comparison of the three treatment groups.
In the above experiments we demonstrated that a BG loaded NP formulation engineered with proper size and surface chemistry can be administered by CED to achieve excellent tumor coverage and increase median survival in an orthotopic primary GBM xenograft model. In addition to holding a potential role in the up-front treatment of malignant glioma, the clinical promise for CED agents extends to the adjunct treatment of recurrent tumors, and of those deemed inoperable due to deep location in the brain. Especially in the setting where reoperation or reirradiation ceases to provide clinical benefit, novel therapeutic technologies such as ours may play an important role in improving survival or providing symptomatic relief.50 We envision a single needle-based injection, or a stereotactically implanted microcatheter-based infusion, to provide a localized high concentration of our compound to the active site of such tumors. As we have shown with MRI and histology, NPCP-BG-CTX permeates outside the tumor margin immediately after delivery, but becomes rapidly confined to the tumor region, with the NP persisting within tumor for at least 48 h.
NPCP-BG-CTX Biodistribution and Pharmacological Evaluation
For assessment of plasma half-life, we used a reproducible, quantitative assay that utilized the NIRF dye, Cy5.5, which was incorporated into the nanoparticle (NPCP-BG-Cy5.5-CTX) as we previously reported.51 Mice were injected through the tail vein with 200 μL of 1 mg/mL NPCP-BG-Cy5.5-CTX (n = 3 for each time point) and blood was collected from mice at 1, 8, and 24, hours. Blood was centrifuged and the plasma was collected for analysis. The blood plasma was added to a 96 well clear bottom plate and scanned using an Odyssey scanner. Exponential decay analysis of the fluorescent signal from NPCP-BG-Cy5.5-CTX over time revealed an elimination half-life of 5 h (Figure 8a,b). This is significantly longer than the 1.2 h reported in literature for BG evaluated in rodent models.16
Figure 8.

Biodistribution and pharmacological evaluation of NPCP-BG-CTX. (a–d) Plasma and organ biodistribution profile of NPCP-BG-CTX in wild type mice. (a) Measured fluorescence intensity of nanoparticles in plasma. (b) Plasma half-life of NPCP-BG-CTX determined using fluorescence measurements. Each data point represents the mean fluorescence intensity integrated above the baseline. The curve indicates an exponential decay curve fit to the data (n = 3 mice per time point). (c) Fluorescence image of 12-μm sections of various organs 5 days post injection, obtained using the Odyssey imaging system. (Top row, from left to right: liver, spleen, and kidney. Bottom row from left to right: lung, heart, and brain.) The spectrum gradient bar corresponds to the relative fluorescence intensity unit photon/(s/cm2/sr) ×103. (d) Quantitative representation of the biodistribution of NPCP-BG-CTX. (e) Assessment of toxic effects of NPCP-BG-CTX on liver. AST and ALT levels of mice receiving NPCP-BG-CTX or PBS injection were measured 5 days after administration (mean ± standard deviation of the mean, n = 3 mice per treatment). (f and g) Evaluation of bone marrow toxicity in response to co-administration of BG and TMZ. (f) White blood cell counts obtained from wild-type mice 5 days post treatment with PBS, NPCP-BG-CTX/TMZ, or BG/TMZ. (g) Platelet counts obtained from wild-type mice 5 days post treatment with PBS, NPCP-BG-CTX/TMZ, or BG/TMZ.
The biodistribution of the mice receiving NPCP-BG-Cy5.5-CTX was determined by ex vivo NIRF signal quantification of excised tissues (brain, liver, spleen, kidney, heart and lung) (Figure 8c,d) as previously reported.51 Wild-type mice were chosen because of their intact immune system. Mice were injected (n = 3) through the tail vein with 200 μL of 1 mg/mL of NPCP-BG-Cy5.5-CTX. Whole organs were removed at 120 h after injection, frozen in OCT, and then sliced in 12 μm sections and mounted on glass slides. The slides were scanned on an Odyssey NIR scanner and images were obtained using a 700 nm channel (Figure 8c). The measured fluorescence intensities were then plotted to determine a biodistribution profile (Figure 8d). No marked NP accumulation was observed in brain, heart, and lung tissue. Conversely, significant accumulation of the NPCP-BG-Cy5.5-CTX was observed in clearance organs including liver, spleen, and kidney. These results are comparable in distribution profile to those reported for other iron oxide nanoparticle systems.52,53
Tissue specific toxicity was examined through histological analysis on various tissues (kidney, spleen, liver, and brain) of mice injected with NPCP-BG-CTX to identify any signs of acute toxicity. Tissue sections showed no evidence of toxicity, appearing similar to those observed in the tissues from PBS injected control animals (Supporting Information Figure 7). The spleen did not show any expansion of the white pulp or red pulp. No signs of hepatotoxicity such as hepatocyte distortion or degeneration and destruction of the vascular bed and sinusoidal structures were observed. The kidneys showed normal glomeruli and renal tubules and showed no signs of degenerative changes or desquamation in the epithelium lining the tubules.
Since the accumulation of nanoparticles in liver have been reported51 and shown with NPCP-BG-CTX, potential liver toxicity not apparent histologically was assessed by a hepatotoxicity assay. Serum aspartate aminotransferase (AST) and alanine aminotransferase (ALT) levels were determined in mice injected with NPCP-BG-CTX or PBS (Figure 8e). No significant elevation of AST and ALT levels was found in mice receiving NPCP-BG-CTX compared to control mice receiving PBS injection, which falls within the normal range for these mice,23 suggesting that NPs do not induce liver toxicity at the given dosage.
A major concern associated with combinational therapy of brain tumors through co-administration of BG and TMZ is dose-limiting, chemotherapy-induced bone marrow toxicity.14,54 In the clinic, chemotherapy induced myelosuppression is detected through blood work by the decrease in the number of white blood cells (neutropenia) and platelets (thrombocytopenia).55 To monitor whether co-administration of TMZ with NPCP-BG-CTX is more tolerable in mice than with BG, we evaluated the influence of each formulation on white blood cell (WBC) and platelet levels in peripheral blood (Figure 8f,g). Mice were injected with NPCP-BG-CTX at a BG dose of 6 mg/kg followed 2 h later by an injection of 66 mg/kg TMZ and sacrificed 5 days later. Mice receiving PBS and free BG (6 mg/kg) injections were also included as controls. Peripheral blood was collected through cardiac heart puncture. BG/TMZ produced almost complete knockdown of WBC and platelet levels indicating substantial neutropenia and thrombocytopenia. Importantly, NPCP-BG-CTX/TMZ produced significantly lower degrees of WBC and platelet suppression compared to BG/TMZ treatments indicating they do not accumulate in the bone marrow, as we have shown with a similar CTX-targeted nanoparticle.51
Combined, these findings suggest that NPCP-BG-CTX produced less myelosuppression and was more tolerable when combined with TMZ as compared to free BG. The decrease in myelosuppression was likely due to the favorable biodistribution of these NPs. We anticipate that NPCP-BG-CTX will be more tolerable than free BG when combined with TMZ and decrease the dose-limiting, chemotherapy-induced myelosuppression often observed in the clinic.
Conclusions
GBM targeted NPs carrying a BG payload were successfully prepared. These NPs had excellent solubility and physicochemical properties, and demonstrated a redox-responsive drug release profile. In vitro evaluation of NPCP-BG-CTX demonstrated proper release and trafficking of BG within human GBM cells. NPCP-BG-CTX treated human GBM cells showed significant reduction of MGMT activity similar to free BG treated cells. In addition, NPCP-BG-CTX mediated suppression of MGMT was accompanied by significantly greater sensitivity to TMZ in human GBM cells. Pharmacological evaluations showed there was no difference in liver toxicity between saline injected and NP injected mice indicating the innocuous toxicity profile of NPCP-BG-CTX. Co-treatment of wild-type mice with NPCP-BG-CTX and TMZ was much better tolerated than treatment with free BG combined with TMZ, which produced significant myelosuppression. NPCP-BG-CTX was successfully administered by CED and produced excellent distributions within the brain tumor. The clearly delineated contrast provided by NPCP-BG-CTX in MR images displayed the potential for real-time monitoring of drug delivery. In combination with TMZ, NPCP-BG-CTX increased median overall survival 3-fold over untreated animals. Combined, these findings warrant further evaluation of NPCP-BG-CTX as a viable adjunct to the current clinical treatment of patients with MGMT expressing GBMs.
Materials and Methods
Materials
All reagents were purchased from Sigma-Aldrich (St. Louis, MO) unless otherwise specified. The heterobifunctional linker 2-iminothiolane (Traut’s reagent) was purchased from Molecular Biosciences (Boulder, CO). NHS-PEG12-maleimide was purchased from Thermo Fisher Scientific (Rockford, IL). Tissue culture reagents including DMEM and antibiotic–antimycotic were purchased from Invitrogen (Carlsbad, CA). Fetal bovine serum (FBS) was purchased from Atlanta Biologicals (Lawrenceville, GA).
NPCP Synthesis
Iron oxide nanoparticles coated with a copolymer of chitosan-grafted-PEG were synthesized via a co-precipitation method as previously reported.25 Briefly, chitosan oligosaccharide (5,000 kDa) was PEGylated with aldehyde-activated methoxy PEG to produce chitosan-grafted-PEG (CP). Pure CP (150 mg) was mixed with iron chlorides (9 mg Fe2+, 15 mg Fe3+) in 2.18 mL of degassed DI water. A 14.5 M solution of ammonium hydroxide was titrated in slowly at 40 °C until a final pH of 10.5 was reached to ensure complete nucleation of NPs. At this point, the synthesized NPCP were purified using size exclusion chromatography in S-200 resin (GE Healthcare, Piscataway, NJ) into 100 mM sodium bicarbonate buffer, pH 8.0, containing 5 mM EDTA. NPCP was then thiolated using Traut’s reagent (10 mg) in 100 μL of 100 mM sodium bicarbonate, pH 8.0, 5 mM EDTA. The reaction was maintained in the dark at room temperature for 1 h. The thiolated NPCP was purified using size exclusion chromatography in S-200 resin (GE Healthcare, Piscataway, NJ) into 100 mM sodium bicarbonate buffer, pH 8.5, without EDTA and subsequently aged overnight at 4 °C to promote disulfide formation.
Synthesis of Brominated BG
BG (2.4 mg) was dissolved in 500 μL of methanol (MeOH) and mixed with N-bromosuccinimide (2 mg) dissolved in 500 μL of MeOH. The reaction was maintained in the dark at room temperature for 24 h yielding brominated BG (BG-Br). MeOH was removed under vacuum. Bromination of BG was confirmed by LC–MS as described in the Supporting Information Methods.
NPCP-CTX and NPCP-BG-CTX Synthesis
NPCP in 100 mM sodium bicarbonate buffer, pH 8.5, was mixed with BG-Br and dissolved in dimethylformamide (DMF) at a 5:1 weight ratio of iron to BG-Br. DMF volume was limited to 10% of the total reaction volume. The reaction was maintained in the dark at room temperature for 24 h to produce NPCP-BG. A total of 300 μL of the NPCP-BG reaction mixture was set aside for evaluation of BG loading. The remaining NPCP-BG was purified using size exclusion chromatography in S-200 resin (GE Healthcare, Piscataway, NJ) into 100 mM sodium bicarbonate buffer, pH 8.0, containing 5 mM EDTA for further conjugations of fluorophores and chlorotoxin (CTX).
NPCP-BG (3.5 mg) or NPCP (3.5 mg) was reacted with 1 mg of Cy5.5 (GE healthcare) in 100 mM sodium bicarbonate buffer, pH 8.0, containing 5 mM EDTA for 1 h at room temperature protected from light and with gentle rocking. Excess Cy5.5 was removed using size exclusion chromatography in S-200 resin (GE Healthcare, Piscataway, NJ). A 1 mg/mL solution of CTX was prepared in thiolation buffer and reacted with 2IT at a 1.2:1 molar ratio of 2IT/CTX for 1 h in the dark. Concurrently, NPCP-BG-Cy5.5 was reacted with SM(PEG)12 at 216 μg of SM(PEG)12/mg Fe in the dark with gentle rocking for 30 min. The SM(PEG)12 modified NPCP-BG-Cy5.5 was then reacted with CTX-2IT at 1 μg CTX per 4.5 μg Fe for 1 h in the dark to produce NPCP-BG-Cy5.5-CTX. The resultant NP was purified using size exclusion chromatography in S-200 resin equilibrated with PBS, and stored at 4 °C. For CED, NPs were brought to 2 mg/mL and supplemented with 2.5% 400MW PEG (w/w) and 2.5% dextrose (w/w) before being flash-frozen in liquid nitrogen and stored at −80 °C.
Evaluation of BG Loading
The NPCP-BG reaction mixture (300 μL) was placed in a 3000 MW cutoff Amicon Ultra centrifugal filter (Millipore, Billerica, MA) and centrifuged at 12 000 rcf for 10 min. The flow through containing unreacted BG was collected, and free BG was quantified by absorbance measurements at 280 nm using a SpectraMax M2 microplate reader (Molecular Devices, Sunnyvale, CA) and standard curve of known BG concentrations. BG conjugated to NPs was calculated by subtracting the amount of free BG from the total amount of BG in the reaction. The mean and standard deviation of BG per NPCP was calculated from 4 independent representative batches.
Evaluation of CTX Labeling
To quantify the degree of CTX attachment to nanoparticles, NPCP-BG-CTX was prepared as described above except unbound CTX was not purified from the NPCP-BG-CTX reaction mixture. The unpurified reaction mixture was mixed with an equal volume of Laemmli Sample Buffer (Bio-Rad, Hercules, CA) and 30 μL was then loaded in a precast 4–20% polyacrylamide gel (Bio-Rad, Hercules, CA). Free CTX at 500, 250, 125, and 62.5 μg/mL was mixed with an equal volume of Laemmli Sample Buffer and the solution was loaded (30 μL) in the precast gel as standards. The gel was run at 100 V for 1 h. Free, unreacted CTX separated from the CTX conjugated to NPs along with the CTX standards were imaged on a Gel Doc XR (Bio-Rad, Hercules, CA) and quantified using the Quantity One software package (Bio-Rad, Hercules, CA). The amount of CTX conjugated to NPs was calculated by subtracting the amount of free CTX from the total amount of CTX in the reaction and assuming an NP molecular weight of ∼600 000 g/mol (Supporting Information Figure 3).
Drug Release
For this assay, an Alexa Fluor 488 (AF488: Invitrogen, Carlsbad, CA) labeled version of BG was prepared. An amine modified version of BG (BG-NH2) was purchased from New England BioLabs, Inc. (Ipswich, MA) and modified with AF488 according to the manufacture’s instructions to produce AF 488 modified BG (BG-AF488). BG-488 was conjugated to NPCP as described above to produce (NPCP-(BG-AF488)). NPCP-(BG-AF488) (1 mg of Fe/mL) was diluted into PBS at pH 7.4 and acetate buffer at pH 5.0 containing 100 mM glutathione and incubated at 37 °C for 0, 1, 8, and 24 h. CP-(BG-AF488) was separated from NPCP-(BG-AF488) using Amicon centrifuge filters (30 000 MW cutoff, Millipore). Free CP-(BG-AF488) content in the filtrate was determined by fluorescence measurements. Percent CP-(BG-AF488) released from NPCP-(BG-AF488) was calculated using the fluorescence of total amount of drug released over 24 h.
Cell Culture
SF767, a human GBM cell line obtained from the tissue bank of the Brain Tumor Research Center (University of California—San Francisco, San Francisco, CA), was maintained in DMEM supplemented with 10% FBS and 1% antibiotic–antimycotic at 37 °C and 5% CO2.
Confocal Fluorescence Microscopy
Treated cells (50 000) were plated on 24 mm glass coverslips and allowed to attach for 24 h. Cells were then washed with PBS and fixed in 4% formaldehyde (Polysciences, Inc., Warrington, PA) for 30 min. Cells were then washed three times with PBS and membrane-stained with WGA-AF555 (Invitrogen, Carlsbad, CA) according to the manufacturer’s instructions. Coverslips were then mounted on microscope slides using Prolong Gold antifade solution (Invitrogen, Carlsbad, CA) containing DAPI for cell nuclei staining. Images were acquired on a LSM 510 Meta confocal fluorescence microscope (Carl Zeiss, Inc., Peabody, MA) with the appropriate filters.
MGMT Activity Assay
The MGMT activities of protein extracts of human GBM SF767 cells were measured in a standard biochemical assay that quantifies the transfer of radioactivity from a DNA substrate containing [methyl3H]O6-methylguanine (specific activity, 80 Ci/mmol) to protein, as detailed previously.43 SF767 cells (2 × 10⁶) were plated in 100 mm dishes and incubated with 10 μM free BG for 2 or 24 h with NPCP-BG-CTX equivalent to 10 μM BG in fully supplemented medium. After incubation, cells were washed with PBS and collected, and protein extracts were prepared. The protein extract supernatant was prepared by dissolution of washed SF767 pellets of known cell number with non-ionic detergents in the presence of 600 mM NaCl.42 Aliquots of crude homogenate were saved for DNA determination by the diphenylamine method that measures deoxyribose following degradation of DNA with heat and acid.56 Crude homogenate was cleared by centrifugation at 10 000g for 30 min. Activity, normalized to cell number using a conversion factor of 6 pg DNA per cell, is femtomole O6-methylguanine transferred per 106 cells.
Clonogenic Survival Assay
Determination of proliferative survival of SF767 by clonogenic assay was performed as described previously.42 Briefly, 6-well plates inoculated with 2 mL of supplemented medium containing 500–1000 cells were incubated overnight at 37 °C in 95%/5% air/CO2 to allow reattachment and resumption of proliferation. Cells were then incubated for 24 h with NPCP-BG-CTX equivalent to 20 μM free BG prior to exposure to TMZ. Incubation was continued for 24 h before changing cells to fresh, drug-free medium to allow formation of colonies ≥50 cells. Controls included cells treated with NPCP-CTX (Fe equivalent to NPCP-BG-CTX) or with 20 μM free BG; untreated controls received an equivalent volume of DMSO solvent. Survival (mean ± SD) is the ratio of colony-forming ability of treated cells to that of untreated cells. Cytotoxicity was quantitated by linear regression analysis of plots of log surviving fraction vs TMZ dose to obtain the dose required to reduce survival to 10%, LD10. Survival was determined in two separate experiments in which every dose was assayed in duplicate (i.e., four determinations per TMZ dose).
Animal Model
All animal studies were conducted in accordance with University of Washington’s Institute of Animal Care and Use Committee (IACUC) approved protocols as well as with federal guidelines. GBM6 cells were obtained from the Mayo Clinic and maintained as flank tumors in nude mice.47 Luciferase expressing GBM6 (GBM6-luc) cells were generated through lentiviral transduction and then maintained as flank tumors. For intracranial implant of GBM6-luc tumors, flank tumors were harvested, minced with a scalpel, then suspended into an equal volume of ice-cold PBS (1 mL PBS per 1 g of tumor). Tumor cells were disaggregated by gentle pipetting then filtered through a 40 μm filter and kept on ice at 107 cells/mL. Mice (nude athymic) were anesthetized with isoflurane and affixed to the base of a stereotaxic frame with ear bars. The skull was exposed through a 1 cm midline incision, then a burr hole made 2 mm to the right of bregma and 1 mm posterior to the coronal suture using a dremel equipped with a 1 mm tip. Using a Hamilton syringe attached to the stereotaxic frame, 2 μL of cells (20 000 cells) was injected over 1 min at a depth of 3 mm. After injection, the syringe was kept in place for 1 min prior to withdraw and the incision closed with Vetbond skin glue. Animals were monitored for tumor growth through Xenogen IVIS luminescent imaging.
In Vivo Survival Studies
Treatments were started once tumors were visible with IVIS imaging. Treatment conditions were as follows: NPCP-BG-CTX (5 μL, 15 μg BG/kg) (n = 8) and NPCP-CTX (5 μL, Fe concentration equivalent to NPCP-BG-CTX dosage) (n = 10) were administered via CED 24 h prior to TMZ treatment (66 mg TMZ/kg suspended in Ora-Plus via oral gavage). A group of 12 animals were left untreated. CED was performed with a stereotaxic frame in the same manner as described for the tumor implant. A new burr hole was produced at the same location as for the tumor implantation and the tip of the Hamilton syringe was placed at a depth of 3 mm prior to infusion of 5 μL of NP at 1 μL/min. The treatment schedule is indicated in Figure 7a. All mice were euthanized when they became moribund. Survival was monitored and analyzed using a Kaplan–Meier plot. Statistical analysis was performed using the log rank test.
Magnetic Resonance Imaging
Ex vivo whole mouse brain samples were fixed in formaldehyde and placed in fomblin (Sigma) immediately prior to imaging. Fixed brain samples were obtained from mice with no NP injection, immediately after CED of NP, and at t = 24 h, and at t = 48 h after CED of NP. Imaging was performed on Bruker 14 T magnet (Ultrashield 600 WB Plus), using a 25 mm single-channel 1H radiofrequency coil (PB Micro 2.5). Imaging sequences included (i) T2-weighted rapid acquisition with refocused echoes (RARE) sequence, performed separately in the transverse and sagittal planes (TR/TE = 4000/27 ms, in-plane resolution = 52 × 78 μm2, matrix = 384 × 256), (ii) T2*-weighted 2-D fast low-angled shot (FLASH) sequence (TR/TE = 1000/6 ms, in-plane resolution = 98 × 98 μm2, matrix = 256 × 256), (iii) quantitative T2 multispin multi echo (MSME) sequence (TR = 4000 ms, TE = 6.7 + 6n ms, n = 0–16). 2-D slices of 0.5 mm thickness were used in all sequences. Analysis was performed using the Bruker integrated software package (ParaVision 5.1) for T2 calculation, and OsiriX for image display. Quantitative T2 values were displayed as mean ± standard deviation.
Plasma Half-Life
C57BL6 wild-type mice (Charles River Laboratories, Inc.) were injected through the tail vein with 200 μL of 1 mg/mL nanoparticle (n = 3). At 1, 8, and 24 h after injection, blood was collected by retro-orbital eye bleed or terminal heart puncture. Because of limitations on the amount of blood that can be drawn from each animal, no animal was used for more than one time point. Blood samples were drawn from three independent mice for each time point and frozen at −80 °C until analysis. Samples were thawed at room temperature for 30 min prior to analysis. Whole blood was spun using a benchtop centrifuge for 5 min at 10 000 rpm to separate the plasma. Then, 50 mL of plasma was added to a 96 well clear bottom plate. The plate was scanned on the Odyssey NIR fluorescence imaging instrument (LI-COR, Lincoln, NE) using the 700 nm-channel (lexc = 685 nm with lem = 705 nm) to measure Cy5.5 fluorescence signals.
Biodistribution of Nanoparticles
The biodistribution of nanoparticles was assessed as previously described.51 Briefly, animals were injected via tail vein with 200 μL of 1 mg/mL of nanoparticles. Three additional noninjected animals were included as controls. Forty-eight hours after injection (n = 3), the animals were euthanized and tissues were dissected from 6 different organs: liver, spleen, kidney, lung, heart, and brain. Tissues were then embedded in OCT and kept frozen at −80 °C until needed. The frozen tissues were sliced in 12 μm thick sections and mounted onto glass slides. The tissue sections were thawed at room temperature for 30 min, and the fluorescence intensity was measured using the Odyssey fluorescence scanner at a resolution of 21 mm. The images were analyzed with the public-domain ImageJ software (U.S. National Institutes of Health, Bethesda, MD). The average fluorescence intensity was determined for each tissue type using the same threshold settings (low threshold, 400; high threshold, 20 000). Data were reported as the average channel fluorescence of the tissue, given as relative units after background subtraction. For visual illustrations of fluorescence signals, color maps are generated using Matlab (Mathworks, Natick, MA).
Histopathological Evaluation and Hematology Assay
Whole organs (brain, liver, kidney, and spleen) of C57BL/6 mice were removed through necropsy 120 h after intravenous injection of nanoparticles or PBS and preserved in 10% formalin for 48 h. Tissues were then embedded in paraffin wax, sliced into 5 μm thick sections, and stained with hematoxylin and eosin (H&E) or Prussian blue/Nuclear Fast Red using standard clinical laboratory protocols. Microscopic images of tissues were acquired using an E600 upright microscope (Nikon) equipped with a CCD color camera. Blood cell panels and serum aspartate aminotransferase (AST) and alanine aminotransferase (ALT) levels were quantified 120 h after intravenous administration of nanoparticles or free drug (n = 3 per treatment condition), and compared to mice receiving PBS injection (n = 5). Blood (300 μL) was drawn from each mouse through cardiac heart puncture. Samples were then submitted to a veterinary pathology laboratory (Phoenix Laboratories, Everett, WA) for third party analysis.
Acknowledgments
This work is supported by NIH grants R01CA161953, R01CA134213 and R01EB006043. Z. R. Stephen, F. M. Kievit, O. Veiseh, and C. Fang acknowledge support through NCI training grant T32CA138312. F. M. Kievit also acknowledges support from the American Brain Tumor Association Basic Research Fellowship in Honor of Susan Kramer. K. Wang acknowledges support from the College of Engineering Dean’s Fellowship at University of Washington. We acknowledge lab assistance from V. Lui, J. Phillips, J. Choi, C. Dayringer and the use of resources at the Department of Immunology’s cell analysis facility, Keck Microscopy Imaging Facility and the Mass Spec facility at University of Washington. We thank the Sarkaria lab at the Mayo clinic for providing the GBM6 cells.
Supporting Information Available
Characterization of NPCP cross-linking, characterization of BG-Br reaction product, NPCP-BG-CTX size and zeta potential distributions, TEM characterization of NP core size, in vivo determination of NPCP-BG-Cy5.5-CTX BBB permeability, CTX targeting of GBM cell lines, and histological evaluation of NPCP-BG-CTX acute toxicity. This material is available free of charge via the Internet at http://pubs.acs.org.
The authors declare no competing financial interest.
Funding Statement
National Institutes of Health, United States
Supplementary Material
References
- Veiseh O.; Kievit F. M.; Ellenbogen R. G.; Zhang M. Cancer Cell Invasion: Treatment and Monitoring Opportunities in Nanomedicine. Adv. Drug Delivery Rev. 2011, 63, 582–596. [DOI] [PMC free article] [PubMed] [Google Scholar]
- Kievit F. M.; Zhang M. Cancer Nanotheranostics: Improving Imaging and Therapy by Targeted Delivery across Biological Barriers. Adv. Mater. 2011, 23, H217–247. [DOI] [PMC free article] [PubMed] [Google Scholar]
- Veiseh O.; Gunn J. W.; Zhang M. Design and Fabrication of Magnetic Nanoparticles for Targeted Drug Delivery and Imaging. Adv. Drug Delivery Rev. 2010, 62, 284–304. [DOI] [PMC free article] [PubMed] [Google Scholar]
- Madabhushi A.; Doyle S.; Lee G.; Basavanhally A.; Monaco J.; Masters S.; Tomaszewski J.; Feldman M. Integrated Diagnostics: A Conceptual Framework with Examples. Clin. Chem. Lab. Med. 2010, 48, 989–998. [DOI] [PubMed] [Google Scholar]
- Jain R. K.; Stylianopoulos T. Delivering Nanomedicine to Solid Tumors. Nat. Rev. Clin. Oncol. 2010, 7, 653–664. [DOI] [PMC free article] [PubMed] [Google Scholar]
- Davis M. E.; Chen Z. G.; Shin D. M. Nanoparticle Therapeutics: An Emerging Treatment Modality for Cancer. Nat. Rev. Drug Discovery 2008, 7, 771–782. [DOI] [PubMed] [Google Scholar]
- Patil R.; Portilla-Arias J.; Ding H.; Inoue S.; Konda B.; Hu J.; Wawrowsky K. A.; Shin P. K.; Black K. L.; Holler E.; et al. Temozolomide Delivery to Tumor Cells by a Multifunctional Nano Vehicle Based on Poly(β-L-malic acid). Pharm. Res. 2010, 27, 2317–2329. [DOI] [PMC free article] [PubMed] [Google Scholar]
- Mrugala M. M.; Chamberlain M. C. Mechanisms of Disease: Temozolomide and Glioblastoma—Look to the Future. Nat. Clin. Pract. Oncol. 2008, 5, 476–486. [DOI] [PubMed] [Google Scholar]
- Bobola M. S.; Tseng S. H.; Blank A.; Berger M. S.; Silber J. R. Role of O6-Methylguanine-DNA Methyltransferase in Resistance of Human Brain Tumor Cell Lines to the Clinically Relevant Methylating Agents Temozolomide and Streptozotocin. Clin. Cancer Res. 1996, 2, 735–741. [PubMed] [Google Scholar]
- Bobola M. S.; Silber J. R.; Ellenbogen R. G.; Geyer J. R.; Blank A.; Goff R. D. O6-Methylguanine-DNA Methyltransferase, O6-Benzylguanine, and Resistance to Clinical Alkylators in Pediatric Primary Brain Tumor Cell Lines. Clin. Cancer Res. 2005, 11, 2747–2755. [DOI] [PubMed] [Google Scholar]
- Bobola M. S.; Kolstoe D. D.; Blank A.; Silber J. R. Minimally Cytotoxic Doses of Temozolomide Produce Radiosensitization in Human Glioblastoma Cells Regardless of Mgmt Expression. Mol. Cancer Ther. 2010, 9, 1208–1218. [DOI] [PMC free article] [PubMed] [Google Scholar]
- Silber J. R.; Bobola M. S.; Blank A.; Schoeler K. D.; Haroldson P. D.; Huynh M. B.; Kolstoe D. D. The Apurinic/Apyrimidinic Endonuclease Activity of Ape1/Ref-1 Contributes to Human Glioma Cell Resistance to Alkylating Agents and Is Elevated by Oxidative Stress. Clin. Cancer Res. 2002, 8, 3008–3018. [PubMed] [Google Scholar]
- Bobola M. S.; Varadarajan S.; Smith N. W.; Goff R. D.; Kolstoe D. D.; Blank A.; Gold B.; Silber J. R. Human Glioma Cell Sensitivity to the Sequence-Specific Alkylating Agent Methyl-Lexitropsin. Clin. Cancer Res. 2007, 13, 612–620. [DOI] [PubMed] [Google Scholar]
- Quinn J. A.; Jiang S. X.; Reardon D. A.; Desjardins A.; Vredenburgh J. J.; Rich J. N.; Gururangan S.; Friedman A. H.; Bigner D. D.; Sampson J. H.; et al. Phase II Trial of Temozolomide Plus O6-Benzylguanine in Adults with Recurrent, Temozolomide-Resistant Malignant Glioma. J. Clin. Oncol. 2009, 27, 1262–1267. [DOI] [PMC free article] [PubMed] [Google Scholar]
- Berg S. L.; Gerson S. L.; Godwin K.; Cole D. E.; Liu L.; Balis F. M. Plasma and Cerebrospinal Fluid Pharmacokinetics of O6-Benzylguanine and Time Course of Peripheral Blood Mononuclear Cell O6-Methylguanine-DNA Methyltransferase Inhibition in the Nonhuman Primate. Cancer Res. 1995, 55, 4606–4610. [PubMed] [Google Scholar]
- Roy S. K.; Gupta E.; Dolan M. E. Pharmacokinetics of O6-Benzylguanine in Rats and Its Metabolism by Rat Liver Microsomes. Drug Metab. Dispos. 1995, 23, 1394–1399. [PubMed] [Google Scholar]
- Boiardi A.; Eoli M.; Salmaggi A.; Lamperti E.; Botturi A.; Solari A.; Di Meco F.; Broggi G.; Silvani A. Local Drug Delivery in Recurrent Malignant Gliomas. Neurol. Sci. 2005, 26, s37–s39. [DOI] [PubMed] [Google Scholar]
- Wang P. P.; Frazier J.; Brem H. Local Drug Delivery to the Brain. Adv. Drug Delivery Rev. 2002, 54, 987–1013. [DOI] [PubMed] [Google Scholar]
- Allhenn D.; Shetab Boushehri M. A.; Lamprecht A. Drug Delivery Strategies for the Treatment of Malignant Gliomas. Int. J. Pharm. 2012, 436, 299–310. [DOI] [PubMed] [Google Scholar]
- Juratli T. A.; Schackert G.; Krex D. Current Status of Local Therapy in Malignant Gliomas—A Clinical Review of Three Selected Approaches. Pharmacol. Ther. 2013, 139, 341–358. [DOI] [PubMed] [Google Scholar]
- Allard E.; Passirani C.; Benoit J.-P. Convection-Enhanced Delivery of Nanocarriers for the Treatment of Brain Tumors. Biomaterials 2009, 30, 2302–2318. [DOI] [PubMed] [Google Scholar]
- Saito R.; Krauze M. T.; Noble C. O.; Tamas M.; Drummond D. C.; Kirpotin D. B.; Berger M. S.; Park J. W.; Bankiewicz K. S. Tissue Affinity of the Infusate Affects the Distribution Volume During Convection-Enhanced Delivery into Rodent Brains: Implications for Local Drug Delivery. J. Neurosci. Methods 2006, 154, 225–232. [DOI] [PubMed] [Google Scholar]
- Sun C.; Du K.; Fang C.; Bhattarai N.; Veiseh O.; Kievit F.; Stephen Z.; Lee D.; Ellenbogen R. G.; Ratner B.; et al. PEG-Mediated Synthesis of Highly Dispersive Multifunctional Superparamagnetic Nanoparticles: Their Physicochemical Properties and Function in Vivo. ACS Nano 2010, 4, 2402–2410. [DOI] [PMC free article] [PubMed] [Google Scholar]
- Sun C.; Fang C.; Stephen Z.; Veiseh O.; Hansen S.; Lee D.; Ellenbogen R. G.; Olson J.; Zhang M. Tumor-Targeted Drug Delivery and Mri Contrast Enhancement by Chlorotoxin-Conjugated Iron Oxide Nanoparticles. Nanomed. 2008, 3, 495–505. [DOI] [PMC free article] [PubMed] [Google Scholar]
- Veiseh O.; Sun C.; Fang C.; Bhattarai N.; Gunn J.; Kievit F.; Du K.; Pullar B.; Lee D.; Ellenbogen R. G.; et al. Specific Targeting of Brain Tumors with an Optical/Magnetic Resonance Imaging Nanoprobe across the Blood-Brain Barrier. Cancer Res. 2009, 69, 6200–6207. [DOI] [PMC free article] [PubMed] [Google Scholar]
- Longmire M.; Choyke P. L.; Kobayashi H. Clearance Properties of Nano-Sized Particles and Molecules as Imaging Agents: Considerations and Caveats. Nanomedicine 2008, 3, 703–717. [DOI] [PMC free article] [PubMed] [Google Scholar]
- MacKay J. A.; Deen D. F.; Szoka F. C. Jr. Distribution in Brain of Liposomes after Convection Enhanced Delivery; Modulation by Particle Charge, Particle Diameter, and Presence of Steric Coating. Brain Res. 2005, 1035, 139–153. [DOI] [PubMed] [Google Scholar]
- Kim B.; Han G.; Toley B. J.; Kim C. K.; Rotello V. M.; Forbes N. S. Tuning Payload Delivery in Tumour Cylindroids Using Gold Nanoparticles. Nat. Nanotechnol. 2010, 5, 465–472. [DOI] [PMC free article] [PubMed] [Google Scholar]
- Zhou L.; He B.; Zhang F. Facile One-Pot Synthesis of Iron Oxide Nanoparticles Cross-Linked Magnetic Poly(vinyl alcohol) Gel Beads for Drug Delivery. ACS Appl. Mater. Interfaces 2012, 4, 192–199. [DOI] [PubMed] [Google Scholar]
- Luo Z.; Cai K.; Hu Y.; Li J.; Ding X.; Zhang B.; Xu D.; Yang W.; Liu P. Redox-Responsive Molecular Nanoreservoirs for Controlled Intracellular Anticancer Drug Delivery Based on Magnetic Nanoparticles. Adv. Mater. 2012, 24, 431–435. [DOI] [PubMed] [Google Scholar]
- Ge J.; Neofytou E.; Cahill T. J.; Beygui R. E.; Zare R. N. Drug Release from Electric-Field-Responsive Nanoparticles. ACS Nano 2012, 6, 227–233. [DOI] [PMC free article] [PubMed] [Google Scholar]
- Caldorera-Moore M. E.; Liechty W. B.; Peppas N. A. Responsive Theranostic Systems: Integration of Diagnostic Imaging Agents and Responsive Controlled Release Drug Delivery Carriers. Acc. Chem. Res. 2011, 44, 1061–1070. [DOI] [PMC free article] [PubMed] [Google Scholar]
- Feener E. P.; Shen W. C.; Ryser H. J. Cleavage of Disulfide Bonds in Endocytosed Macromolecules. A Processing Not Associated with Lysosomes or Endosomes. J. Biol. Chem. 1990, 265, 18780–18785. [PubMed] [Google Scholar]
- Veiseh M.; Gabikian P.; Bahrami S. B.; Veiseh O.; Zhang M.; Hackman R. C.; Ravanpay A. C.; Stroud M. R.; Kusuma Y.; Hansen S. J.; et al. Tumor Paint: A Chlorotoxin:Cy5.5 Bioconjugate for Intraoperative Visualization of Cancer Foci. Cancer Res. 2007, 67, 6882–6888. [DOI] [PubMed] [Google Scholar]
- Kesavan K.; Ratliff J.; Johnson E. W.; Dahlberg W.; Asara J. M.; Misra P.; Frangioni J. V.; Jacoby D. B. Annexin A2 Is a Molecular Target for Tm601, a Peptide with Tumor-Targeting and Anti-Angiogenic Effects. J. Biol. Chem. 2010, 285, 4366–4374. [DOI] [PMC free article] [PubMed] [Google Scholar]
- Soroceanu L.; Gillespie Y.; Khazaeli M. B.; Sontheimer H. Use of Chlorotoxin for Targeting of Primary Brain Tumors. Cancer Res. 1998, 58, 4871–4879. [PubMed] [Google Scholar]
- Lyons S. A.; O’Neal J.; Sontheimer H. Chlorotoxin, a Scorpion-Derived Peptide, Specifically Binds to Gliomas and Tumors of Neuroectodermal Origin. Glia 2002, 39, 162–173. [DOI] [PubMed] [Google Scholar]
- Veiseh O.; Gunn J. W.; Kievit F. M.; Sun C.; Fang C.; Lee J. S.; Zhang M. Inhibition of Tumor-Cell Invasion with Chlorotoxin-Bound Superparamagnetic Nanoparticles. Small 2009, 5, 256–264. [DOI] [PMC free article] [PubMed] [Google Scholar]
- Deshane J.; Garner C. C.; Sontheimer H. Chlorotoxin Inhibits Glioma Cell Invasion via Matrix Metalloproteinase-2. J. Biol. Chem. 2003, 278, 4135–4144. [DOI] [PubMed] [Google Scholar]
- Silber J. R.; Bobola M. S.; Blank A.; Chamberlain M. C. O6-Methylguanine-DNA Methyltransferase in Glioma Therapy: Promise and Problems. Biochim. Biophys. Acta 2012, 1826, 71–82. [DOI] [PMC free article] [PubMed] [Google Scholar]
- Frosina G. DNA Repair and Resistance of Gliomas to Chemotherapy and Radiotherapy. Mol. Cancer Res. 2009, 7, 989–999. [DOI] [PubMed] [Google Scholar]
- Blank A.; Bobola M. S.; Gold B.; Varadarajan S.; D. Kolstoe D.; Meade E. H.; Rabinovitch P. S.; Loeb L. A.; Silber J. R. The Werner Syndrome Protein Confers Resistance to the DNA Lesions N3-Methyladenine and O6-Methylguanine: Implications for WRN Function. DNA Repair 2004, 3, 629–638. [DOI] [PubMed] [Google Scholar]
- Silber J. R.; Bobola M. S.; Ghatan S.; Blank A.; Kolstoe D. D.; Berger M. S. O6-Methylguanine-DNA Methyltransferase Activity in Adult Gliomas: Relation to Patient and Tumor Characteristics. Cancer Res. 1998, 58, 1068–1073. [PubMed] [Google Scholar]
- Carlson B. L.; Grogan P. T.; Mladek A. C.; Schroeder M. A.; Kitange G. J.; Decker P. A.; Giannini C.; Wu W.; Ballman K. A.; James C. D.; et al. Radiosensitizing Effects of Temozolomide Observed in Vivo Only in a Subset of O6-Methylguanine-DNA Methyltransferase Methylated Glioblastoma Multiforme Xenografts. Int. J. Radiat. Oncol., Biol., Phys. 2009, 75, 212–219. [DOI] [PMC free article] [PubMed] [Google Scholar]
- Frederick L.; Wang X. Y.; Eley G.; James C. D. Diversity and Frequency of Epidermal Growth Factor Receptor Mutations in Human Glioblastomas. Cancer Res. 2000, 60, 1383–1387. [PubMed] [Google Scholar]
- Pegg A. E. Mammalian O6-Alkylguanine-DNA Alkyltransferase: Regulation and Importance in Response to Alkylating Carcinogenic and Therapeutic Agents. Cancer Res. 1990, 50, 6119–6129. [PubMed] [Google Scholar]
- Carlson B. L.; Pokorny J. L.; Schroeder M. A.; Sarkaria J. N.. Establishment, Maintenance and in Vitro and in Vivo Applications of Primary Human Glioblastoma Multiforme (Gbm) Xenograft Models for Translational Biology Studies and Drug Discovery. Curr. Protoc. Pharmacol. 2011, Chapter 14, Unit 14.16. [DOI] [PMC free article] [PubMed] [Google Scholar]
- Mardor Y.; Rahav O.; Zauberman Y.; Lidar Z.; Ocherashvilli A.; Daniels D.; Roth Y.; Maier S. E.; Orenstein A.; Ram Z. Convection-Enhanced Drug Delivery: Increased Efficacy and Magnetic Resonance Image Monitoring. Cancer Res. 2005, 65, 6858–6863. [DOI] [PubMed] [Google Scholar]
- Vogelbaum M. A. Convection Enhanced Delivery for Treating Brain Tumors and Selected Neurological Disorders: Symposium Review. J. Neurooncol. 2007, 83, 97–109. [DOI] [PubMed] [Google Scholar]
- Juratli T. A.; Schackert G.; Krex D. Current Status of Local Therapy in Malignant Gliomas—A Clinical Review of Three Selected Approaches. Pharmacol. Ther. 2013, 139, 341–358. [DOI] [PubMed] [Google Scholar]
- Lee M. J. E.; Veiseh O.; Bhattarai N.; Sun C.; Hansen S. J.; Ditzler S.; Knoblaugh S.; Lee D.; Ellenbogen R.; Zhang M. Q.; et al. Rapid Pharmacokinetic and Biodistribution Studies Using Cholorotoxin-Conjugated Iron Oxide Nanoparticles: A Novel Non-Radioactive Method. PLoS One 2010, 5, 8. [DOI] [PMC free article] [PubMed] [Google Scholar]
- Moore A.; Marecos E.; Bogdanov A. Jr.; Weissleder R. Tumoral Distribution of Long-Circulating Dextran-Coated Iron Oxide Nanoparticles in a Rodent Model. Radiology 2000, 214, 568–574. [DOI] [PubMed] [Google Scholar]
- Medarova Z.; Pham W.; Farrar C.; Petkova V.; Moore A. In Vivo Imaging of Sirna Delivery and Silencing in Tumors. Nat. Med. 2007, 13, 372–377. [DOI] [PubMed] [Google Scholar]
- Warren K. E.; Gururangan S.; Geyer J. R.; McLendon R. E.; Poussaint T. Y.; Wallace D.; Balis F. M.; Berg S. L.; Packer R. J.; Goldman S.; et al. A Phase II Study of O6-Benzylguanine and Temozolomide in Pediatric Patients with Recurrent or Progressive High-Grade Gliomas and Brainstem Gliomas: A Pediatric Brain Tumor Consortium Study. J. Neuro-Oncol. 2012, 106, 643–649. [DOI] [PMC free article] [PubMed] [Google Scholar]
- NCI. Common Terminology Criteria for Adverse Events V3.0. http://ctep.cancer.gov/ProtocolDevelopment/electronic_applications/docs/ctcaev3.pdf (accessed March 2, 2012).
- Burton K. A Study of the Conditions and Mechanism of the Diphenylamine Reaction for the Colorimetric Estimation of Deoxyribonucleic Acid. Biochem. J. 1956, 62, 315–323. [DOI] [PMC free article] [PubMed] [Google Scholar]
Associated Data
This section collects any data citations, data availability statements, or supplementary materials included in this article.