

Abstract
Blood–brain barrier (BBB) disturbance is a crucial occurrence in many neurological diseases, including systemic lupus erythematosus (SLE). Our previous studies showed that experimental lupus serum altered the integrity of the mouse brain endothelial layer, an important constituent of the BBB. Complement activation occurs in lupus with increased circulating complement components. Using a genomics approach, we identified the microRNA (miRNA) altered in mouse brain endothelial cells (bEnd3) by lupus serum and the complement protein, C5a. Of the 318 miRNA evaluated, 23 miRNAs were altered by lupus serum and 32 were altered by C5a alone compared with controls. Seven miRNAs (P < 0·05) were differentially expressed by both treatments: mmu-miR-133a*, mmu-miR-193*, mmu-miR-26b, mmu-miR-28*, mmu-miR-320a, mmu-miR-423-3p and mmu-miR-509-5p. The microarray results were validated by quantitative RT-PCR. In line with the in vitro results, expression of miR-26b and miR-28* were also significantly up-regulated in lupus mouse brain which was reduced by C5a receptor inhibition. Target prediction analysis revealed miR gene targets encoding components involved in inflammation, matrix arrangement, and apoptosis, pathways known to play important roles in central nervous system lupus. Our findings suggest that the miRNAs reported in this study may represent novel therapeutic targets in central nervous system lupus and other similar neuroinflammatory settings.
Keywords: brain, complement, endothelial cells, inflammation, lupus, microRNA
Introduction
Brain endothelial layer is an important constituent of the blood–brain barrier (BBB).1 The disturbance of the BBB is a hallmark of several neurological disorders, including systemic lupus erythematosus (SLE).2 Our recent studies have shown that experimental lupus serum alters the brain endothelial layer integrity, and the complement cascade, specifically C5a/C5aR signalling, has an important role in inducing these changes.3,4
The complement cascade plays an important role in the pathogenesis of a number of inflammatory diseases, including lupus.5,6 It consists of three activation pathways of more than 30 plasma and cell-associated proteins that converge on the central proteins, C3 and C5. Complement activation generates C3a, C3b, C5a and C5b-9, each of which has biological activity.7–10 The C3a and C5a anaphylatoxins signal through their receptors, C3aR and C5aR.11,12 C5a induces migration, proliferation and vessel formation in endothelial cells. C5a was also shown to alter genes in human umbilical vein endothelial cells.13 Our earlier studies in vivo, using the well-established experimental mouse model MRL/lpr mice, and in vitro using cultured brain endothelial cells show that signalling through C5aR makes the BBB leaky.3 However, the specific factors or underlying mechanisms that lead to these changes remain unclear. With the proliferating literature of studies revealing novel microRNA (miRNA) -mediated mechanisms that influence brain function and dysfunction,14,15 it is possible that C5a could regulate a subset of miRNAs that may play an important role in the pathophysiology or pathogenesis of central nervous system (CNS) lupus.
MicroRNAs are small, non-coding RNAs that inhibit mRNA translation.16–19 Computational analysis and experimental approaches suggest that the expression of several genes can be regulated by a single miRNA and the expression of a single gene can be controlled by several miRNAs.20,21 MicroRNAs have been implicated in the regulation of important cellular processes including cell-cycle regulation,22 immune responses,23 and cellular metabolism.24 The miRNA expression profiles are signatures of disease that may prove diagnostically useful as biomarkers.21,25 MicroRNA regulates one-third of the human genes26 and has been examined in a number of neuroinflammatory and neurodegenerative diseases including Alzheimer's disease,27 Parkinson's disease,28 schizophrenia,14 and stroke.29–31 Alteration of miRNA expression in lupus was first reported by Dai et al.32–34 who studied the relationship in patient peripheral blood mononuclear cells and renal biopsies. More recently, associations between miRNA expression and the integrity of the BBB were shown in ischaemia.35
This study aims to identify the miRNAs that regulate integrity of the brain endothelial cell layer treated with lupus serum or C5a. In this experimental model, miRNA expression profiles were interrogated by Affymetrix miRNA Array. The results reveal altered miRNA profiles for each experimental treatment. Seven miRNAs were differentially expressed from control in both lupus serum and C5a treatments. These miRNA, which are the signature of C5a-induced BBB alterations in experimental lupus models, could represent potential therapeutic targets for lupus-associated neurological disease. As miRNA begin as hairpin clusters of primary miRNAs and are converted to premiRNA by the enzyme Drosha36 and are finally converted to mature miRNA by the enzyme Dicer,37,38 we assessed the mRNA expression of the enzymes Drosha36,39,40 and Dicer. Our results indicate no change in the miRNA biogenesis. To determine whether the results obtained in cultured cells could be extrapolated in vivo, we studied miRNA expression in brains of the lupus mouse model, MRL/lpr mice. Our studies for the first time identified miRNA altered by C5a in the brain endothelial cells, and show comparable changes both in vitro and in vivo, in mice.
Materials and methods
Brain endothelial cells in culture
Brain endothelial cells (American Type Tissue Culture Collection, Rockville, MD), an immortalized mouse brain endothelial cell line,41 were used for these studies. These cells were found to behave similar to primary culture in our earlier studies.3 Cells were seeded at a density of 0·5 × 104 to 1·0 × 104 cells/cm2 onto tissue culture-treated plastic ware and grown in Dulbecco's modified Eagle's medium with 4·5 g/l glucose, 3·7 g/l sodium bicarbonate, 4 mm glutamine, 10% fetal calf serum and 100 U/ml of penicillin and streptomycin. All cells were maintained at 37° in a humidified atmosphere of 5% CO2 and 95% air. Cells stained positively with platelet endothelial cell adhesion molecule (PECAM) and agglutinin, indicating their endothelial characteristics.
Treatment of cells
Cells were separated into groups. Cells in group 1 were treated with serum isolated from 20-week-old control mice (MRL+/+ mice), group 2 was treated with lupus serum from 20-week-old MRL/lpr mice, group 3 cells were treated with 10 nm C5a (Cat No. 2150-C5-025/CF, R&D Systems Inc., Minneapolis, MN), group 4 cells were treated with lupus serum + 1 μm C5aR agonist [C5aRa; acetyl-Phe-(Orn-Pro-d-cyclohexylalanine)-Trp-Arg], obtained from Dr John Lambris (University of Pennsylvania, Philadelphia, PA) and group 5 cells were treated with lupus serum + anti-C5L2 (Douglas L. Feinstein, University of Illinois, Chicago, IL42). After the cells reached confluence, the medium was replaced with Dulbecco's modified Eagle's medium (Gibco BRL, Chagrin Falls, OH) with 2% fetal bovine serum for synchronization. Cells were subjected to the different treatments (5% control serum, 5% lupus serum, 10 nm C5a) for 3 hr. The cells were observed using a Zeiss microscope.
Integrity of the endothelial monolayer
The integrity of the endothelial monolayer was determined by three different experiments: movement of dextran across the monolayer, accessibility of IgG into the cell and transendothelial electrical resistance (TEER).
To determine the permeability characteristics of the endothelial layer, transwell inserts (Corning Enterprises, Corning, NY, 48-well, 3-mm pore) were coated with collagen and bEnd3 cells were seeded at a density of 30 000 cells per well. Cells were then cultured for another 24 hr. Control serum, lupus serum, C5a or lupus serum + C5aRa was added to the medium for 3 hr. FITC-Dextran (25 mg/ml, Sigma-Aldrich Corp., St Louis, MO) was added to the top of the inserts. After 30 min the absorbance of the solution in each well was measured at 492 nm (n = 6 wells each).
To examine accessibility of cytoplasm to immunoglobulins, monolayers of endothelial cells were treated with control serum or control serum spiked with C5a for 45 min. Slides were then rinsed with several changes of PBS and incubated for 45 min in FITC-labelled goat anti-mouse IgG (Cappel 1 : 300 in PBS). Cells were incubated with wheat germ agglutinin (WGA) (staining of cell membrane) and DAPI (nucleus). Cells were rinsed with several changes of PBS and fixed (fixative: 3·7% formaldehyde, 0·05% glutaraldehyde, 0·25 m sucrose, 1 mm EGTA, 0·5 mm EDTA, 20 mm HEPES, pH 7·4) for 20 min at 37°. Preparations were rinsed with several changes of PBS. Mounted slides were viewed with an Olympus BX-60 IF microscope (Carter Valley, PA). Representative photomicrographs were taken at identical settings with a Hamamatsu EM-CCD camera (Bridgewater, NJ). Brightness and contrast alterations were applied identically on captured images using adobe photoshop cs3 (Adobe Systems, San Jose, CA).
Measurements of TEER were performed to determine whether C5a produced changes in the endothelial cell monolayer integrity. As resistance is inversely proportional to permeability, TEER was measured across confluent bEnd3 monolayers using the electrical cell substrate impedance sensing system (Applied Biophysics, Troy, NY) as previously described.3,43 The ECIS system provides real-time monitoring of changes in TEER. Readings were continuously aquired at 4000 Hz at 60 min intervals. In brief, cells were cultured on small gold electrodes (10−4 cm2), and culture medium was used as an electrolyte. Cells were evaluated daily by microscopy to ascertain when confluence was obtained. Cells were confluent after 7 days with the average baseline TEER of 1230 Ω cm2. These cells have higher resistance compared with other capillary endothelium because they lack fenestrations, have fewer pinocytic vesicles, and specialized junctional complexes.44 Cells were treated with 5% control serum, 5% lupus serum, control serum + C5a, lupus serum + C5aRa, and lupus serum + anti-mouse C5L2. TEER values were obtained before treatment (baseline) and after treatment, and are expressed as relative changes in TEER values as a percentage of the baseline value.45
RNA isolation from mouse brain endothelial cells
Total RNA (including miRNA) was isolated from cultured endothelial cells using a miRNeasy Mini Kit (Qiagen, Valencia, CA). The concentration and integrity of total RNA was determined using a NanoDrop-1000 spectrophotometer (Thermo Scientific, Wilmington, DE) and Agilent 2100 Bioanalyzer (Agilent Technologies, Santa Clara, CA). Only samples with a RIN (RNA Integrity Number) above eight were used for miRNA array analysis, RNA samples were stored at −80° before TaqMan miRNA array studies.
Affymetrix miRNA arrays
GeneChip® miRNA Array (Affymetrix P/N 901324; Affymetrix, Santa Clara, CA) were used to profile 609 mature mouse miRNAs. U6 was used as the endogenous control in quadruplicate and one assay not related to mouse was included as a negative control. The miRNA was isolated from each group (n = 3): control-serum-treated, lupus-serum-treated, and C5a-treated endothelial cells. The concentration of the RNA was determined by the NanoDrop® ND-1000 spectrophotometer (NanoDrop Technologies, Wilmington, DE). The samples were then labelled using the FlashTag™ Biotin HSR Labeling Kit and subjected to miRNA arrays according to the manufacturer's instructions. Detailed protocol for the labelling and hybridization of the sample to the arrays is given at http://www.genome.duke.edu/cores/microarray/services/affymetrix/documents/FlashTag-Biotin-HSR-for-Affymetrix-Feb2011.pdf. Spikes in control probe sets reveal that the labelling, polyA tailing and ligation were successful.
Cycle threshold scores > 35 are considered to be non-specific (undetectable) so miRNAs in which 95% of individual observations had a raw cycle threshold score > 35 were excluded from the final data analysis.46,47 Using these filtering criteria, we excluded 291 miRNAs from the analysis and continued to evaluate 318. Partek Genomics Suite (Partek, St Louis, MI) was used to carry out statistical analyses. Fold change filters of 1·25-fold were applied to select the miRNAs that were regulated to improve our sensitivity to detect important miRNAs. A t-test with false discovery rate (FDR) of 5% (i.e. no more than 5% false positives) correction for multiple comparisons was used to examine the significance of miRNAs regulated in each experimental condition compared with that of the untouched control group. MicroRNAs that changed ≥ 1·25-fold and had a P < 0·05 were subjected to hierarchical clustering using Euclidean distance on the basis of their relative mean expression.
Validation of microarray profiling results by quantitative real-time PCR
The results obtained from the array were validated by real-time quantitative RT-PCR (qRT-PCR) assays. The qRT-PCR was performed according to the manufacturer's instructions (Exiqon, Vedbaek, Denmark). Each group had five samples: three from the microarray studies and two additional samples not used in the microarray studies. Briefly, 20 ng (5 ng/μl) of total RNA from each sample was reverse-transcribed to cDNA using the Exiqon Universal cDNA synthesis kit. Samples were incubated with appropriate enzyme mix for 60 min at 42° and heat inactivated for 5 min at 95°. Primers were obtained commercially for mmu-SNORD65, miR-320a, miR-28*, miR-26b and miR-193* from Exiqon corporation, Denmark. The cDNA was in turn amplified in 10-μl reactions as follows: Exiqon SYBR Green master mix (5 μl), PCR primer mix (1 μl), and dilute cDNA templates (80× dilution from reverse transcription, 4 μl). A no-template control was used as a negative control. Critical threshold values were determined using abi prism 7900 sds software (Applied Biosystems, Foster City, CA) and the following programme: 50° for 2 min, 95° for 10 min and 40 cycles at 95° for 10 seconds and 60° for 1 min. Amplification plots and dissociation curves were satisfactory for the miRNAs assessed. The relative quantity of each miRNA was normalized to SNORD65 expression for each sample and expressed as a fold change relative to the mean control value.
Quantitative mRNA RT-PCR in endothelial cells
The mRNA expression of the enzymes Drosha, and Dicer were evaluated in brain endothelial cells treated with lupus serum or C5a and compared with cells treated with control serum (n = 5 in each group) by real-time PCR using the SYBR-Green method as described earlier.48 Total RNA was isolated by Trizol reagent (Life Technologies, Grand Island, NY) and qRT-PCR was carried out using Syber Green. Glyceraldehyde-3-phosphate dehydrogenase (GAPDH) and 18s rRNA were used as internal controls. Primers were synthesized by Integrated DNA Technologies (Coralville, IA) and the sequences of the primers designed using primer express3 are as follows:
| mDrosha (NM_026799.3 GI:194306544) | 5′-gcagtgttgtctgaccctga-3′ (forward) |
| 5′-ggccatctggggaaagttat.-3′ (reverse) | |
| mDicer1-(NM_148948.2 GI:117168270) | 5′- acgaaatgcaaggaatggac -3′ (forward) |
| 5′- gtacacctgccagaccacct -3′ (reverse) |
The PCR was performed in AB7700 SDS V1.7 (Applied Biosystems) with the programme: 50° for 2 min, 94° for 10 min and 40 cycles at 94° for 15 seconds and 60° for 1 min. To validate the quantitative real-time RT-PCR protocol, melting curve analysis was performed to check for the absence of primer dimers. Using a standard curve generated from serial dilutions of brain cDNA, the ratio of mRNA expression relative to GAPDH expression was calculated for each group, and normalized relative to an average of ratios from the control group.
MicroRNA qRT-PCR in cortical brain of lupus mice
This study was carried out in strict accordance with the recommendations in the Guide for the Care and Use of Laboratory Animals of the National Institutes of Health. The protocol was approved by the IACUC (Institutional Animal Care and Use Committee), University of Chicago (ACUP-71552). Tissue harvest was performed under isoflurane anaesthesia, and all efforts were made to minimize suffering.
Serum C5a levels were measured by ELISA using anti-mouse C5a antibodies purchased from BD Bioscience (San Jose, CA). ELISA plates were coated with 2 mg/ml purified rat anti-mouse C5a mAb (BD Biosciences, San Jose, CA) for overnight at 4°. Sera from control or lupus mice were added, and the biotinylated rat anti-mouse C5a detection antibody (BD Biosciences) was applied at a concentration of 2 mg/ml. Assays were developed with tetramethylbenzidine conductivity substrate (BioFX Laboratories, Owings Mills, MD), and the OD value was measured at 450 nm. A word of caution: because the ELISA measures both C5a and C5a-desArg, it is most likely measuring C5a-desArg. However, since C5a-desArg is a breakdown product of C5a, it was used as a measure of C5a in this study.
Cortical brain tissue was harvested from 20-week-old mice (n = 4 control MRL+/+ mice, and n = 5 lupus MRL/lpr mice and n = 5 MRL/lpr mice treated with C5aRa [acetyl-Phe-(Orn-Pro-d-cyclohexylalanine)-Trp-Arg] obtained from Dr Lambris (University of Pennsylvania, Philadelphia, PA). Based on our earlier studies49 60 mg/kg/day C5aRa was administered continuously using osmotic pumps (Alzet model 2001; Durect Corporation, Cupertino, CA) that were inserted subcutaneously using sterile surgical techniques. Messenger RNA was isolated from brain tissue using Trizol (Life Technologies) according to the manufacturer's instructions followed by isolation with miRNeasy Mini Kit (Qiagen). The cDNA synthesis and SYBR Green qRT-PCR were performed as described above for mmu-SNORD65, miR-320a, miR-193*, miR-28* and miR-26b.
Biological functional analyses of microRNAs regulated in endothelial cells
The miRNAs used for biological functional analyses were differentially expressed (P < 0·05) > 1·25-fold in endothelial cells. Predicted target genes (mRNAs) of miRNAs regulated were determined using publicly available software suites MetA Mir:target Inference (MAMI) (http://mami.med.harvard.edu).50 This software makes composite predictions using several different algorithms, including TargetScanS, miRanda, microT, miRtarget, and PicTar. The miRNA and predicted mRNA target genes were then subjected to biological function analyses using ingenuity pathway analysis (IPA) software (Ingenuity Systems, Redwood City, CA).
Statistical analysis
All data are presented as means ± SE and were analysed using minitab 12 statistical software (Minitab, State College, PA). For comparisons between two groups, t-testing was used for parametric data and Mann–Whitney testing for non-parametric data. Analysis of variance with Holm–Sidak correction was used when comparing more than two groups. Potential correlations among variables were determined by calculating Pearson product moment correlation coefficients and their P-values. Significance was determined as P < 0·05. All P-values presented are corrected for multiple testing unless otherwise noted.
Results
Endothelial cells are structurally altered by challenge with lupus serum or C5a
Brain endothelial cells were challenged with control serum, lupus serum, or control serum with C5a and harvested 3 hr later. Both lupus serum and C5a altered brain endothelial cell morphology when compared with controls at 3 hr (Fig.1). Treated cells looked more rounded with loss of traditional cobblestone appearance as indicated by the arrow in Fig.1. The observed changes motivated us to assess the endothelial layer integrity in subsequent experiments.
Figure 1.
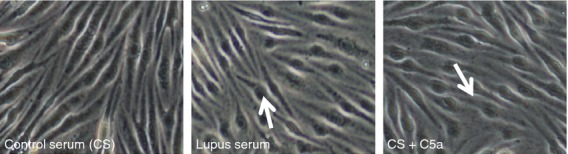
Confocal microscopy of treated endothelial monolayers. Representative pictures of endothelial monolayer (bEnd3 cells) treated with lupus serum and C5a for 3 hr. Pictures were taken with a Zeiss confocal microscope. Treated cells reveal structural alterations including rounding (indicated by arrow in treated cells) and increased distance between neighbouring cell borders compared with controls.
C5a and lupus serum causes the endothelial layer to become ‘leaky’
To determine whether the endothelial cells were affected, three different assessments were made.
bEnd3 cells were treated with control serum or serum spiked with C5a for 3 hr. FITC-labelled IgG was added to the medium for 45 min. Cells treated with C5a allowed infiltration of immune complexes indicating a loss of endothelial layer integrity while negligible IgG complexes were found in control cells (Fig.2a).
To determine whether the visible structural changes were associated with changes in permeability, we performed an in vitro permeability assay. The effects of control serum, lupus serum or C5a were assessed on bEnd3 cells seeded onto collagen-coated transwell inserts (Corning, 48-well, 3-mm pore). FITC-dextran was added to the well, and fluorescence was detected in the bottom wells. Our results show that lupus serum and C5a significantly increases the permeability of bEnd3 cells and the C5aRa can block the effect of C5a on cell permeability, thereby preventing the increase in permeability (Fig.2b).
As an in vitro analogue to BBB integrity, TEER was measured across bEnd3 monolayers after challenge with different conditions as described in the Materials and methods. TEER allows the evaluation of the ‘tightness’ or ‘leakiness’ of a layer by measuring continuously the complex impedance, providing readouts for impedance, resistance and capacitance. Monolayers were studied after reaching confluence with an average TEER of 1230 Ω cm2.44 TEER values were reduced in lupus-serum-treated cells (87·5 ± 1·4%) and C5a-treated cells (92·1 ± 1·6%) compared with cells treated with control serum (Fig.2c). These results parallel our earlier studies that indicate the importance of C5a in maintaining endothelial layer integrity.
Figure 2.
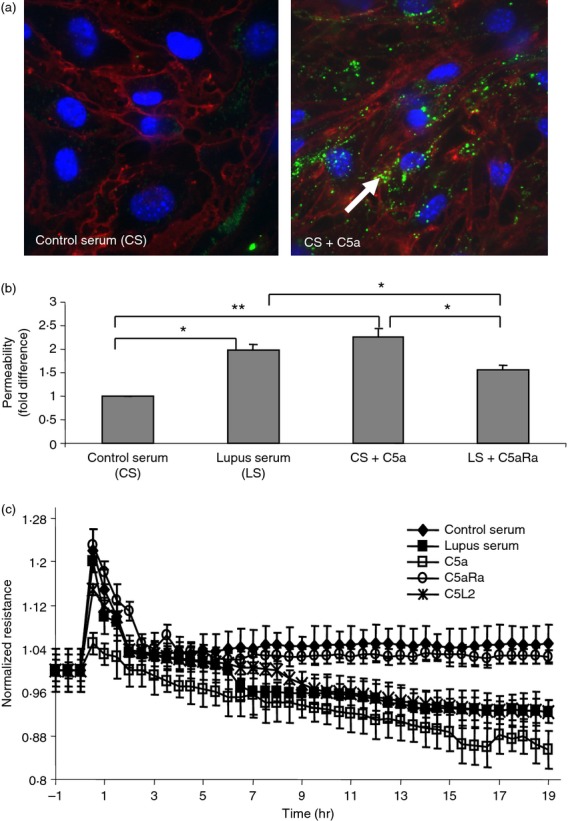
Permeability is altered in treated endothelial cells. (a) bEnd3 cells were treated with control serum or serum spiked with C5a for 3 hr. FITC-labelled IgG was added to the medium for 45 min. Cells treated with C5a allowed infiltration of immune complexes indicating a loss of endothelial layer integrity while negligible IgG complexes were found in control cells. Cell membranes were stained red with wheatgerm agglutinin and nuclei were stained blue with DAPI. (b) To determine the response of bEnd3 cells to C5a, cells were seeded onto collagen-coated transwell inserts and treated with control serum, lupus serum or C5a. FITC-dextran was added to the upper well, and fluorescence was detected in the bottom wells. Lupus serum (P < 0·05) and C5a (P < 0·025) increase the permeability of bEnd3 cells and the C5aR antagonist, C5aRa, can block the effect of C5a on cell permeability. (c) To determine the effect of C5a/C5aR signalling on endothelial cell barrier function bEnd3 monolayer grown to confluence on gold microelectrodes was treated with control serum, MRL/lpr serum, control serum + C5a, lupus serum + C5aRa and lupus serum + anti-C5L2 at 0 time-point and transendothelial electrical resistance (TEER) was monitored over time. Changes in TEER (%) are expressed as mean ± SE. Pooled data from three independent experiments are shown. Increased permeability was observed in cells treated with 5% lupus serum or 10 nm C5a in 5% control serum relative to controls treated with 5% control serum. Addition of C5aRa to lupus serum reduced the change in permeability while anti-C5L2 did not affect the permeability. *P = 0.05, **P = 0.025.
Differential endothelial cell miRNA expression profiles are induced by lupus serum and C5a
To determine the specific miRNAs altered in lupus and by C5a, we evaluated the miRNA expression for each treatment using cluster analysis. A unique miRNA expression pattern was observed in endothelial cells treated with lupus serum and C5a. For the three expression profiles shown, no profile was identical. The different miRNA expression patterns emphasize the uniqueness of the different miRNA responses by the cells for each treatment (Fig.3).
Figure 3.
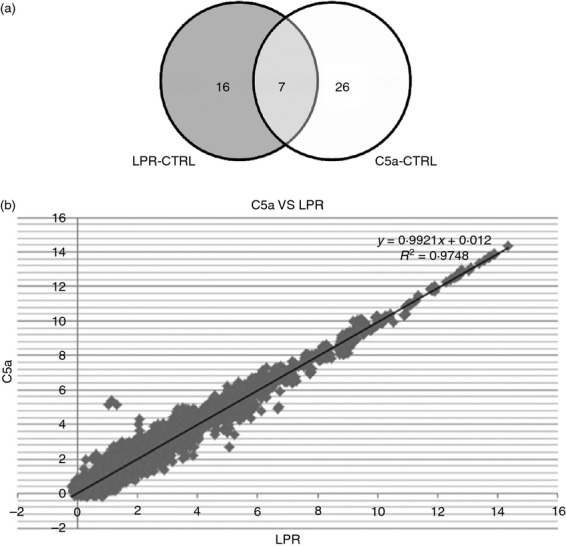
Correlation of lupus serum and C5a-treated samples. (a) Venn diagram showing the numbers of microRNAs (miRNAs) that were regulated > 1·25-fold in cells treated with lupus serum or C5a compared with controls. In all, 23 miRNA were altered by lupus treatment and 33 by C5a treatment. Seven miRNA were altered by both treatments. The identity of the miRNA altered by both treatments is given in Table1. (b) Signal correlation plot between the MRL/lpr serum- and C5a-treated samples analysed. Scarlet plots of the correlation between expression values between endothelial cells treated with lupus serum and C5a were evaluated by Pearson correlation (correlation: 97·5%).
A number of miRNAs were differentially expressed in bEnd3 cells following treatment with lupus serum or C5a treatment as compared with control serum. After imposing a 1·25-fold change in minimum threshold, expression of 98 miRNA was increased and 120 miRNA were decreased in lupus-serum-treated cells compared with control-serum-treated cells. However, when an FDR < 0·05 threshold was set to further define the miRNA altered (Fig.3a), only 10 miRNA were increased and 13 miRNA were decreased significantly (P < 0·05) (see Supporting information; Table S1A). In line with the filtering of miRNA with lupus serum treatment, expression of 106 miRNA was increased and 120 miRNA were decreased in C5a treated cells compared with control-serum-treated cells (1·25-fold minimum change). Of these miRNA, only 16 miRNA were increased and 17 miRNA were decreased significantly (FDR, 0·05) (Table S1B). Seven miRNAs, mmu-miR-133a*, mmu-miR-193*, mmu-miR-26b, mmu-miR-28*, mmu-miR-320a, mmu-miR-423-3p and mmu-miR-509-5p were up-regulated or downregulated by both treatments (Table1). Despite the overlap of only seven miRNA genes at a FDR P < 0·05 and 1·25-fold change threshold, the expression of these seven miRNA was significantly correlated between lupus serum and C5a treatments (97·5%, Fig.3b). mmu-SNORD65 was used as the endogenous control for all of the data reported in this study because it was the most stably expressed miRNA across all subjects in the control and experimental groups.
Table 1.
Differentially expressed microRNAs overlapping between lupus serum and C5a treatments
| Probe set ID | Fold-change (LPR versus CTRL) | Fold-change (C5 versus CTRL) |
|---|---|---|
| mmu-miR-133a* | −1·47524 | −1·62287 |
| mmu-miR-193* | −1·72925 | −2·07395 |
| mmu-miR-26b | 1·5237 | 1·53991 |
| mmu-miR-28* | 2·52412 | 2·21433 |
| mmu-miR-320a | −1·37782 | −1·44263 |
| mmu-miR-423-3p | −1·39494 | −1·42117 |
| mmu-miR-509-5p | −1·39075 | −1·63207 |
Quantitative RT-PCR substantiates microarray miRNA expression alterations
MicroRNA RT-PCR assays are specific for mature miRNAs, discriminate among related miRNAs that differ by as little as one nucleotide and are not affected by genomic DNA contamination.51 Therefore, qRT-PCR miRNA assays are a sensitive and accurate method for assessing miRNA expression. Using commercially available primer pairs we validated the results obtained by microarray platform. We assessed the expression of the commonly regulated miRNAs including two down-regulated (miR-320a and miR-193*) and two up-regulated (miR-26b and miR-28*) miRNAs by qRT-PCR. A strong correlation between our microarray profiling and real-time RT-PCR data was found (Fig.4). miR-320a was decreased significantly in the C5a group (78·3% of control, P = 0·004). miR-193* was decreased in the C5a group (63·1% of control, P = 0·010) and in the lupus serum group (82·8% of control, P = 0·150). miR-26b was increased significantly in the C5a group (6·19-fold, P = 0·0037) and the lupus serum group (4·23-fold, P = 0·036). Analogous to the array data, miR-28* was increased 1·97-fold in the C5a group and 2·33-fold in the lupus serum group, but failed to reach statistical significance (P = 0·177). The qRT-PCR results presented here suggest that the microarray data were reliable to warrant further analysis.
Figure 4.
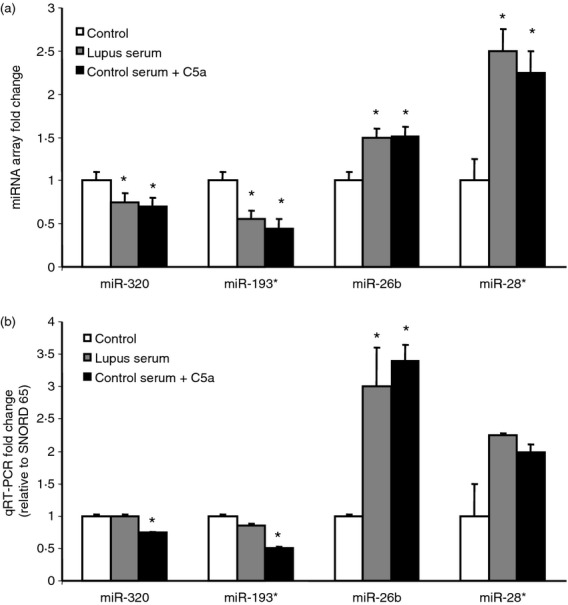
Quantitative RT-PCR validates microarray data. (a) Fold change of microRNA (miRNA) from the array is provided for comparison. (b) MicroRNA expression is given as fold change relative to SNORD65 and normalized to the control. Quantitative (q) RT-PCR validation shows a strong correlation between the microarray and real-time qRT-PCR data. *Significant comparison to control with P < 0·05 after multiple comparison correction. n = 3/group for microarray, n = 5/group for qRT-PCR.
C5a and lupus serum do not effect miRNA synthesis gene expression in endothelial cells
Quantitative real-time PCR analysis showed no significant changes in the mRNA expression of the RNases Drosha and Dicer, in brain endothelial cells treated with C5a or lupus serum when compared with cells treated with control serum (results not shown).
miRNA expression is altered in cortical brain tissue of lupus mice
Complement activation results in increased generation of C5a. We determined the circulating levels of C5a in control and MRL/lpr mice by ELISA. C5a levels were significantly increased in MRL/lpr mouse serum (8·8 ± 0·7 ng/ml, P < 0·02) compared with control serum (3·9 ± 0·2, ng/ml).
Results obtained in vitro could differ from those in vivo due to differences in environment. To determine the capability of extrapolation of results obtained from cells in culture to mouse brain in vivo in this setting, expression levels of representative miRNA genes was assessed. Expression levels of the four miRNA genes validated in the endothelial cells above were evaluated in cortical brain tissue of control, MRL/lpr, lupus mice and lupus mice treated with C5aRa (Fig.5). Analogous to the endothelial cell model, expression of two miRNAs altered in vitro, miR-26b and miR-28* were up-regulated in lupus mice (2·22-fold, P < 0·031, 2·77-fold, P < 0·028, respectively), which was reduced in lupus mice treated with the C5aRa (1·61-fold, P < 0·045, 1·73-fold, P < 0·05). miR-320a and miR-193*, which were down-regulated in the microarray analysis, were not significantly changed in the brain of MRL/lpr, lupus mice (data not shown).
Figure 5.
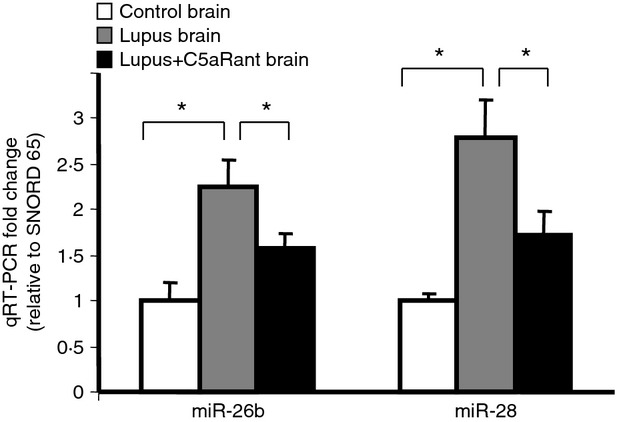
Quantitative (q) RT-PCR substantiates the microRNA (miRNA) alterations in endothelial cells, in vivo. RNA was isolated from brain cortex of 20-week-old control, MRL/lpr and MRL/lpr treated mice and subjected to qRT-PCR. The miRNA expression is given as fold change relative to SNORD65 and normalized to the control. Quantitative RT-PCR reveals differential expression of the miRNA genes also up-regulated in endothelial cells. *Significant comparison to control with P < 0·05. n = 4 for control, n = 5 for lupus mice, n = 5 for C5aR antagonist-treated lupus mice.
Function analysis of microRNAs regulated in endothelial cells by both treatments
A biological function analysis was carried out on the miRNAs regulated by both treatments. Five miRNAs (mmu-miR-133a*, mmu-miR-193*, mmu-miR-320a, mmu-miR-423 and mmu-miR-509) were down-regulated, and two miRNAs (miR-26b, and miR-28*) were up-regulated by both treatments (Table2). Limited information is available regarding mmu-miR-509. Recently, it was identified in cerebrospinal fluid and other body fluids, and could be a potential marker for dyslipidaemia in metabolic disorders.52 The top five ranked biological functions associated with commonly up-regulated miRNAs include cell cycle, cellular growth and proliferation, cellular development, extracellular matrix and cell death. The top five ranked biological functions associated with commonly down-regulated miRNAs include cell death, haematological development and function, organ development, cardiovascular system development and function, cellular development.
Table 2.
Significant targets for the microRNAs that were significantly (P < 0·05) altered with both treatments
| Probe | Target gene | |
|---|---|---|
| mmu-miR-133a* | Sgms2 | Sphingomyelin synthase 2 |
| mmu-miR-133a* | Ptprz1 | Protein tyrosine phosphatase, receptor type Z, polypeptide 1 |
| mmu-miR-133a* | Acat3 | Acetyl-Coenzyme A acetyltransferase 3 |
| mmu-miR-133a* | Ptprk | Protein tyrosine phosphatase, receptor type, K |
| mmu-miR-133a* | Tmod3 | Tropomodulin 3 |
| mmu-miR-133a* | Rarb | Retinoic acid receptor, beta |
| mmu-miR-133a* | Clta | Clathrin, light polypeptide (Lca) |
| mmu-miR-193* | Caprin1 | Cell cycle associated protein 1 |
| mmu-miR-193* | Cxxc4 | CXXC finger 4 |
| mmu-miR-193* | Col4a6 | Collagen, type IV, alpha 6 |
| mmu-miR-193* | Bcl2l2 | BCL2-like 2 |
| mmu-miR-26b | Hgf | Hepatocyte growth factor |
| mmu-miR-26b | Htr1a | 5-Hydroxytryptamine (serotonin) receptor 1A |
| mmu-miR-26b | Tlr3 | Toll-like receptor 3 |
| mmu-miR-26b | Mapk6 | Mitogen-activated protein kinase 6 |
| mmu-miR-26b | Cdk8 | Cyclin-dependent kinase 8 |
| mmu-miR-26b | Rap2c | RAP2C, member of RAS oncogene family |
| mmu-miR-26b | Bfar | Bifunctional apoptosis regulator |
| mmu-miR-26b | Pgr15l | G protein-coupled receptor 15-like |
| mmu-miR-26b | Col10a1 | Collagen, type X, α1 |
| mmu-miR-26b | Mtap2 | Microtubule-associated protein 2 |
| mmu-miR-26b | Faim | Fas apoptotic inhibitory molecule |
| mmu-miR-26b | Prkcq | Protein kinase Cθ |
| mmu-miR-26b | Irf4 | Interferon regulatory factor 4 |
| mmu-miR-28* | C1qtnf1 | C1q and tumour necrosis factor related protein 1 |
| mmu-miR-320a | Pcdh19 | Protocadherin 19 |
| mmu-miR-320a | Map3k2 | Mitogen-activated protein kinase kinase kinase 2 |
| mmu-miR-320a | N4bp1 | NEDD4 binding protein 1 |
| mmu-miR-320a | Cdh20 | Cadherin 20 |
| mmu-miR-320a | Cdh2 | Cadherin 2 |
| mmu-miR-320a | Ctsl | Cathepsin L |
| mmu-miR-320a | Thbs1 | Thrombospondin 1 |
| mmu-miR-320a | Mapk1 | Mitogen-activated protein kinase 1 |
| mmu-miR-320a | Triap1 | TP53 regulated inhibitor of apoptosis 1 |
| mmu-miR-423-3p | Atf6 | Activating transcription factor 6 |
| mmu-miR-423-3p | N4bp2l2 | NEDD4 binding protein 2-like 2 |
Discussion
The complement system plays a key role in lupus pathogenesis, but their regulation and mechanism of action remain incompletely understood. Studies that determine the association of complement proteins and miRNA are limited.15,53,54 This study attempts to determine the connecting links between the complement protein, C5a and miRNA. To our knowledge, this is the first study demonstrating the miRNA expression profile in brain endothelial cells and its regulation by complement. Real-time qRT-PCR analysis verified the results of the microarray study and showed that the microarray data were consistent and reliable. A major finding of this study is that miRNA expression is altered by treatment with both lupus serum and C5a. A number of miRNAs were significantly regulated (P < 0·05) after each treatment. Seven miRNAs were up-regulated or down-regulated in endothelial cells by both treatments. Earlier studies have shown that C5a alters genes that regulate cell adhesion molecules, chemokines/cytokines and related receptors in HUVEC cells.13 However, the miRNA altered in this study regulate different genes. Brain endothelial cells are known to be structurally different from endothelial cells at other locations. In addition, our studies demonstrate that the mRNA expression of the miRNA synthetic RNases Drosha and Dicer were not altered, suggesting that miRNA synthetic machinery was not responsible for the observed miRNA changes in CNS lupus. Finally, our studies reveal that the changes in miRNA expression that occurred in endothelial cells in culture can be translated to in vivo studies. Our results showed that miR-26b and miR-28* are up-regulated in murine brain cortex in an analogous fashion to the bEnd3 cells.
MicroRNAs are attractive candidates as regulators of CNS pathology. However, the miRNA/mRNA relationship is a very complex one. MicroRNA exhibit redundancy and can post-transcriptionally regulate entire sets of genes.55,56 The reverse has also been shown where mRNAs and/or their protein products can regulate the expression of miRNAs, also sometimes referred to as the feed-forward mechanism.57,58 Furthermore, increased gene expression could result by the binding of the miRNA to the promoter. This process is called RNA-induced gene activation.59 Therefore alteration of miRNA could have a number of consequences. In addition, studies have shown their possible involvement in neurodegeneration.60–63 The present study reveals a number of miRNAs that are specifically regulated by each treatment. However, we propose that it is the miRNA response regulated by both treatments that may provide miRNA fingerprints indicative of the mechanisms of injury in this setting. Therefore, we used a bioinformatics approach and analysed potential targets and thereby biological functions for the commonly regulated miRNAs.
A remarkable finding in this study is that the miRNA altered by both treatments regulated genes encoding components that are associated with key functions of the BBB, including junctional proteins such as cadherins and collagen 4 (see Supporting information; Table S2), the major components of the basal lamina, which are key to maintain barrier function. In addition, miRNAs altered by serum or C5a treatment are upstream to transporter, inflammatory, oxidative and apoptotic genes. These findings suggest that abnormal expression of miRNAs may contribute to the pathogenesis of CNS lupus, and could be potential targets for therapeutic intervention. Future studies are required to determine exactly which factors regulate a similar cross-talk by both treatments between the miRNAs and mRNAs in each.
In conclusion, our study has provided the first evidence of altered miRNA expression in C5a-treated brain endothelial cells. The bioinformatics analysis suggests that the altered expression of miRNAs may contribute to the pathogenesis of CNS lupus. To elucidate the role of miRNAs in lupus, additional studies are required to investigate the function and targets of these miRNAs in lupus brains. Experiments along these lines are currently in progress in our laboratory.
Acknowledgments
This study was supported by UL1 RR024999 (JJA), T32GM007019 (ME), R01DK080863 (PNC), HL58064 and support from the Bernie Mac Foundation (JGNG).
Glossary
- miRNA
microRNA
- RT-PCR
real-time PCR
- EC
brain endothelial cells
- TEER
transendothelial electrical resistance
Author's contributions
JJA, PNC, RJQ and JGNG contributed to planning and designing the study; TEER studies; and writing of the manuscript. ME and AJ contributed to the microarray experiment and analysis and real-time PCR analysis; and to manuscript preparation.
Disclosures
The authors declare that no competing interests exist.
Supporting Information
Additional Supporting Information may be found in the online version of this article:
Table S1. MicroRNA Expression Profiles that changed in the cells in each experimental condition as compared to controls.
Table S2. Significant targets for the microRNA that were significantly (P < 0·05) altered with both treatments.
References
- 1.Davson H, Zlokovic BV, Rakic L, Segal MB. An Introduction to the Blood–Brain Barrier. London: Macmillan; 1993. [Google Scholar]
- 2.Abbott NJ, Mendonca LL, Dolman DE. The blood–brain barrier in systemic lupus erythematosus. Lupus. 2003;12:908–15. doi: 10.1191/0961203303lu501oa. [DOI] [PubMed] [Google Scholar]
- 3.Jacob A, Hack B, Chiang E, Garcia JG, Quigg RJ, Alexander JJ. C5a alters blood–brain barrier integrity in experimental lupus. FASEB J. 2010;24:1682–8. doi: 10.1096/fj.09-138834. [DOI] [PMC free article] [PubMed] [Google Scholar]
- 4.Jacob A, Hack B, Chen P, Quigg RJ, Alexander JJ. C5a/CD88 signaling alters blood–brain barrier integrity in lupus through nuclear factor-κB. J Neurochem. 2011;119:1041–51. doi: 10.1111/j.1471-4159.2011.07490.x. [DOI] [PMC free article] [PubMed] [Google Scholar]
- 5.Alexander JJ, Jacob A, Bao L, MacDonald RL, Quigg RJ. Complement-dependent apoptosis and inflammatory gene changes in murine lupus cerebritis. J Immunol. 2005;175:8312–9. doi: 10.4049/jimmunol.175.12.8312. [DOI] [PubMed] [Google Scholar]
- 6.Botto M, Walport MJ. C1q, autoimmunity and apoptosis. Immunobiology. 2002;205:395–406. doi: 10.1078/0171-2985-00141. [DOI] [PubMed] [Google Scholar]
- 7.Morgan BP, Gasque P, Singhrao SK, Piddlesden SJ. Role of complement in inflammation and injury in the nervous system. Exp Clin Immunogenet. 1997;14:19–23. [PubMed] [Google Scholar]
- 8.Nicholson-Weller A, Halperin JA. Membrane signaling by complement C5b-9, the membrane attack complex. Immunol Res. 1993;12:244–57. doi: 10.1007/BF02918256. [DOI] [PubMed] [Google Scholar]
- 9.Muller-Eberhard HJ, Schreiber RD. Molecular biology and chemistry of the alternative pathway of complement. Adv Immunol. 1980;29:1–53. doi: 10.1016/s0065-2776(08)60042-5. [DOI] [PubMed] [Google Scholar]
- 10.Muller-Eberhard HJ. Molecular organization and function of the complement system. Annu Rev Biochem. 1988;57:321–47. doi: 10.1146/annurev.bi.57.070188.001541. [DOI] [PubMed] [Google Scholar]
- 11.Barnum SR, Ames RS, Maycox PR, Hadingham SJ, Meakin J, Harrison D, Parsons AA. Expression of the complement C3a and C5a receptors after permanent focal ischemia: an alternative interpretation. Glia. 2002;38:169–73. doi: 10.1002/glia.10069. [DOI] [PubMed] [Google Scholar]
- 12.Stahel PF, Kossmann T, Morganti-Kossmann MC, Hans VH, Barnum SR. Experimental diffuse axonal injury induces enhanced neuronal C5a receptor mRNA expression in rats. Brain Res Mol Brain Res. 1997;50:205–12. doi: 10.1016/s0169-328x(97)00189-7. [DOI] [PubMed] [Google Scholar]
- 13.Albrecht EA, Chinnaiyan AM, Varambally S, Kumar-Sinha C, Barrette TR, Sarma JV, Ward PA. C5a-induced gene expression in human umbilical vein endothelial cells. Am J Pathol. 2004;164:849–59. doi: 10.1016/S0002-9440(10)63173-2. [DOI] [PMC free article] [PubMed] [Google Scholar]
- 14.Beveridge NJ, Tooney PA, Carroll AP, et al. Dysregulation of miRNA 181b in the temporal cortex in schizophrenia. Hum Mol Genet. 2008;17:1156–68. doi: 10.1093/hmg/ddn005. [DOI] [PubMed] [Google Scholar]
- 15.Lukiw WJ, Surjyadipta B, Dua P, Alexandrov PN. Common micro RNAs (miRNAs) target complement factor H (CFH) regulation in Alzheimer's disease (AD) and in age-related macular degeneration (AMD) Int J Biochem Mol Biol. 2012;3:105–16. [PMC free article] [PubMed] [Google Scholar]
- 16.Ambros V. The evolution of our thinking about microRNAs. Nat Med. 2008;14:1036–40. doi: 10.1038/nm1008-1036. [DOI] [PubMed] [Google Scholar]
- 17.Bartel DP. MicroRNAs: genomics, biogenesis, mechanism, and function. Cell. 2004;116:281–97. doi: 10.1016/s0092-8674(04)00045-5. [DOI] [PubMed] [Google Scholar]
- 18.Chen K, Rajewsky N. Deep conservation of microRNA-target relationships and 3′UTR motifs in vertebrates, flies, and nematodes. Cold Spring Harb Symp Quant Biol. 2006;71:149–56. doi: 10.1101/sqb.2006.71.039. [DOI] [PubMed] [Google Scholar]
- 19.Filipowicz W. RNAi: the nuts and bolts of the RISC machine. Cell. 2005;122:17–20. doi: 10.1016/j.cell.2005.06.023. [DOI] [PubMed] [Google Scholar]
- 20.Selbach M, Schwanhausser B, Thierfelder N, Fang Z, Khanin R, Rajewsky N. Widespread changes in protein synthesis induced by microRNAs. Nature. 2008;455:58–63. doi: 10.1038/nature07228. [DOI] [PubMed] [Google Scholar]
- 21.Guarnieri DJ, DiLeone RJ. MicroRNAs: a new class of gene regulators. Ann Med. 2008;40:197–208. doi: 10.1080/07853890701771823. [DOI] [PubMed] [Google Scholar]
- 22.Matsubara H, Takeuchi T, Nishikawa E, et al. Apoptosis induction by antisense oligonucleotides against miR-17-5p and miR-20a in lung cancers overexpressing miR-17-92. Oncogene. 2007;26:6099–105. doi: 10.1038/sj.onc.1210425. [DOI] [PubMed] [Google Scholar]
- 23.Huang XH, Wang Q, Chen JS, et al. Bead-based microarray analysis of microRNA expression in hepatocellular carcinoma: miR-338 is downregulated. Hepatol Res. 2009;39:786–94. doi: 10.1111/j.1872-034X.2009.00502.x. [DOI] [PubMed] [Google Scholar]
- 24.Gauthier BR, Wollheim CB. MicroRNAs: ‘ribo-regulators’ of glucose homeostasis. Nat Med. 2006;12:36–8. doi: 10.1038/nm0106-36. [DOI] [PubMed] [Google Scholar]
- 25.Lu DP, Read RL, Humphreys DT, Battah FM, Martin DI, Rasko JE. PCR-based expression analysis and identification of microRNAs. J RNAi Gene Silencing. 2005;1:44–9. [PMC free article] [PubMed] [Google Scholar]
- 26.Davis BN, Hata A. Regulation of microRNA biogenesis: a miRiad of mechanisms. Cell Commun Signal. 2009;7:18. doi: 10.1186/1478-811X-7-18. [DOI] [PMC free article] [PubMed] [Google Scholar]
- 27.Hebert SS, Horre K, Nicolai L, Bergmans B, Papadopoulou AS, Delacourte A, De Strooper B. MicroRNA regulation of Alzheimer's Amyloid precursor protein expression. Neurobiol Dis. 2009;33:422–8. doi: 10.1016/j.nbd.2008.11.009. [DOI] [PubMed] [Google Scholar]
- 28.Kim J, Inoue K, Ishii J, Vanti WB, Voronov SV, Murchison E, Hannon G, Abeliovich A. A microRNA feedback circuit in midbrain dopamine neurons. Science. 2007;317:1220–4. doi: 10.1126/science.1140481. [DOI] [PMC free article] [PubMed] [Google Scholar]
- 29.Dharap A, Bowen K, Place R, Li LC, Vemuganti R. Transient focal ischemia induces extensive temporal changes in rat cerebral microRNAome. J Cereb Blood Flow Metab. 2009;29:675–87. doi: 10.1038/jcbfm.2008.157. [DOI] [PMC free article] [PubMed] [Google Scholar]
- 30.Jeyaseelan K, Lim KY, Armugam A. MicroRNA expression in the blood and brain of rats subjected to transient focal ischemia by middle cerebral artery occlusion. Stroke. 2008;39:959–66. doi: 10.1161/STROKEAHA.107.500736. [DOI] [PubMed] [Google Scholar]
- 31.Sepramaniam S, Armugam A, Lim KY, Karolina DS, Swaminathan P, Tan JR, Jeyaseelan K. MicroRNA 320a functions as a novel endogenous modulator of aquaporins 1 and 4 as well as a potential therapeutic target in cerebral ischemia. J Biol Chem. 2010;285:29223–30. doi: 10.1074/jbc.M110.144576. [DOI] [PMC free article] [PubMed] [Google Scholar]
- 32.Dai R, Zhang Y, Khan D, Heid B, Caudell D, Crasta O, Ahmed SA. Identification of a common lupus disease-associated microRNA expression pattern in three different murine models of lupus. PLoS One. 2010;5:e14302. doi: 10.1371/journal.pone.0014302. [DOI] [PMC free article] [PubMed] [Google Scholar]
- 33.Dai Y, Sui W, Lan H, Yan Q, Huang H, Huang Y. Comprehensive analysis of microRNA expression patterns in renal biopsies of lupus nephritis patients. Rheumatol Int. 2009;29:749–54. doi: 10.1007/s00296-008-0758-6. [DOI] [PubMed] [Google Scholar]
- 34.Dai Y, Huang YS, Tang M, Lv TY, Hu CX, Tan YH, Xu ZM, Yin YB. Microarray analysis of microRNA expression in peripheral blood cells of systemic lupus erythematosus patients. Lupus. 2007;16:939–46. doi: 10.1177/0961203307084158. [DOI] [PubMed] [Google Scholar]
- 35.Rink C, Khanna S. MicroRNA in ischemic stroke etiology and pathology. Physiol Genomics. 2011;43:521–8. doi: 10.1152/physiolgenomics.00158.2010. [DOI] [PMC free article] [PubMed] [Google Scholar]
- 36.Lee Y, Ahn C, Han J, et al. The nuclear RNase III Drosha initiates microRNA processing. Nature. 2003;425:415–9. doi: 10.1038/nature01957. [DOI] [PubMed] [Google Scholar]
- 37.Han Y, Liu Y, Gui Y, Cai Z. Inducing cell proliferation inhibition and apoptosis via silencing Dicer, Drosha, and Exportin 5 in urothelial carcinoma of the bladder. J Surg Oncol. 2013;107:201–5. doi: 10.1002/jso.23214. [DOI] [PubMed] [Google Scholar]
- 38.Lehrbach NJ, Miska EA. Regulation of pre-miRNA processing. Adv Exp Med Biol. 2010;700:67–75. [PubMed] [Google Scholar]
- 39.Lee Y, Han J, Yeom KH, Jin H, Kim VN. Drosha in primary microRNA processing. Cold Spring Harb Symp Quant Biol. 2006;71:51–7. doi: 10.1101/sqb.2006.71.041. [DOI] [PubMed] [Google Scholar]
- 40.Lee Y, Kim VN. In vitro and in vivo assays for the activity of Drosha complex. Methods Enzymol. 2007;427:89–106. doi: 10.1016/S0076-6879(07)27005-3. [DOI] [PubMed] [Google Scholar]
- 41.Mitsuuchi Y, Powell DR, Gallo JM. Adenoviral modification of mouse brain derived endothelial cells, bEnd3, to induce apoptosis by vascular endothelial growth factor. Oncogene. 2006;25:954–8. doi: 10.1038/sj.onc.1209142. [DOI] [PubMed] [Google Scholar]
- 42.Gavrilyuk V, Kalinin S, Hilbush BS, Middlecamp A, McGuire S, Pelligrino D, Weinberg G, Feinstein DL. Identification of complement 5a-like receptor (C5L2) from astrocytes: characterization of anti-inflammatory properties. J Neurochem. 2005;92:1140–9. doi: 10.1111/j.1471-4159.2004.02942.x. [DOI] [PubMed] [Google Scholar]
- 43.Garcia JG, Liu F, Verin AD, Birukova A, Dechert MA, Gerthoffer WT, Bamberg JR, English D. Sphingosine 1-phosphate promotes endothelial cell barrier integrity by Edg-dependent cytoskeletal rearrangement. J Clin Invest. 2001;108:689–701. doi: 10.1172/JCI12450. [DOI] [PMC free article] [PubMed] [Google Scholar]
- 44.Bernas MJ, Cardoso FL, Daley SK, Weinand ME, Campos AR. Establishment of primary cultures of human brain microvascular endothelial cells to provide an in vitro cellular model of the blood–brain barrier. Nat Protoc. 2010;5:1265–72. doi: 10.1038/nprot.2010.76. [DOI] [PMC free article] [PubMed] [Google Scholar]
- 45.Easton AS, Abbott NJ. Bradykinin increases permeability by calcium and 5-lipoxygenase in the ECV304/C6 cell culture model of the blood–brain barrier. Brain Res. 2002;953:157–69. doi: 10.1016/s0006-8993(02)03281-x. [DOI] [PubMed] [Google Scholar]
- 46.Schmittgen TD, Lee EJ, Jiang J. High-throughput real-time PCR. Methods Mol Biol. 2008;429:89–98. doi: 10.1007/978-1-60327-040-3_7. [DOI] [PubMed] [Google Scholar]
- 47.Schmittgen TD, Livak KJ. Analyzing real-time PCR data by the comparative CT method. Nat Protoc. 2008;3:1101–8. doi: 10.1038/nprot.2008.73. [DOI] [PubMed] [Google Scholar]
- 48.Jacob A, Hensley LK, Safratowich BD, Quigg RJ, Alexander JJ. The role of the complement cascade in endotoxin-induced septic encephalopathy. Lab Invest. 2007;87:1186–94. doi: 10.1038/labinvest.3700686. [DOI] [PubMed] [Google Scholar]
- 49.Jacob A, Hack B, Bai T, Brorson JR, Quigg RJ, Alexander JJ. Inhibition of C5a receptor alleviates experimental CNS lupus. J Neuroimmunol. 2007;221:46–52. doi: 10.1016/j.jneuroim.2010.02.011. [DOI] [PMC free article] [PubMed] [Google Scholar]
- 50.Jiang J, Gusev Y, Aderca I, Mettler TA, Nagorney DM, Brackett DJ, Roberts LR, Schmittgen TD. Association of microRNA expression in hepatocellular carcinomas with hepatitis infection, cirrhosis, and patient survival. Clin Cancer Res. 2008;14:419–27. doi: 10.1158/1078-0432.CCR-07-0523. [DOI] [PMC free article] [PubMed] [Google Scholar]
- 51.Chen C, Ridzon DA, Broomer AJ, et al. Real-time quantification of microRNAs by stem RT-PCR. Nucleic Acids Res. 2005;33:179. doi: 10.1093/nar/gni178. [DOI] [PMC free article] [PubMed] [Google Scholar]
- 52.Karolina DS, Tavintharan S, Armugam A, et al. Circulating miRNA profiles in patients with metabolic syndrome. J Clin Endocrinol Metab. 2012;97:E2271–6. doi: 10.1210/jc.2012-1996. [DOI] [PubMed] [Google Scholar]
- 53.Yang R, Zheng T, Cai X, et al. Genome-wide analyses of amphioxus microRNAs reveal an immune regulation via miR-92d targeting C3. J Immunol. 2013;190:1491–500. doi: 10.4049/jimmunol.1200801. [DOI] [PubMed] [Google Scholar]
- 54.Li YY, Alexandrov PN, Pogue AI, Zhao Y, Bhattacharjee S, Lukiw WJ. miRNA-155 upregulation and complement factor H deficits in Down's syndrome. NeuroReport. 2012;23:168–73. doi: 10.1097/WNR.0b013e32834f4eb4. [DOI] [PMC free article] [PubMed] [Google Scholar]
- 55.Chan JA, Krichevsky AM, Kosik KS. MicroRNA-21 is an antiapoptotic factor in human glioblastoma cells. Cancer Res. 2005;65:6029–33. doi: 10.1158/0008-5472.CAN-05-0137. [DOI] [PubMed] [Google Scholar]
- 56.Lim LP, Lau NC, Garrett-Engele P, et al. Microarray analysis shows that some microRNAs downregulate large numbers of target mRNAs. Nature. 2005;433:769–73. doi: 10.1038/nature03315. [DOI] [PubMed] [Google Scholar]
- 57.Baltimore D, Boldin MP, O'Connell RM, Rao DS, Taganov KD. MicroRNAs: new regulators of immune cell development and function. Nat Immunol. 2008;9:839–45. doi: 10.1038/ni.f.209. [DOI] [PubMed] [Google Scholar]
- 58.Fazi F, Nervi C. MicroRNA: basic mechanisms and transcriptional regulatory networks for cell fate determination. Cardiovasc Res. 2008;79:553–61. doi: 10.1093/cvr/cvn151. [DOI] [PubMed] [Google Scholar]
- 59.Place RF, Li LC, Pookot D, Noonan EJ, Dahiya R. MicroRNA-373 induces expression of genes with complementary promoter sequences. Proc Natl Acad Sci USA. 2008;105:1608–13. doi: 10.1073/pnas.0707594105. [DOI] [PMC free article] [PubMed] [Google Scholar]
- 60.Bilen J, Liu N, Burnett BG, Pittman RN, Bonini NM. MicroRNA pathways modulate polyglutamine-induced neurodegeneration. Mol Cell. 2006;24:157–63. doi: 10.1016/j.molcel.2006.07.030. [DOI] [PubMed] [Google Scholar]
- 61.Bilen J, Liu N, Bonini NM. A new role for microRNA pathways: modulation of degeneration induced by pathogenic human disease proteins. Cell Cycle. 2006;5:2835–8. doi: 10.4161/cc.5.24.3579. [DOI] [PubMed] [Google Scholar]
- 62.O'Carroll D, Schaefer A. General principals of miRNA biogenesis and regulation in the brain. Neuropsychopharmacology. 2013;38:39–54. doi: 10.1038/npp.2012.87. [DOI] [PMC free article] [PubMed] [Google Scholar]
- 63.Schaefer A, O'Carroll D, Tan CL, Hillman D, Sugimori M, Llinas R, Greengard P. Cerebellar neurodegeneration in the absence of microRNAs. J Exp Med. 2007;204:1553–8. doi: 10.1084/jem.20070823. [DOI] [PMC free article] [PubMed] [Google Scholar]
Associated Data
This section collects any data citations, data availability statements, or supplementary materials included in this article.
Supplementary Materials
Table S1. MicroRNA Expression Profiles that changed in the cells in each experimental condition as compared to controls.
Table S2. Significant targets for the microRNA that were significantly (P < 0·05) altered with both treatments.