Abstract
Camera traps are electrical instruments that emit sounds and light. In recent decades they have become a tool of choice in wildlife research and monitoring. The variability between camera trap models and the methods used are considerable, and little is known about how animals respond to camera trap emissions. It has been reported that some animals show a response to camera traps, and in research this is often undesirable so it is important to understand why the animals are disturbed. We conducted laboratory based investigations to test the audio and infrared optical outputs of 12 camera trap models. Camera traps were measured for audio outputs in an anechoic chamber; we also measured ultrasonic (n = 5) and infrared illumination outputs (n = 7) of a subset of the camera trap models. We then compared the perceptive hearing range (n = 21) and assessed the vision ranges (n = 3) of mammals species (where data existed) to determine if animals can see and hear camera traps. We report that camera traps produce sounds that are well within the perceptive range of most mammals’ hearing and produce illumination that can be seen by many species.
Introduction
Camera traps are being used widely throughout the world although the limitations and constraints of these devices are rarely considered. The study of animal ecology, biology and behaviour requires thorough planning, robust analysis and an element of good luck. Irrespective of the tools being used, there will always be expected errors, variability, unknowns or biases, described as being similar to the “Observer Effect” or “Heisenberg’s Uncertainty Principle” [1]. The study of animals can only provide an insight into their life history; nothing is absolute and understanding the variability is an important component of research investigations. Camera trapping is a survey tool that has improved our capacity to infer the life history of animals, especially where minimising observer effects on animal behaviour is critical [2]–[4]. Some consider that camera traps are a non-intrusive method of studying animals [5]. However, there is increasing evidence throughout the world that animal behaviour is affected by the presence of camera traps [6]–[9]. In some circumstances this ‘effect’ may have little impact on the investigation. In other studies, for example those using indices and mark-recapture estimators (e.g., [1], [10], [11]), it is paramount that the technology used does not alter animal behaviour during or between monitoring sessions to ensure constancy of detectability [8]. Where bias occurs, it is crucial that this effect is understood and measured when interpreting the results of the observations; “the accuracy of an index is irrelevant; precision is paramount” [11]. Irrespective of the hypothesis being tested, the effect on behaviour can scarcely be considered non-intrusive [8] if animals display behavioural responses to sampling tools.
Observations of responses to mensurative devices strongly imply that learning can occur as a consequence of exposure to the devices. For examples, camera traps could be detected by animals for the following reasons:
Auditory – by the emission of sounds from the electronic and mechanical components of the device: these could be in the infra, audible and ultra-sound ranges.
Olfactory – metal, plastic and human scents on the device [6], [9],
Learned association – avoidance of the camera trap through wariness of human presence at a site [6] or attraction to the camera trap through lures and food baits,
Visual (day) – neophobia towards foreign objects introduced into their environment; regular-shaped objects (essentially rectangular prisms) attached to trees or posts [12], [13],
Visual (night) – the flash of xenon light, white LED or infrared LED illumination [7].
The hearing and vision [22] of animals varies depending on their life history, hunting modis operandi, body size [23], [24] and favoured prey [25]. It is commonly accepted that the combination of hearing and vision is important for animal localisation acuity [22], for hunting and social interactions and to avoid predators [26].
Auditory ranges
Hearing ranges are broad in mammals, as an example; mice (Mus domesticus) have a range from 2.3–92 kHz [29], horses (Equus cabalus) hear up to 33.5 kHz, cows (Bos taurus) to 35 kHz [32], kangaroo rat (Dipodomys merriami) to 74 kHz, while the rabbit (Oryctologus cuniculus) can only hear to 49 kHz., cotton rat (Sugmondon hispidus) to 72 kHz [29], wood rat (Neotoma floridana) to 56 kHz, grasshopper mouse (Onychomys leucogaster) 69 KhZ [33], and fox squirrel (Sciurus niger) 49 kHz [34]. A small Australian predator, the northern quoll (Dasyurus hallucatus) hear best from 8–10 kHz although their hearing range is 0.5–40 kHz [31]. Six Australian Brush-tailed possum (Trichosurus vulpecula) were trained to respond to frequencies of 88 kHz [35]. Only bats, dolphins and shrews have been reported to recognise and detect high frequency signals [36], although the authors propose that “it is not impossible that all primitive mammals are capable of echolocation”.
Our associated research primarily focuses on the management of introduced predators [1], wild dogs (Canis lupus ssp) and European red foxes (Vulpes vulpes) and to a lesser extent on feral cats (Felis catus). Feral and domestic cats have one of the broadest hearing ranges of all mammals [27], ranging from 48 Hz to 85 kHz, although responses have been reported up to 100 kHz [28]. Dogs show variability in sensitivity to sound depending on breed (6–45 kHz) (https://www.lsu.edu/deafness/HearingRange.html accessed 3 July 2013) and as high as 65 kHz [28], although this has been disputed [30]. Foxes have evolved with a wide ranging hearing capacity (0.9–34 kHz) with optimal hearing at 10–14 kHz and an upper limit of 34 kHz [25] and 65 kHz [28].
Visual ranges
Dogs are known to have dichromatic colour vision with an upper limit of detection around 555 nm [16], while Mustelids have been reported to have the capacity to detect infrared light up to 870 nm [17]. In the case of Australian marsupials there is clear evidence of colour vision [18]–[20] with taxa variability in regards to spectral sensitivity (dichromatic vs trichromatic) [21].
Camera traps that use xenon white flash to illuminate animals have been widely used in hunting and wildlife research [7] even though there is concern that the bright flash affects the short and long term behaviour of target animals. In a study of Kinkajous (Potos flavus) behavioural avoidance of ‘canopy-highway’ branches where white flash camera traps were placed has been reported [8]. Tiger (Panthera tigris tigris) capture rates in Nepal decreased by 50% over 5 nights of camera trapping using xenon flash devices [7] and similar concerns have been raised in studies of grey wolves (Canis lupus) [14]. Technological advances have resulted in infrared camera traps dominating the market based on claims that animals can’t see the infrared flash [15].
Most of the mammal species being studied using camera traps are nocturnal-crepuscular animals, although not always [19], with some showing a slight preponderance for diurnal activity; so their eye physiology reflects this behaviour. It would not be accurate to state that animals can “see in the dark”; a more accurate description may be that they are able to “see what is in the dark” [37]. Knowledge on the vision capabilities of animals continues to improve despite limitations in fully understanding how they view the world because of the challenges of measuring what they perceive [38]. In fact some believe that the perception of colour vision requires some form of learning, association and consciousness [39]. Moreover, there is uncertainty as to whether animals perceive brightness and hue [39] or if colour vision is in fact important to cats and dogs [40]. Interestingly, apart from Mustela spp. [17] very little is known about the detection of infrared signals by animals.
In the three main species of interest to us (dogs, cats and foxes), their night visual acuity as primarily nocturnal predators is high; in the case of the cat, and more than likely foxes and dogs, their superior night vision is adapted for low visual stimuli [41]. Of most interest is the animal’s ability to detect near infrared (700–3000 nm) illumination: the part of the light spectrum used in infra-red camera traps.
Objectives
We were interested in two critical questions related to the effect of camera trapping on predator behaviour;
Do camera traps produce an audible sound that animals can hear, and infrared flash illumination that they can see, and is there variability between camera trap models and modes?
What is the effect of the sound and illumination on animal behaviour?
To answer the first part of this question we tested a range of commonly used camera traps to determine the frequency and loudness of audio outputs and whether they fell within the hearing range of target mammals. We then tested whether the infra-red illumination from a range of models produced outputs that were within the perceptible range of known animal vision. Conducting tests on these camera traps was made possible using sophisticated technology; the challenge was obtaining enough data on vision and hearing in mammals. Our objectives were to determine whether 1) camera traps emit any sounds in the audible, infra or ultrasonic ranges for humans; 2) camera traps emit infrared illumination above the observable range of mammals; 3) mammals see or hear camera traps, 4) if there is variability in sounds and light emissions within and between camera trap models.
Two authors have suggested that human odour on camera traps may have been a deterrent to coyotes (Canis latrans) visiting camera trap sites [6], [9]; we constrained our investigations here to sound and light emissions. Our investigations achieved all four objectives in comprehensively reporting the sound and visual outputs of and between camera trap models, and how these outputs compare to the known hearing and visual acuity of animals.
Materials and Methods
The main focus of this study was to evaluate the camera trap audio outputs (<20 kHz) in relationship to the known hearing ranges of animals; complementary to this was to quantify potential ultrasound outputs (20–60 kHz) and the infrared illumination spectrums for a range of camera trap models in relation to the known vision spectral data of animals.
Camera Traps, Set-up and Triggering
We tested 12 models of camera traps for audio outputs using still and video functions; 7 models for infrared outputs and 5 models for ultra-sonic outputs (Table 1); the camera trap settings varied between models according to their specifications and functionality (see Table 1 for some details).
Table 1. The camera trap models and numbers used to evaluate the sound outputs in an anechoic chamber.
| Make | Model | Sample | Acoustic | Infra-red | Ultrasonic | Photos/trigger | Video time | Sensitivity |
| Reconyx | HC600 | 10 | • | • | • | 3 | NA | H |
| Scoutguard | 550 | 10 | • | • | 3 | 10 | H | |
| Scoutguard | SG680 V | 8* | • | • | 3 | 10 | H | |
| Moultrie | I65 | 5* | • | • | 1 | 10 | H | |
| Moultrie | I60 | 1 | • | 3 | NA - | H | ||
| Cuddeback | Capture | 3 | • | • | 1 | NA | H | |
| Picxontroller | DigitalEye | 3 | • | 1 | NA | H | ||
| Bushnell | 119466 | 1 | • | • | 3 | 10 | H | |
| Bushnell | 119456C | 1 | • | 3 | 10 | H | ||
| Moultrie | I40 | 1 | • | 1 | 10 | H | ||
| Moultrie | D40 | 1 | • | • | 1 | 10 | H | |
| Scoutguard | 560D | 1 | • | • | • | 3 | NA - | H |
| Uway | NT50 | 1 | • | • | • | 3 | 10 | H |
| Uway | NX50 | 1 | • | 3 | 10 | H |
*Ten units of this model were tested but some failed to operate and were removed from the analysis. NA = not available.
For all measurements during the audio and infra-red optical output tests, camera traps were fixed on a tripod, 100 cm above the surface and set so that the front of the camera was 50 cm from the measuring device to optimise signal detection. Every camera was tested separately and we conducted a countdown to synchronise the measuring devices and to trigger the passive infra-red sensor (PIR), resulting in stills and/or videos being taken. To trigger the camera traps, one of the authors stood in front and to one side of the device and waved a hand across the front of the camera four times at the end of the countdown.
Every camera was tested for audio and optical outputs using still photos and where the function existed in a camera trap model, we tested video outputs.
Acoustic Measurements
Auditory outputs (.01–20 kHz)
A Briel and Kjoer Type 2250 Hand held analyser was used in an anechoic chamber at the National Acoustics Laboratory in Chatswood, Sydney. The device was placed in front of the camera traps and automatically set to record camera outputs for 15 second periods. The equipment was calibrated to 94 db @1000 Hz using a Type 4230 Sound Level Calibrator.
The data were generated by the analyser using an average amplification value for each of 17 frequencies over the 15 second recording period using five measurements (LZFmax, LZSmax, LZFmin, LZSmin, LZeq). Given our objective was to determine the maximum audio outputs of the cameras, we only used LZFmax values in our analysis. LZFmax is the maximum un-weighted audio level recorded over the sampling period, so it is the highest level measured irrespective of frequency.
In order to calibrate the equipment to any background sound in the anechoic chamber, we carried out ten ‘control’ recordings at each of the 17 frequencies to derive the background sound envelope, with the decibels referenced to 20 micro Pascals (20×10−6 Pa).
Ultrasonic outputs (4–200 kHz)
To determine if ultrasonic frequencies were emitted by camera traps we used 10 Reconyx Hyperfire HC600, 3 Cuddeback Captures, 3 Pixcontroller DigitalEye, 1 Scoutguard 560D and 1 Uway NT50 camera traps. Control detections were also collected without a camera trap to measure any possible background sound outputs within the laboratory. As before, the camera traps were placed individually on a tripod 50 cm in front of two ANABAT Detectors connected to a ZCAIM unit. One detector was directly in front of the camera and the second at a 45 degree angle from the central axis of the camera. We tested both angles to assess whether signals were different when the devices were directly in front compared to off centre. Cameras were triggered by hand movements across the front of the camera and recordings were for 15 seconds each. Ultrasonic outputs were analysed using the acoustic analyser software, AnalookW.
Light measurements
Tests were conducted on 32 cameras comprising 7 models (Table 1) in a laboratory at the University of New England on April 20th 2011. Each camera was placed 80 cm from a hand-held ASD Field Spectrometer (FS HH 325-1075) connected to a laptop computer to enable automated data storage. Flash outputs were recorded over a 17 millisecond per acquisition period using a 10 degree field of view lens. Ten measurements per camera motion (see above) were recorded.
Analysis
Due to the data collected by the sound analyser at 33 frequencies, we treated the audio spectrums as “functional”, thus LZFmax was a function of frequency. Analysis of the infrared illumination and ultrasonic outputs were constrained to presentation of summary statistics and raw data because the data was constrained by the unequal sample sizes of the camera trap models we had available. Furthermore, the ultrasonic data can only be reported in ANALOOK format as ranges and not as raw data.
Background sound
The LZFmaxvariable was used for analysing the audio outputs in our analysis. A background sound ‘envelope’ and the 95% confidence envelope across a range of frequencies (12.5 Hz–20 kHz) was established for a set of 10 independent observations. Functional bootstrapping was applied to get the estimate of the mean curve and the associated 95% confidence curves [42].
Audio Outputs
Functional bootstrapping (nboot = 9999) [42] was used to estimate the mean curve and confidence curves (95% CI) using the LZFmaxoutputs for each camera trap model (stills and videos or both) where these features were available. Comparisons of still images within camera trap models were undertaken to evaluate variability using the functional mean to estimate average response for each camera trap model, and functional standard deviation to assess variability within the same models.
Intra-and Inter Model Comparisons
Functional t-tests [43] were used to compare outputs between camera traps, and between camera trap models and to the background sound envelope. Given there were 28 comparisons we predicted an increased chance of ‘false positives’, as such we adjusted the p-values using the ‘false discovery rate’ method [44] to account for this situation.
Ultrasonic Outputs
Ultrasonic camera trap outputs were recorded using an ANABAT Detector but this device does not provide raw data points and merely plots the data as a graph displaying the range of signals detected and the patterns. As such we were unable to accurately analyse variability within and between models so the data has been collated to report on the ranges detected.
Infrared Outputs
Summary statistics were generated for the light outputs across the range of infrared camera trap models, these are presented graphically; comparisons between infrared ranges and animal range was not undertaken in detail due to a lack of data on animal infrared vision.
Comparison with known animal hearing range
A mean audio output using ten HC600 Reconyx camera traps (chosen to be representative of the quietest models) was produced and compared to the published frequency hearing range of animals using a Wilcoxon test (non-parametric). We plotted mean frequency and 95% confidence intervals and used the reported hearing frequencies of 24 animals (Table 2) to determine likely relationships between hearing and sound outputs. Data available on the University of Toledo ‘Behavioural Audiograms of Mammals website (http://psychology.utoledo.edu/showpage.asp?name=mammal_hearing, accessed 6 June 2014) of known hearing ranges of animals was compared to the audio output of the camera traps. The hearing of one key species, the European Red Fox (Vulpes vulpes) has not been recorded in any investigations, so the known hearing range was unavailable. To overcome this constraint we extracted the calling frequencies of red foxes from published research [28], [45] using data extraction software (PlotDigitizer http://plotdigitizer.sourceforge.net, accessed 6 June 2014). We then used these data as a baseline hearing range for the red fox based on the assumption that foxes are calling to each other on this frequency and as such should hear these ranges.
Table 2. The approximate hearing ranges of 24 animals using data extracted from (https://www.lsu.edu/deafness/HearingRange.html) and additional data from papers cited in this study.
| Animal | Scientific name | Approximate Range (Hz) | Upper Range (KHz) |
| bat | Unknown sp | 2,000–110,000 | 110 |
| cat | Felis catus | 45–64,000 | 64 |
| chicken | Gallus gallus | 125–2,000 | 2 |
| cow | Bos taurus | 23–35,000 | 35 |
| dog | Canis lupus | 67–45,000 | 45 |
| elephant | Loxodonta sp | 16–12,000 | 12 |
| ferret | Mustela putorius furo | 16–44,000 | 44 |
| guinea pig | Cavia porcellus | 54–50,000 | 50 |
| hedgehog | Erinaceinae sp | 250–45,000 | 45 |
| horse | Equus caballus | 55–33,500 | 33 |
| human | Homo sapien | 64–23,000 | 23 |
| house mouse | Mus musculus | 2300–92,000 | 92 |
| opossum | Didelphis sp | 500–64,000 | 64 |
| rabbit | Oryctolagus cuniculus | 96–49,000 | 49 |
| raccoon | Procyon lotor | 100–40,000 | 40 |
| rat | Rattus rattus | 200–76,000 | 76 |
| sheep | Ovis aries | 100–30,000 | 30 |
| cotton rat | Sigmondon hispidusi | 1000–72,000 | 72 |
| brush tailed possum | Trichosurus vulpecula | *??-88,000 | 88 |
| fox squirrel | Sciurus niger | 113–49,000 | 49 |
| northern quoll | Dasyurus hallucatus | 500–40,000 | 40 |
| wood rat | Neotoma floridana | 940–56,000 | 56 |
| grasshopper mouse | Onychomys leucogaster | 1850–69,000 | 69 |
| kangaroo rat | Dipodomys merriami | 50–62,000 | 62 |
*lower hearing range is unknown for this species.
Results
We found strong evidence that animals can hear the sound of, and see the infra-red illumination of camera traps.
Audio Outputs of Camera Traps
Background sounds
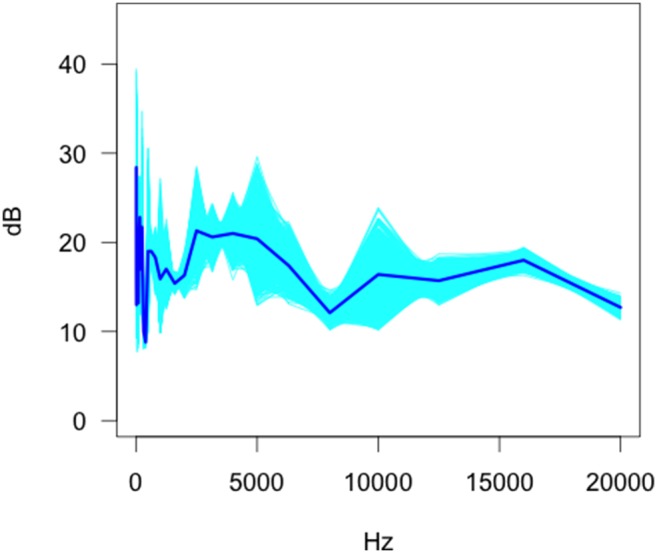
Our data show that the functional mean and standard deviation magnitudes of the background sounds were highly frequency dependent (Fig. 1). Particular frequencies tended to be associated with a higher level of average background sound (e.g. 12.5 Hz, 160 Hz, 250 Hz) with sound ranging from 8.8 dB to 28.4 dB. The variation in the sound measurements changed considerably as a function of frequency. The three largest standard deviations in sound outputs of camera traps occur at 50 Hz, 12.5 Hz, and 500 Hz, with the total range of the standard deviation estimates across frequency being 0.9–14.3 Hz. The largest mean values and the greatest standard deviation of sound components occurred at the lower frequencies suggesting that the values measured might be related to the frequency dependent accuracy of the measuring equipment.
Figure 1. Bootstrap estimates of the functional mean of the anechoic chamber background sound envelope.
Intra-camera trap comparisons - Still Images
Both the background sound and the camera models displayed means and standard deviations that were frequency dependent. Each model of camera seemed to have their own unique signature (see Table S1 and Figure S1) with characteristic peaks and oscillations. There was a semi-regular pattern to the uncertainty within a camera model, with particular sets of frequencies specific to camera model although displaying the greatest variation within camera trap models.
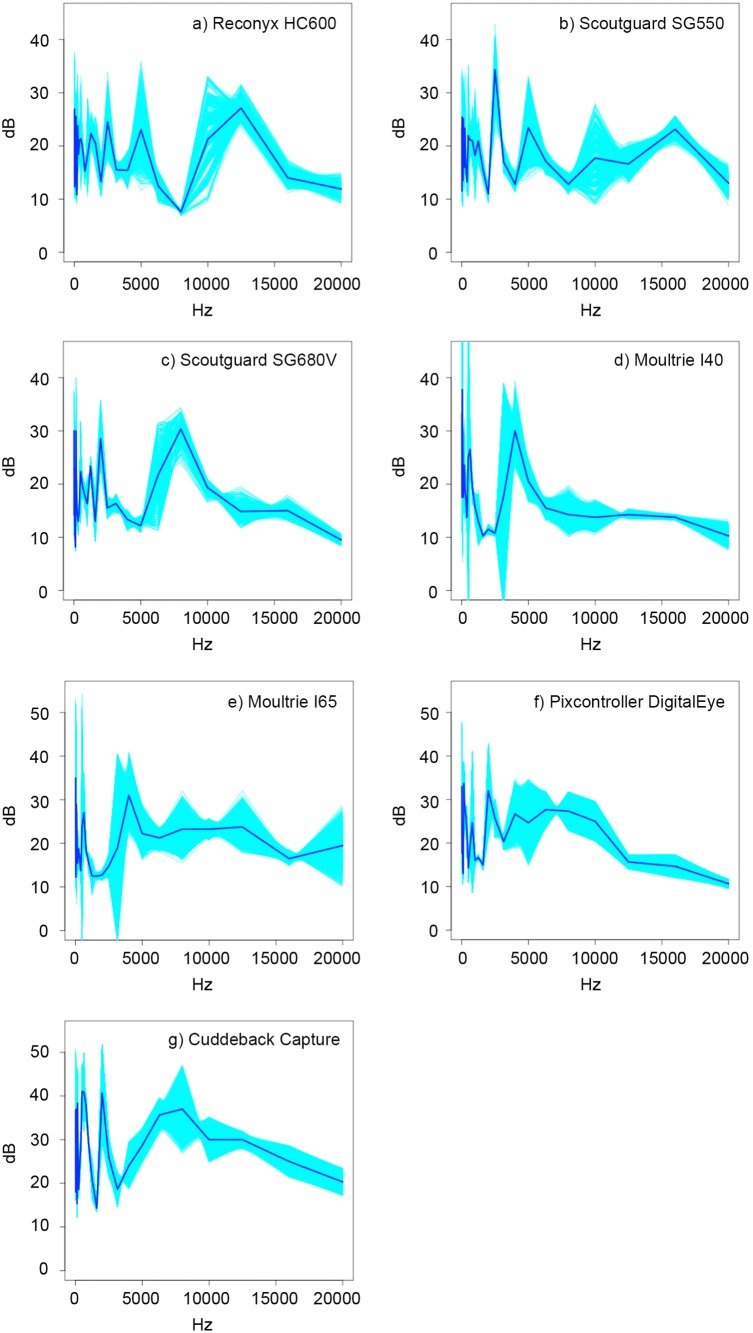
In analysing 10 Reconyx HC600 we established that the mean values range from 7.6 dB to 27.1 dB across the frequency range (12.5 to 20,000 Hz) with a standard deviation ranging from 0.8 dB to 17.2 dB (Fig. 2). There was a substantial difference in the magnitude of the camera output with the top three ‘loudest’ frequencies (12,500 Hz, 12.5 Hz, and 25 Hz) and the three highest standard deviation values 10,000 Hz, 5,000 Hz, and 25 Hz.
Figure 2. Bootstrap estimates of the functional mean (95% CI) of the sound emissions of the a) Reconyx HC600, b) Scoutguard SG 550, c) Scoutguard SG680 V, d) Moultrie I40, c) Moultrie I65, e) Pixcontroller DigitalEye and f) Cuddeback Capture taking still photos.
The Scoutguard SG 550 (still) functional mean was frequency dependent with spikes at 2500 Hz, 5000 Hz, and 10,000 Hz, although different to the HC600 (stills) and the background sound (Fig. 2). The functional standard deviation was also frequency dependent and similar to the HC600. At 250, 5000 and 10000 Hz the variability in the output (LZFmax) between cameras was greatest within a model (i.e., Reconyx still, Scoutguard still). The range of the functional mean was from 11.0 dB to 34.3 dB, with the top three highest values occurring at 2,500 Hz, 31.5 Hz, and 125 Hz.
The Scoutguard KG680 V had a unique ‘signature’ as well as frequency dependent characteristics in the functional mean. The range of the functional mean was 8.1 dB to 30.2 dB with the three highest values occurring at 8,000 Hz, 160 Hz, and 12.5 Hz. These frequencies show the greatest variability within a model and are quite different to the HC600 and SG 550. The functional means of the Moultrie I40 display frequency dependency. The signature was also unique but due to the very small sample size (n = 4) there is some uncertainty in the estimates.
We found that there were sharp and sudden shifts in the LZFmaxstatistic for different frequencies in this model. The range of the functional mean was 10.3 dB to 37.8 dB whilst the functional standard deviation ranged from 0.4 dB to 16.3 dB. The three greatest values of the functional mean occurred at 50 Hz, 40 Hz, and 12.5 Hz. The greatest variability occurred at 3150 Hz, 500 Hz, and 80 Hz in this order. Similarly, there was a frequency dependence and unique sound signature in the Moultrie I65 camera trap The range of the functional mean was from 12.3 dB–35.0 dB with the top three values occurring at 12.5 Hz, 4000 Hz, and 80 Hz.
The Pixcontroller DigitalEye also had a unique sound signature and shared some similarities with the background sound profile. It also exhibited frequency dependent structure in both the functional mean (10.7 dB–33.7 dB, maximal values at 160 Hz, 12.5 Hz, and 2000 Hz.) and standard deviation (0.5 dB–10.3 dB) with the top three values occurring at 800 Hz, 63 Hz, and 12.5 Hz.
Three Cuddeback cameras produced functional mean ranges from 14.3 dB to 41 dB with the top three values occurring at 400 Hz, 500 Hz (equal highest), and 2000 Hz (functional standard deviation 0.5 dB–7.9 dB with the three largest values occurring at 12.5 Hz, 2000 Hz, and 8000 Hz.
Comparisons between camera traps in still modes and background sounds
There were several contrasts displaying significant differences between models (Table 3). Specifically, comparisons between the Background-Cuddeback, HC600-MI40, HC600-Cuddeback, SG550-Cuddeback, KG680 V-Cuddeback, MI65-Cuddeback, and Pixcontroller-Cuddeback were statistically significantly different. There were a further seven contrasts that seem to be statistically significant different but they did not pass the multiple comparisons adjustment. There was a significant difference in the background sound and the Cuddeback, which consistently produced louder sound outputs (16 Hz: Background – 15.9 dB Cuddeback- 23.7 dB, 80 Hz: Background- 14.9 dB Cuddeback- 29.0 dB, 400 Hz: Background – 8.8 dB, Cuddeback- 28.0 dB) (Fig. 3). The contrast between Reconyx HC600- Moultrie MI40 could either be a statistical anomaly or could indicate a difference in the operational frequency response for these two cameras, which is so minute that it is within the variation of the background sound envelope. These analyses confirm that different camera models exhibit unique sound profiles but not discernibly different to the variability within models.
Table 3. Comparisons between different camera outputs (still) and the background sound envelope.
| Model 1 | Model 2 | Statistic | p-value | Adjusted p-value |
| Background | HC600 | tmax = 5.43 | <0.01* | 0.056 |
| Background | SG550 | tmax = 2.73 | 0.22 | 1.00 |
| Background | KG680 V | tmax = 4.62 | 0.02* | 0.53 |
| Background | MI40 | tmax = 5.14 | 0.02* | 0.62 |
| Background | MI65 | tmax = 4.47 | 0.06 | 1.00 |
| Background | Pixcontroller | tmax = 4.27 | 0.13 | 1.00 |
| Background | Cuddeback | tmax = 13.53 | <0.01* | 0.00 * |
| HC600 | SG550 | tmax = 3.44 | 0.07 | 1.00 |
| HC600 | KG680 V | tmax = 2.99 | 0.20 | 1.00 |
| HC600 | MI40 | tmax = 8.70 | <0.01* | 0.00* |
| HC600 | MI65 | tmax = 3.60 | 0.17 | 1.00 |
| HC600 | Pixcontroller | tmax = 5.89 | 0.03* | 0.76 |
| HC600 | Cuddeback | tmax = 18.03 | <0.01* | 0.00* |
| SG550 | KG680 V | tmax = 3.10 | 0.17 | 1.00 |
| SG550 | MI40 | tmax = 6.74 | 0.01* | 0.17 |
| SG550 | MI65 | tmax = 3.561835 | 0.16 | 1.00 |
| SG550 | Pixcontroller | tmax = 5.09 | 0.11 | 1.00 |
| SG550 | Cuddeback | tmax = 15.10 | <0.01* | 0.00* |
| KG680 V | MI40 | tmax = 2.40 | 0.56 | 1.00 |
| KG680 V | MI65 | tmax = 3.53 | 0.17 | 1.00 |
| KG680 V | Pixcontroller | tmax = 5.01 | 0.04* | 1.00 |
| KG680 V | Cuddeback | tmax = 15.10 | <0.01* | 0.00* |
| MI40 | MI65 | tmax = 3.81 | 0.12 | 1.00 |
| MI40 | Pixcontroller | tmax = 4.16 | 0.21 | 1.00 |
| MI40 | Cuddeback | tmax = 11.00 | 0.03* | 0.84 |
| MI65 | Pixcontroller | tmax = 4.38 | 0.08 | 1.00 |
| MI65 | Cuddeback | tmax = 12.99 | <0.01* | 0.00* |
| Pixcontroller | Cuddeback | tmax = 21.97 | <0.01* | 0.00* |
Test statistics (tmax) falling below the critical value are not significant at the particular frequency whilst those at or above were considered significant. (*denotes significance at p<0.05).
Figure 3. Functional t-test results as a function of frequency for two select contrasts: a) Background sound- Cuddeback and b) HC600-Cuddeback.
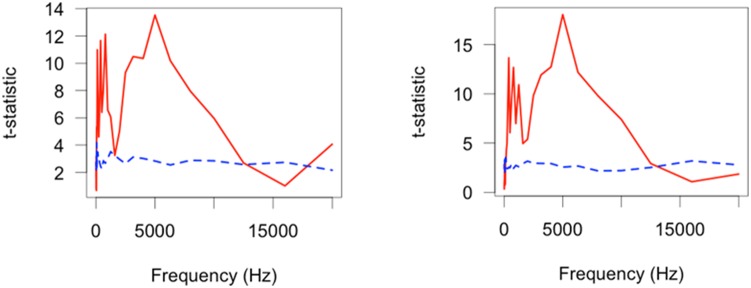
The red (solid) line indicates the permutation statistic (tmax) results for 999 random permutations of the input data sequence whilst the blue (dashed) line indicates the α = 0.05 critical level as a function of frequency. When the red (solid) line is equal or above the blue (dashed) line there was a significant difference at that frequency.
We found that for most frequencies, particularly the low to medium frequencies, significant differences exist.
Intra camera trap comparisons - Video
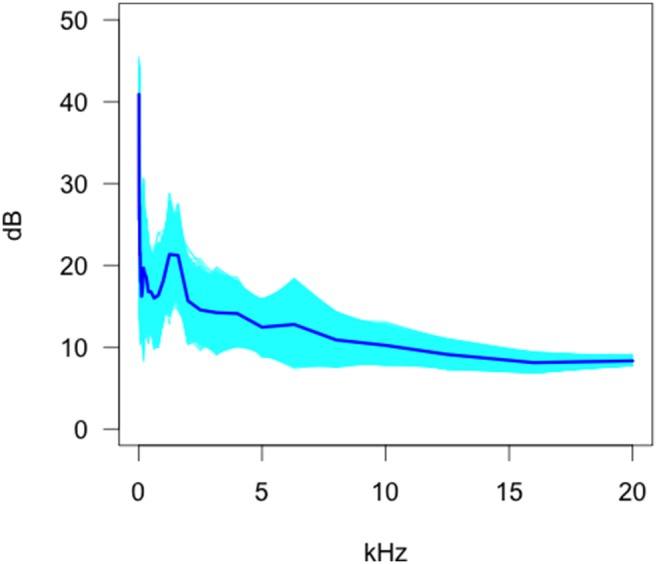
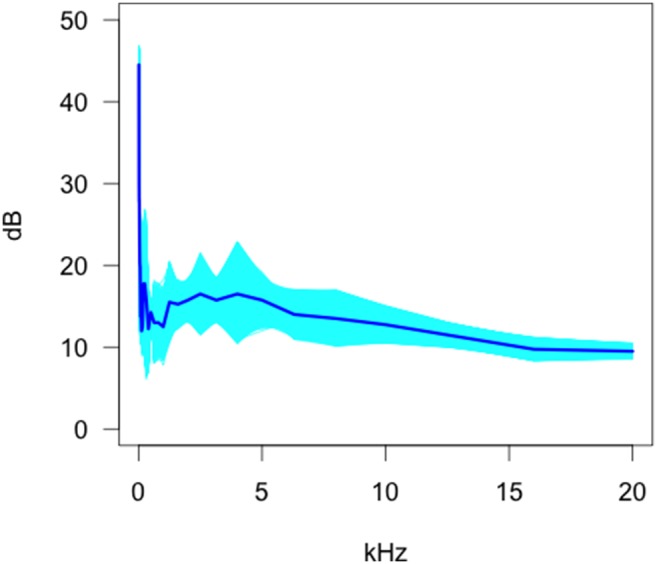
Of the four camera trap models tested, the Scoutguard SG550 (Fig. 4) showed an overall decreasing trend with an occasional minor peak where the operational sound or the uncertainty in the estimate or uncertainty between models was higher. The operational sound characteristics appeared similar to that of the Moultrie MI40 but the functional standard deviation was higher at lower frequencies.
Figure 4. Bootstrap estimates of the functional mean and 95% confidence envelopes for the Scoutguard SG550.
In the Scoutguard KG680, the functional mean exhibited a slow decrease in operational sound level with frequency (Fig. 5). Of note was the relative tight envelope around the estimate of the mean indicating that this curve was estimated with far less uncertainty than the other models.
Figure 5. Bootstrap estimates of the functional mean and 95% confidence envelopes for the Scoutguard KG680.
In the Moultrie MI40 the functional mean of the sound is highly frequency dependent (Figures 6 and Table 4). The operational sound of the camera and the variation between models vary with frequency. The highest operational sound occurred at the lowest frequencies as well as the greatest variation and uncertainty between models.
Figure 6. Bootstrap estimates of the functional mean and 95% confidence envelopes for the Moultrie MI40 camera.
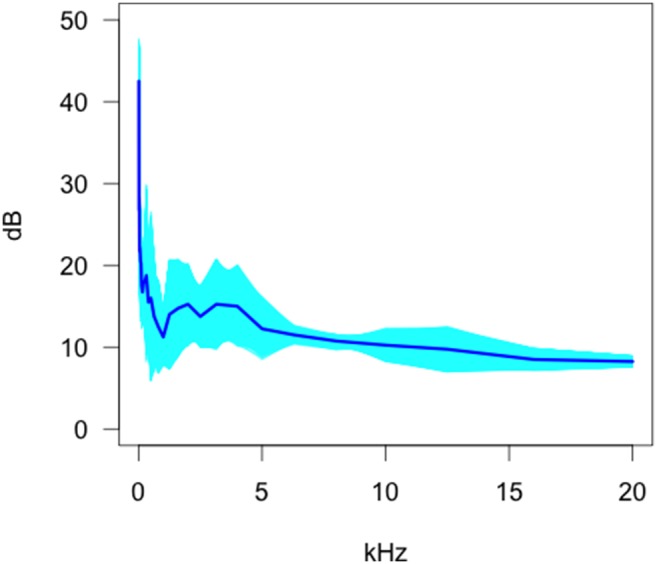
Table 4. Comparisons between different video camera outputs as well as the background (*: denotes statistical significance below the p = 0.05 level).
| Model 1 | Model 2 | Statistic | p-value | Adjusted p-value |
| Background | MI40 | tmax = 4.15 | 0.08 | 0.75 |
| Background | MI65 | tmax = 4.89 | 0.03* | 0.28 |
| Background | SG550 | tmax = 3.02 | 0.17 | 1.00 |
| Background | KG680 V | tmax = 2.88 | 0.41 | 1.00 |
| MI40 | MI65 | tmax = 4.33 | 0.13 | 1.00 |
| MI40 | SG550 | tmax = 10.24 | <0.01* | 0.02* |
| MI40 | KG680 V | tmax = 3.71 | 0.21 | 1.00 |
| MI65 | SG550 | tmax = 4.32 | 0.05 | 0.52 |
| MI65 | KG680 V | tmax = 3.71 | 0.12 | 1.00 |
| SG550 | KG680 V | tmax = 3.50 | 0.21 | 1.00 |
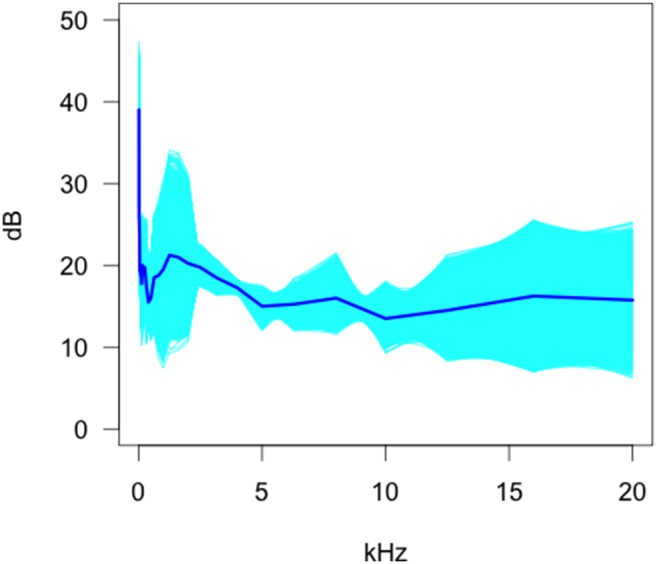
A slight frequency dependent response was observed in the Moultrie MI65 (Fig. 7) around the mean, but the standard deviation estimate was highly frequency dependent with a pronounced peak occurring in the 0–3 kHz band and a general linear increase occurring from 4–20 kHz. The increasing width of the 95% confidence envelope as frequency increases reflects uncertainty with increasing frequency. This might be due to low sample sizes and our inability to establish whether or not the mean curve increases, remains stationary, or decreases at these frequencies. These data show that the sound level for the MI65 is higher than the MI40.
Figure 7. Bootstrap estimates of the functional mean and 95% confidence envelopes for the Moultrie MI65 camera.
Estimates of the mean audio output and standard deviation were estimated as a function of frequency for four different camera models operating in video mode. All cameras appear to have frequency dependent operational characteristics and furthermore there appears to be differences in the mean sound levels between models. Importantly, the standard deviation curve estimates within a model appear greater or on similar magnitude to the mean differences between cameras. This could be due to the limited number of camera traps models, although this is unlikely because the analysis suggested wide variation in magnitude and form.
Comparisons between Video Modes and Background Sound
Our functional tests with multiple comparison corrections for background sound in video mode showed no significant difference (Table 4). There was however a difference in audio outputs between the MI40 and SG550 with a difference in the response around 1000 Hz but it was still within the range of the background sound (Fig. 8).
Figure 8. Functional t-statistics as a function of frequency for the MI40-SG550 V contrast in video mode.
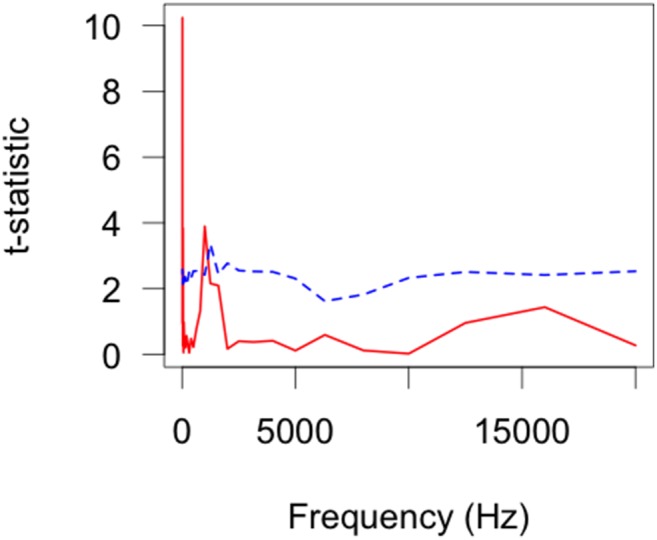
The test statistic (tmax) is displayed as a solid line and the α = 0.05 critical value as a function of frequency is displayed as a dashed line.
Except at very low frequencies and a slight (tmax≈1–1.5) variation around 1000 Hz, there were no significant differences in response across frequencies. The secondary peak at 1000 Hz is indicative of a difference in the functional mean estimates for these two cameras in video mode.
Comparisons between Still and Video Modes
There was no difference in still and video frequency response or between the four camera models (Scoutguard and Moultrie) (Table 5).
Table 5. Still vs Video comparisons using functional t-tests (*: denotes statistical significance below the p = 0.05 level).
| Model | Statistic | p-value | Adjusted p-value |
| MI40 | tmax = 2.17 | 0.74 | 1.0 |
| MI65 | tmax = 2.99 | 0.41 | 1.0 |
| SG550 | tmax = 1.95 | 0.73 | 1.0 |
| KG680 V | tmax = 2.98 | 0.35 | 1.0 |
Ultrasonic recordings
Ultrasound frequencies tests on the five camera trap models confirm that camera traps do produce ultrasonic outputs each time a photo is taken (Table 6). Frequency ranges for Reconyx HC600 was 3–60 kHz with a median output of 52.5 kHz (SD = 13.4) directly in front of the device and 47.5 kHz (SD = 7.3) perpendicular to the device. Other models emitted outputs within a similar range. There was some variability within models due to the method of measuring the outputs; ANABAT detectors are designed to measure bat echolocation not low level ultrasonic sound.
Table 6. Ultrasonic outputs from five camera trap models including two control recordings, two ANABAT directions were utilised (directly in front and offset 45 degrees to the central axis of the camera).
| directly in front | off-set 45 degrees | |||
| Model and Code | Lower (kHz) | Upper (kHz) | Lower (kHz) | Upper (kHz) |
| HC600–1 | 3 | 35 | 3 | 40 |
| HC600–2 | 3 | 20 | 3 | 35 |
| HC600–3 | 3 | 50 | 3 | 45 |
| HC600–4 | 3 | 55 | 3 | 50 |
| HC600–5 | 3 | 60 | 3 | 55 |
| HC600–6 | 3 | 55 | 3 | 0 |
| HC600–7 | 0 | 0 | 0 | 0 |
| HC600–8 | 3 | 55 | 3 | 50 |
| HC600–9 | 0 | 0 | 0 | 0 |
| HC600–10 | 3 | 50 | 3 | 45 |
| Cuddeback-1 | 3 | 40 | 3 | 55 |
| Cuddeback-2 | 3 | 40 | 3 | 60 |
| Cuddeback-3 | 3 | 60 | 3 | 40 |
| Pixcontroller-1 | 0 | 0 | 0 | 0 |
| Pixcontroller-2 | 0 | 0 | 3 | 45 |
| Pixcontroller-3 | 3 | 35 | 0 | 0 |
| Scoutguard 560D-1 | 3 | 0 | 0 | 0 |
| Uway NT50–1 | 3 | 35 | 3 | 0 |
| Control 1 | 0 | 0 | 0 | 0 |
| Control 2 | 0 | 0 | 0 | 0 |
Audio Outputs and Known Hearing Ranges of Animals
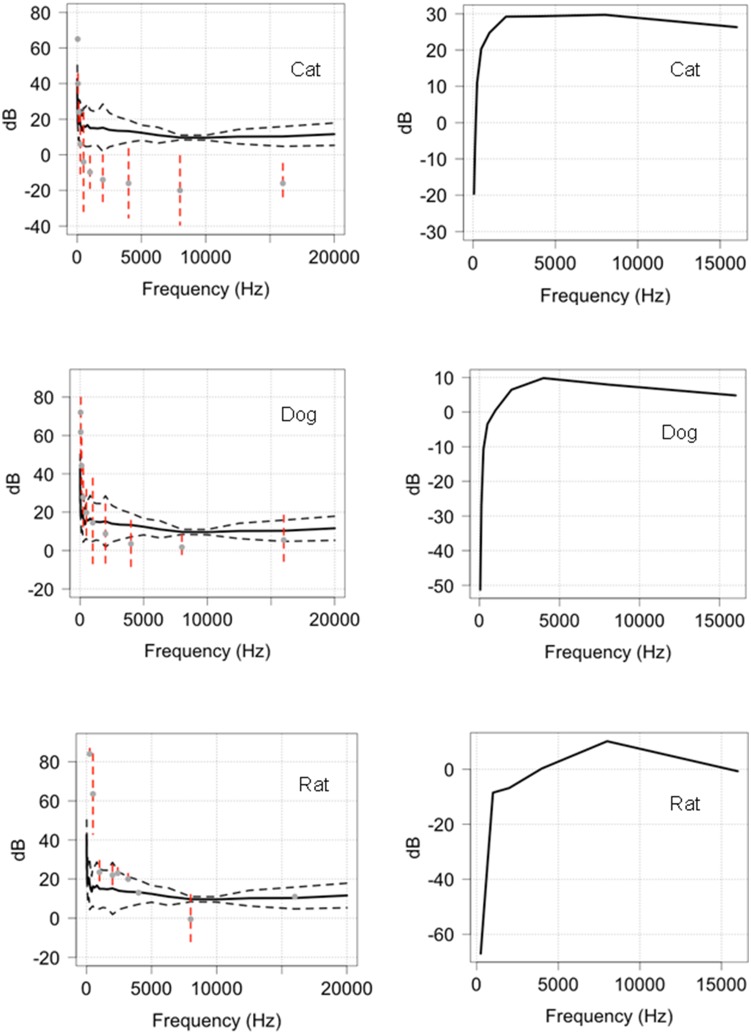
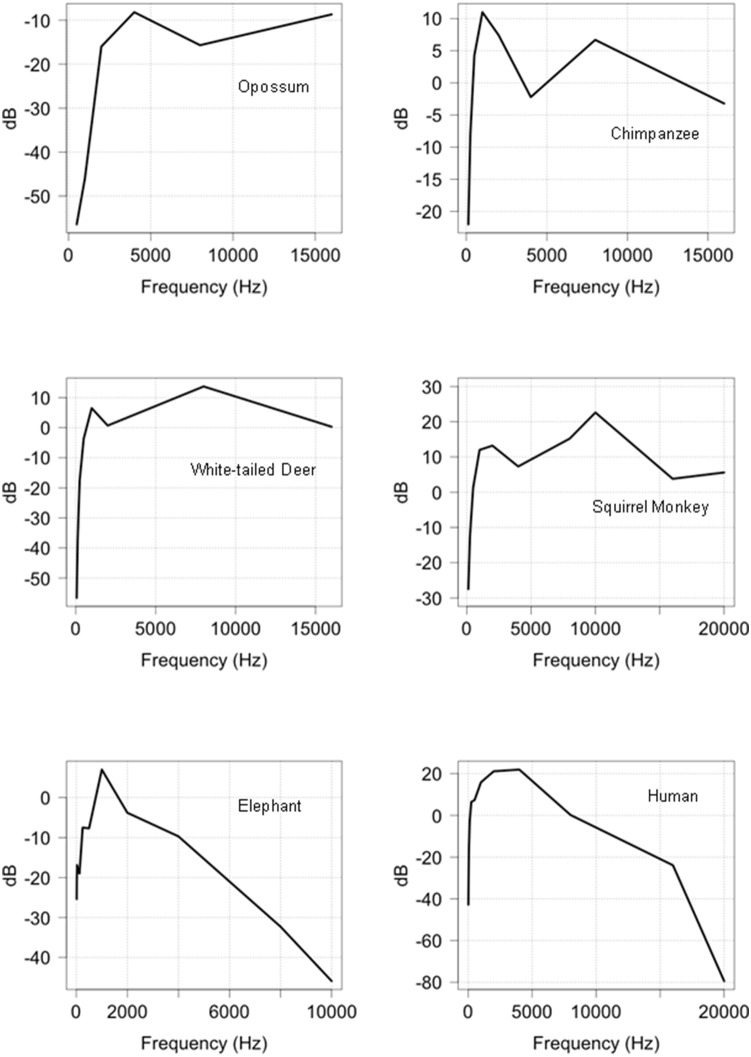
Our tests comparing Reconyx (HC600) camera trap outputs to the existing hearing ranges of 21 species (see http://psychology.utoledo.edu/showpage.asp?name=mammal_hearing, accessed 6 June 2014) found compelling evidence that camera trap sound outputs fall within the hearing range of most of the species (Fig. 9–11). In 9b, 9b and 9c we have presented data to show the relationship between the camera sound and the auditory threshold of the animal as a function of frequency. These data strongly suggest that dogs, cats and rats have the capacity to detect low frequency outputs (<20 kHz) from camera traps. Data presented in Figure 10 provide evidence that a further six mammals, including humans, have the capacity to detect camera traps in the lower frequency bandwidths. The hearing ranges in comparison to camera trap outputs for a further 12 mammals are provided in Figure S2.
Figure 9. Dog (1), cat (2) and rat (3) hearing ranges in relation to the outputs of HC600 camera traps (1a, 2a, 3a) and as a function of frequency (1b, 2b, 2c).
The black line is the mean audio output of the camera trap; the grey dotted lines are the 95% confidence limits. The red dotted lines represent the standard error around the known hearing range of the dog, cat and rat. Where the grey points and red dotted lines (SE) are below and closest to the mean audio output of the camera, the sound can be detected by the animal.
Figure 11. Comparison of the predicted hearing range of the red fox in relation to the outputs of HC600 camera traps and as a function of frequency.
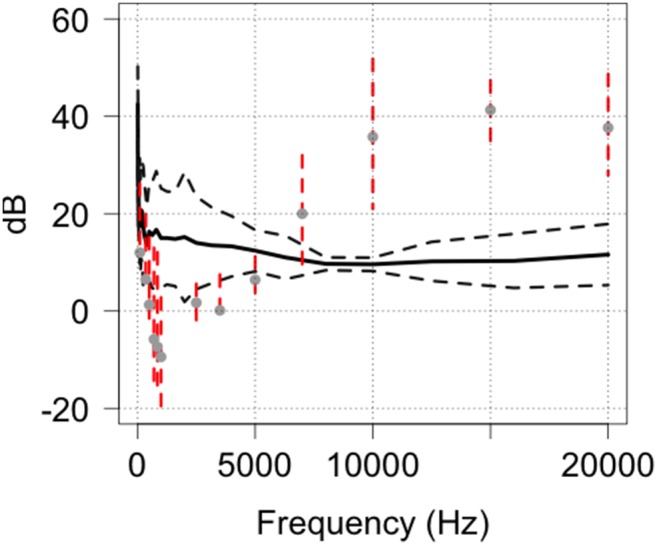
Figure 10. The auditory threshold of 6 mammals represented as a function of frequency.
Given the paucity of data on the known hearing range of red foxes we carried out a comparison on the minimal hearing range for this species based on their calling frequencies [25], [45] (Fig. 11). This was based on the assumption that foxes must be able to hear the frequency of fox calls recorded at a minimum. From this analysis we derived an optimum hearing range for the red fox of around 8–12 kHz although this would be an under-estimation of their true range. Despite having to use call frequencies to model hearing range, the results show that red foxes can easily hear camera trap outputs.
The data presented provide robust evidence that mammals can detect the sound outputs of camera traps.
Infra-red Wavelength Outputs
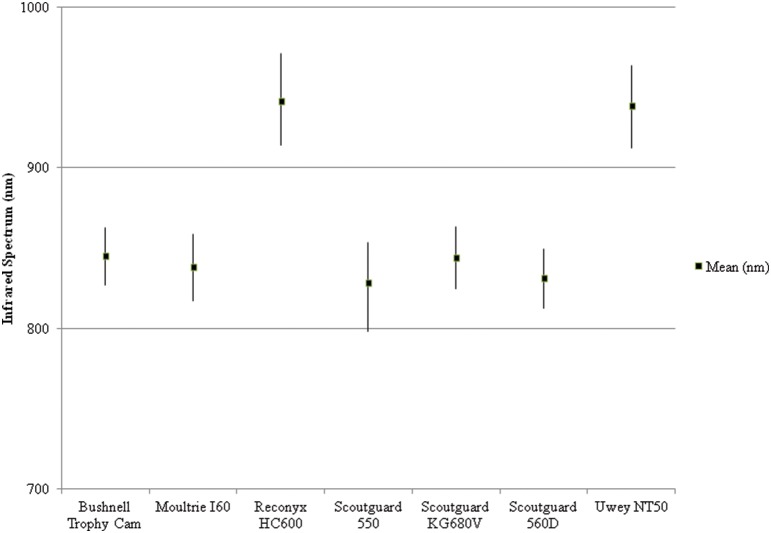
The infra-red illumination ranges varied between models (Fig. 12) but there was no difference in wavelength outputs within models for the Reconyx HC600 (Mean = 940.5, SD = 1.8, 95% CI = 1.3), Scoutguard 550 (Mean = 828.3, SD = 4.7, 95% CI = 3.4) and Scoutguard 680 V (mean = 844.1, SD = 0.6, 95% CI = 0.5) camera traps.
Figure 12. Mean infra-red wavelength illumination (nm) outputs for seven camera trap models showing the highest and lowest values.
Based on the data in Figure 12, camera traps that are advertised as “no glow” (HC600) or “black ops” (NT50) are clearly using infrared technology with wavelengths operating above 850 nm. These infrared LED’s are emitting light that is nearly invisible to the human eye, but not some animals.
Discussion
In this study we tackled the first part of a two staged question; do camera traps have the capacity to project audio and optical stimuli to wildlife? Moreover, are these outputs different between and within models and recording modes (still or video)? We present these data on the audio and visual outputs of camera traps to highlight the importance of identifying the effects camera trapping may have on animal behaviour.
Animal Hearing
A wide range of comparisons were conducted to investigate the possibility of differences in operating audio outputs of different camera models in both still and video mode. In the vast majority of cases (except the Cuddeback) the operational sound was little different from the background sound in the sound laboratory. In some cases slight differences were found between models (e.g. MI40 and SG550 video) but were of such a low level that they were within the magnitude of the background sound. The noise created by two people being present in the anechoic chamber conducting the experiments probably produced sounds and affected the background sound envelope. If we were able to conduct the tests remotely there may have been a more significant difference between camera trap noise and background noise.
In comparing the auditory range of animals in contrast to our recorded outputs, we sourced sonagraph data for a range of species. There have not been any sonagraphs to determine the hearing ranges of foxes although it has been reported that red fox have an upper limit of 65 kHz [37]. While studies of 75 foxes [46] reported the frequency of a range of calls made by foxes to be less than 2 kHz, which is consistent with one other study [45] that reported calls all under 2.5 kHz. The foxes hearing capacity has been reported to have a reduced capacity between 5–11 kHz with a discernible reduction around 8.5 kHz, but reported that they hear sounds well at 10–14 kHz [25]. Given red fox calling frequencies, they would certainly hear some of the infra and ultra sounds emitted by camera traps. We report the first evidence that animals can detect the presence of camera traps due to the audio and optical outputs from these devices. This study determined that at certain frequencies, animal hearing (Table 2 and see http://www.lsu.edu/deafness/HearingRange.html, accessed 6 June 2014) can easily detect these sounds.
The results of our testing also provide conclusive evidence that camera traps do emit ultrasonic outputs, especially when battery levels are low. In a pilot trial we found that low powered batteries resulted in the ANABAT detecting an output but in subsequent tests with fully charged batteries, there was no audible signal suggesting that camera trap outputs vary with battery life. The use of a bat call monitoring device has been used previously to test LED lights being used in research on Mustella vision [17]. The authors were unable to detect any outputs by the lights, however in the case of camera traps there are a range of electrical and mechanical components apart from the LED circuitry that may be emitting sound.
Animal Vision
Information on the extent of infrared detection by other mammals is scant in the literature. There have been some investigations using behavioural methods that report some animals can see infrared light in the range 539–870 nm although the evidence is limited across the taxa. As such we were unable to conduct any comparative analysis of infrared flash light outputs with animal vision to test our hypotheses.
Research has established that Honey Possums (Tarsipes rostrata) are able to see light in the 557 nm range [18] while ferrets (Mustela furo) can see around 870 nm [17] and Tamar Wallaby (Macropus eugenii) peaked at 539 nm [20].
These data probably underestimate the extent of an animal’s ability to detect infrared light since they are based on behavioural studies [38], not physiological analysis, because such technology is unavailable. As such, we are unable to state exactly what the limits of animal vision might be, and we believe that the range of infrared light presented in Figure 12 are likely seen by many species of animal. In support of this claim, one of the authors (PM) was able to see a faint red glow of a Reconyx HC600 in absolute darkness. Reports of humans detecting infrared (1064 nm) well above the illumination currently used in camera traps have been recorded [47], [48]. This being the case, there is no doubt that nocturnal animals with vision sensitive to night light can see infrared illumination. The responses of animals to infrared flash are highly variable between species and individuals (Meek Unpub data; Ballard Unpub data). While we cannot measure exactly what animals see, they most likely see a similar image to the flash recorded by two camera traps triggered simultaneously, as shown in Figure 13.
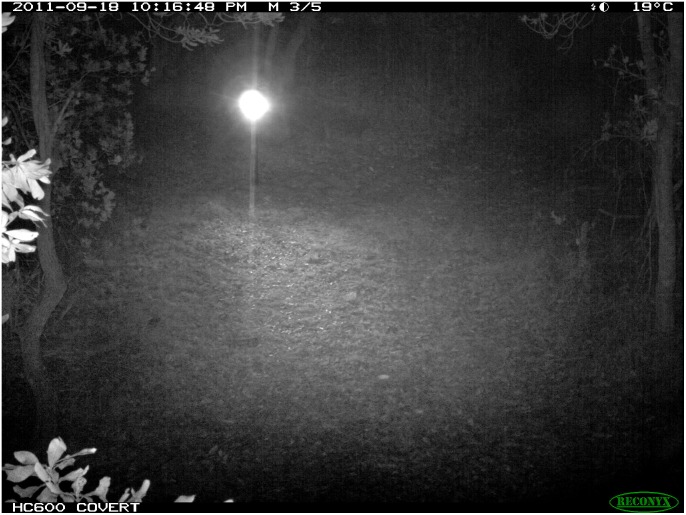
Figure 13. Infra red illumination of two opposing Reconyx HC600 camera traps simultaneously triggering.
Cats appear to detect the presence of camera traps more than other animals (Meek Unpub data; Ballard Unpub data), which is probably due to their retina sensitivity at 826 nm [49] and total vision field of view being 287° with binocular over lap of 130° [37]. This peripheral view combined with the very high sensitivity to infrared light at the higher end of the near infrared spectrum would make cats more than capable of easily detecting camera trap flashes; especially in models with light emissions below 800 nm (see Fig. 12).
The effects of white flash camera traps on animal behaviour have been recognised as an intrusive survey method because it has been shown to startle and cause animals to flee (7). Some authors have suggested that using infrared illumination may reduce this flight response [7], [8], [14], especially where infrared wavelengths exceed ∼870 nm [17]. While there is little information on the detectable range of infrared wavelengths by most animals, one study did find that ferrets’ (Mustelo furo) maximum observable range was about 870 nm [17]. Multiple images and corresponding footprint detecting plots from our research on feral cats, wild dogs and foxes in Australia over several years indicates that all three species can detect flash illumination from Reconyx HC600 camera traps (Meek Unpub data; Ballard Unpub data). In field trials where two HC600 were facing each other, we were able to accidentally trigger the cameras to simultaneously trigger showing visually what nocturnal animals may see when infra red illumination occurs (Fig. 13) [50].
Anecdotal reports of ship rats (Rattus rattus) and brush-tailed possums (Trichosurus vulpecula) from three unpublished studies describe avoidance of infrared illumination in these species (see [17]). Although there has not been any effect found on predator behaviour around ground-nesting bird nests from infrared camera traps used to detect visitation [51].
Despite wide spread belief that humans cannot see near infrared light, many authors have reported being able to detect infrared light during experiments and these descriptions have been described [17]. On the evidence presented in the literature and summarised here, we conclude that most nocturnal or arrhythmic (nocturnal with some diurnal activity) mammals can see the infrared illumination (flash) emitted by camera traps.
Conclusions
Hearing and vision work together to form what is referred to as auditory localisation acuity [22]; where an animal hears a sound and turns towards the sound using eye sight to focus in on the stimuli. This is probably the case in camera trapping, where a sound is heard by a passing animal and the device is further recognised by vision, thus enabling animals to detect the device.
With the constant sounds of the forest animals are unlikely to be hearing the camera traps constantly as the frequency and amplitude values are very similar. Furthermore, the audio outputs collected in the anechoic chamber were recorded at 50 cm, and it is reported that with every metre away from the camera a loss of 6 dB is expected [52]. Sound levels are affected by distance from the source, atmospheric attenuation, terrain, ground cover, wind and weather [53], forest density (a function of limb and trunk density) and foliage [54] and as such we acknowledge that this attenuation may reduce sounds from camera traps under field conditions. This is because unlike the pure sounds recorded by audiograms, complex sounds like those in a natural setting where multiple frequencies and background scatter exist are less likely to be detected by animals [55].
In some studies the target species’ ability to detect a camera trap may not be important because the requirement is to detect presence only, so irrespective of whether the animal baulks and runs from a camera trap is of no importance. Where repeat visits to a site are imperative for analysis, i.e., mark recapture, photographic indexes, CPUE and activity indexes, the interference to behaviour and potential avoidance of the camera trap may introduce a bias on the probability of detection. An issue also raised by in one study [17] in regard to the potential for infrared light emitting surveillance devices or traps to cause avoidance by animals.
There is a convincing argument presented in this study to confirm that most mammals can hear the operational sounds generated by camera traps in both the infrasound and ultrasound ranges. Moreover, given the strong relationship between vision and hearing acuity [22], this study concludes that most mammals can see the infra-red illumination used in camera traps.
Supporting Information
The noise frequency outputs of twelve camera trap models and the background control.
(TIF)
The hearing range of an additional twelve animals in comparison to the noise outputs of a camera trap.
(TIF)
The mean audio outputs of 12 camera trap models at different frequencies.
(DOCX)
Acknowledgments
Thanks to the Schultz Foundation for their support and provision of some camera traps to use in our experiments. We greatly appreciate the technical assistance of Greg Stewart of the National Acoustic Laboratory and Keryn Lapidge of the Invasive Animals CRC. Thank you to Damien Byrne from Outdoor Cameras Australia and Nick Dexter of Jervis Bay National Park for lending us some camera traps. We appreciate the technical support and advice provided by Matt Dobson in recording the ultrasonic outputs. Thank you to Julian Partridge, Christa Neumeyer, Nathan Hart, Lyn Beazley, Catherine Arresse and Henry Heffner for their invaluable advice and opinions on animal hearing and vision.
Data Availability
The authors confirm that all data underlying the findings are fully available without restriction. Raw audio data have been deposited to the University of New England E-publications Library: une-20140917-091534.
Funding Statement
These authors have no support or funding to report.
References
- 1.Caughley G (1977) Analysis of Vertebrate Populations. London: John Wiley & Son.
- 2. Swann DE, Hass CC, Dalton DC, Wolf SA (2004) Infrared-triggered cameras for detecting wildlife: an evaluation and review. Wildlife Society Bulletin 32: 357–365. [Google Scholar]
- 3. Cutler TL, Swann DE (1999) Using remote photography in wildlife ecology: a review. Wildlife Society Bulletin 27: 571–581. [Google Scholar]
- 4.Kucera TE, Barrett RH (2011) A History of Camera Trapping. In: O’Connell AF, Nichols JD, Karanth KU, editors. Camera Traps in Animal Ecology. New York: Springer. 9–26.
- 5.Long RA, MacKay P, Zielinski WJ, Ray JC (2008) Noninvasive Survey Methods for Carnivores. Washington DC, USA: Island Press.
- 6. Séquin ES, Jaeger MM, Brussard PF, Barrett RH (2003) Wariness of coyotes to camera traps relative to social status and territory boundaries. Canadian Journal of Zoology 81: 2015–2025. [Google Scholar]
- 7. Wegge P, Pokheral CP, Jnawali SR (2004) Effects of trapping effort and trap shyness on estimates of tiger abundance from camera trap studies. Animal Conservation 7: 251–256. [Google Scholar]
- 8. Schipper J (2007) Camera-trap avoidance by Kinkajous Potos flavus: rethinking the “non-invasive” paradigm. Small Carnivore Conservation 36: 38–41. [Google Scholar]
- 9. Larrucea ES, Brussard PF, Jaeger MM, Barrett RH (2007) Cameras, Coyotes, and the Assumption of Equal Detectability. The Journal of Wildlife Management 71: 1682–1689. [Google Scholar]
- 10. Mahon PS, Bates PB, Dickman CR (1998) Population indices for wild carnivores: a critical study in sand-dune habitat, south-western Queensland. Wildlife Research 25: 217–217. [Google Scholar]
- 11.Caughley G, Sinclair ARE (1994) Wildlife Ecology and Management. Massachusetts: Blackwell Science.
- 12. Lehner PN, Krumm R, Cringan AT (1976) Tests for Olfactory Repellents for Coyotes and Dogs. 40: 145–150. [Google Scholar]
- 13. Windberg LA (1996) Coyote responses to visual and olfactory stimuli related to familiarity with an area. Canadian Journal of Zoology 74: 2248–2253. [Google Scholar]
- 14.Gibeau ML, McTavish C (2009) Not-So-Candid Cameras: how to prevent camera traps from skewing animal behaviour. The Wildlife Professional: 35–37.
- 15. Meek PD, Pittet A (2012) User-based design specifications for the ultimate camera trap for wildlife research. Wildlife Research 39: 649–660. [Google Scholar]
- 16. Neitz J, Geist T, Jacobs GH (1989) Color vision in the dog. Visual Neuroscience 3: 119–125. [DOI] [PubMed] [Google Scholar]
- 17. Newbold HG, King CM (2009) Can a predator see ‘invisible’ light? Infrared vision in ferrets (Mustela furo). Wildlife Research 36: 309–318. [Google Scholar]
- 18. Sumner P, Arrese CA, Partridge JC (2005) The ecology of visual pigment tuning in an Australian marsupial: the honey possum Tarsipes rostratus . Journal of Experimental Biology 208: 1803–1815. [DOI] [PubMed] [Google Scholar]
- 19. Arrese C, Archer M, Beazley LD (2002) Visual capabilities in a crepuscular marsupial, the honey possum (Tarsipes rostratus): a visual approach to ecology. Journal of Zoology 256: 151–158. [Google Scholar]
- 20. Hemmi JM, Maddess T, Mark RF (2000) Spectral sensitivity of photoreceptors in an Australian marsupial, the tammar wallaby (Macropus eugenii). Vision Research 40: 591–599. [DOI] [PubMed] [Google Scholar]
- 21. Ebeling W, Natoli RC, Hemmi JM (2010) Diversity of Color Vision: Not All Australian Marsupials Are Trichromatic. PLoS ONE 5: e14231. [DOI] [PMC free article] [PubMed] [Google Scholar]
- 22. Heffner RS, Heffner HE (1992) Visual Factors in Sound Localization in Mammals. Journal of Comparative Neurology 317: 219–232. [DOI] [PubMed] [Google Scholar]
- 23. Huang GT, Rosowski JJ, Ravicz ME, Peake WT (2002) Mammalian ear specializations in arid habitats: structural and functional evidence from sand cat (Felis margarita). Journal of Comparative Physiology a-Neuroethology Sensory Neural and Behavioral Physiology 188: 663–681. [DOI] [PubMed] [Google Scholar]
- 24. Huang GT, Rosowski JJ, Peake WT (2000) Relating middle-ear acoustic performance to body size in the cat family: measurements and models. Journal of Comparative Physiology A 186: 447–465. [DOI] [PubMed] [Google Scholar]
- 25. Isley TE, Gysel LW (1975) Sound-Source Localization by the Red Fox. Journal of Mammalogy 56: 397–404. [Google Scholar]
- 26. Webster DB, Webster M (1971) Adaptive value of hearing and vision in Kangaroo rat predator avoidance. Brain, Behavior and Evolution 4: 310–322. [DOI] [PubMed] [Google Scholar]
- 27. Heffner RS, Heffner HE (1985) Hearing Range of the Domestic Cat. Hearing Research 19: 85–88. [DOI] [PubMed] [Google Scholar]
- 28. Peterson EA, Heaton WC, Wruble SD (1969) Levels of Auditory Response in Fissiped Carnivores. Journal of Mammalogy 50: 566–578. [PubMed] [Google Scholar]
- 29. Heffner H, Masterton B (1980) Hearing in Glires: Domestic rabbit, cotton rat, feral house mouse, and kangaroo rat. Journal of Acoustic Society America 68: 1584–1599. [Google Scholar]
- 30. Heffner HE (1983) Hearing in large and small dogs: Absolute thresholds and size of the tympanic membrane. Behavioral Neuroscience 97: 310–318. [Google Scholar]
- 31. Aitkin LM, Nelson JE, Shepherd RK (1994) Hearing, Vocalization and the External Ear of a Marsupial, the Northern Quoll, Dasyurus-Hallucatus . Journal of Comparative Neurology 349: 377–388. [DOI] [PubMed] [Google Scholar]
- 32. Heffner RS, Heffner HE (1983) Hearing in large mammals: Horses (Equus caballus) and cattle (Bos taurus). Behavioral Neuroscience 97: 299–309. [Google Scholar]
- 33. Heffner HE, Heffner RS (1985) Hearing in two cricetid rodents: Wood rat (Neotoma floridana) and grasshopper mouse (Onychomys leucogaster). Journal of Comparative Psychology 99: 275–288. [PubMed] [Google Scholar]
- 34. Jackson LL, Heffner HE, Heffner RS (1997) Audiogram of the fox squirrel (Sciurus niger). Journal of Comparative Psychology 111: 100–104. [DOI] [PubMed] [Google Scholar]
- 35. Signal T, Foster TM, Temple W (2001) Determination of auditory thresholds in the brushtail possum (Trichosurus vulpecula). Physiology & Behavior 73: 195–200. [DOI] [PubMed] [Google Scholar]
- 36. Heffner H, Ravizza RJ, Masterton B (1969) Hearing in primitive mammals, III: Tree shrew (Tupaia glis). Journal of Auditory Research 9: 12–18. [Google Scholar]
- 37.Ewer RF (1998) The Carnivores. New York, USA: Comstock Publishing Associates.
- 38. Jacobs GH (2010) The Verriest Lecture 2009: Recent progress in understanding mammalian color vision. Ophthalmic and Physiological Optics 30: 422–434. [DOI] [PubMed] [Google Scholar]
- 39. Kelber A, Vorobyev M, Osorio D (2003) Animal colour vision – behavioural tests and physiological concepts. Biological Reviews 78: 81–118. [DOI] [PubMed] [Google Scholar]
- 40. Sathyakumar S, Bashir T, Bhattacharya T, Poudyal K (2011) Assessing mammal distribution and abundance in intricate eastern Himalayan habitats of Khangchendzonga, Sikkim, India. Mammalia 75: 257–268. [Google Scholar]
- 41. Gunter r (1951) The absolute threshold for vision in the cat. Journal of Physiology 114: 8–15. [DOI] [PMC free article] [PubMed] [Google Scholar]
- 42. Cuevas A, Febrero M, Fraiman R (2006) On the use of the bootstrap for estimating functions with functional data. Computational Statistics & Data Analysis 51: 1063–1074. [Google Scholar]
- 43.Ramsay J, Hooker G, Graves S (2009) Functional Data Analysis with R and MATLAB.. New York.: Springer.
- 44. Benjamini Y, Hochberg Y (1995) Controlling the false discovery rate: a practical and powerful approach to multiple testing. Journal of the Royal Statistical Society Series B 57: 289–300. [Google Scholar]
- 45. Newton-Fisher N, Harris S, Green P, Jones G (1993) Structure and function of red fox Vulpes vulpes vocalisations. Bioacoustics 5: 1–31. [Google Scholar]
- 46. Gogoleva SS, Colodin JA, Volodinay V, Trutl N (2008) To bark or not to bark/vocalisations by Red Foxes for tameness or aggressiveness towards humans. Bioacoustics 18: 99–132. [Google Scholar]
- 47. Griffin DR, Hubbard R, Wald G (1947) The Sensitivity of the Human Eye to Infra-Red Radiation. Journal of the Optical Society of America 37: 546–553. [DOI] [PubMed] [Google Scholar]
- 48. Sliney DH, Wangemann RT, Franks JK, Wolbarsht ML (1976) Visual sensitivity of the eye to infrared laser radiation. Journal of the Optical Society of America 66: 339–341. [DOI] [PubMed] [Google Scholar]
- 49. Gekeler F, Shinoda K, Blatsios G, Werner A, Zrenner E (2006) Scotopic threshold responses to infrared irradiation in cats. Vision Research 46: 357–364. [DOI] [PubMed] [Google Scholar]
- 50. Meek PD, Ballard G-A, Fleming PJS (2012) A permanent security post for camera trapping. Australian Mammalogy 35: 123–127. [Google Scholar]
- 51. Sanders MD, Maloney RF (2002) Causes of mortality at nests of ground-nesting birds in the Upper Waitaki Basin, South Island, New Zealand: a 5-year video study. Biological Conservation 106: 225–236. [Google Scholar]
- 52.Bies DA, Hansen CH (1996) Engineering Noise Control: Theory and Practice, E & FN Spon, an imprint of Chapman & Hall, London
- 53.Pater L (2000) Defining Auditory Thresholds for Animal Species. In: Baker M, Belliveau G, editors. Terra Borealis; 2000; Labrador, Canada. Institute for Environmental Monitoring and Research. 22–25.
- 54. Price MA, Attenborough K, Heap NW (1988) Sound attenuation through trees: Measurements and models. The Journal of the Acoustical Society of America 84: 1836–1844. [Google Scholar]
- 55. Heffner HJ, Heffner HE (2010) The behavioural audiogram of whitetail deer (Odocoileus virginianus). The Journal of the Acoustical Society of America 127: EL111–EL114. [DOI] [PubMed] [Google Scholar]
Associated Data
This section collects any data citations, data availability statements, or supplementary materials included in this article.
Supplementary Materials
The noise frequency outputs of twelve camera trap models and the background control.
(TIF)
The hearing range of an additional twelve animals in comparison to the noise outputs of a camera trap.
(TIF)
The mean audio outputs of 12 camera trap models at different frequencies.
(DOCX)
Data Availability Statement
The authors confirm that all data underlying the findings are fully available without restriction. Raw audio data have been deposited to the University of New England E-publications Library: une-20140917-091534.


