Abstract
We report that colloid-in-liquid crystal (CLC) gels can be formed via a two-step process that involves spinodal decomposition of a dispersion of colloidal particles in an isotropic phase of mesogens followed by nucleation of nematic domains within the colloidal network defined by the spinodal process. This pathway contrasts to previously reported routes leading to the formation of CLC gels, which have involved entanglement of defects or exclusion of particles from growing nematic domains. The new route provides the basis of simple design rules that enable control of the microstructure and dynamic mechanical properties of the gels.
Introduction
Colloidal gels are typically formed by the aggregation or jamming of a dispersion of colloids into a percolating network. Although colloidal gels exhibit solid-like properties that underlie the design of a wide range of materials, how this class of soft solids forms is not yet fully understood. In particular, the relative importance of thermodynamic and dynamic (non-equilibrium) phenomena underlying the formation of gels is debated.1 Some past studies report routes to gelation that are triggered by thermodynamic instabilities. In this limit, gelation is observed upon a change in a thermodynamic variable that moves the system across a spinodal boundary.1–4 In contrast, other studies have reported gelation to arise from non-equilibrium phenomena, such as jamming, percolation, etc.5 In these cases, gelation is generally reached by kinetic or dynamic arrest of the motion of colloids, making it sometimes difficult to predict when and how gelation occurs.1, 6
The study reported in this paper is focused on gels formed from colloidal dispersions in thermotropic liquid crystals (LCs).7–9 In contrast to gels formed in isotropic solvents, colloid-in-LC (CLC) gels possess mechanical properties that reflect the long-range orientational ordering and associated elasticity of the LC phase.7, 10–16 These attributes and others makes this class of materials rich in fundamental phenomena and also technologically promising.7, 14, 17 Previously, two distinct routes to gelation of colloids in LCs have been reported. First, by using poly-12-hydroxystearic acid-grafted particles of PMMA that were dispersed in isotropic 5CB,8, 9, 18, 19 Terentjev, Poon and coworkers demonstrated that slow cooling of the dispersion led to nucleation and growth of nematic domains and expulsion of the colloids ahead of the growing phase boundary. The growth of the nematic domains was arrested upon jamming of colloids between the domains.8 Second, Wood et al. demonstrated that the same type of colloid, when dispersed directly in nematic 5CB by mechanical shearing, formed a gel at room temperature.20 The formation of the gel was attributed to entanglement of topological (line) defects generated by the colloids in the LC. In this study, we report a third pathway that leads to formation of CLC gels. In contrast to the two previous pathways, the onset of formation of the percolating colloidal network is triggered by a thermodynamic instability (spinodal decomposition) involving the colloids in the isotropic phase of the mesogen. Gelation occurs after the nucleation and growth of nematic LC domains within the confines of the pre-existing cellular microstructure formed by the colloids. Identification of the new pathway leading to formation of a CLC gel is not only fundamentally significant in the context of phase transitions of dispersions of colloids, but also practically important because it enables rational design of the microstructure of this class of soft solids.
Experimental
Materials
Nematic E7 (a mixture of three alkylcyanobiphenyls and one alkylcyanoterphenyl: 51 wt% 4-cyano-4′-pentylcyanobiphenyl (5CB), 25 wt% 4-cyano-4′-n-heptyl-biphenyl, 16 wt% 4-cyano-4′-n-oxyoctyl-biphenyl, and 8 wt% 4-cyano-4′-n-pentyl-p-terphenyl) was purchased from EMD Chemicals (Hawthorne, NY). 1 μm diameter sulfate-coated polystyrene microspheres (PS-colloids) were obtained from Invitrogen® (Carlbad, CA). Sulfuric acid (93–98 wt%) was obtained from Fisher Scientific. (Pittsburgh, PA) Hydrogen peroxide (30% w/v) was obtained from EMD Chemicals Co (Hawthorne, NY). Ethanol was obtained from Decon Lab Inc. Nile Red dye was purchased from Sigma Aldrich (St. Louis, MO). Deionization of distilled water was performed using a MilliQ system (Millipore, Bedford, MA). Fisher’s Finest Glass Slides were obtained from Fisher Scientific (Hampton, NH).
Cleaning of glass substrates
All glass slides used in this study were cleaned prior to use according to the following protocol. First, the glass slides were immersed in acidic piranha solution [70:30 (% v/v) H2SO4:H2O2] for at least 1 h at 60–80°C. Next, the slides were rinsed with copious amounts of distilled and deionized water, followed by three rinses of ethanol and methanol. Finally, the slides were dried under a gaseous stream of nitrogen and stored in an oven at 110°C for at least 3 hours before use.
Preparation of colloid-in-liquid crystal gels
The methods used to prepare CLC gels have been described in detail elsewhere.7, 14, 17 Briefly, the PS-colloids (purchased as dispersions in water) were centrifuged at 9000 rpm for 5 mins. Next, the supernatant was removed and the tube was filled again with water and the colloids were centrifuged a second time. This procedure was performed at least three times. Finally, the microspheres were dried at room temperature for one week.
The desired mass of dried colloids was weighed into an Eppendorf tube and suspended in E7 heated into the isotropic phase (the isotropic-to-nematic transition temperature (TNI) of E7 is 59.4°C). The microspheres were dispersed in the isotropic E7 via sonication and vortexing for several hours. Next, the mixture was cooled to room temperature, which resulted in gelation. Here we note that the PS colloids used in our study have been shown to cause tangential anchoring of 5CB in the nematic phase.21
The films of CLC gels were prepared as follows. A small piece of the CLC gel, prepared as described above, was placed on a clean glass slide, heated until the E7 formed an isotropic phase, and then sandwiched between a second glass slide using polymeric spacers (Mylar film) to obtain the desired separation between the two glass slides. The colloidal dispersion sandwiched between the glass slides was cooled to room temperature at a rate of 0.2 °C/min in a temperature-controlled oven.
Microscopy
Brightfield and polarized light images of the CLC gels were obtained using an Olympus BX60 microscope with a 50X objective. Fluorescent images were obtained with an Olympus IX71 inverted microscope using a 60X objective. A Mettler Toledo FP90 central processor equipped with FP82HT hot stage was used to control the temperature of the CLC films.
Thermal analysis
A differential scanning calorimeter (DSC, Model Q100, TA Instruments, Rheometric Scientific, Piscataway, NJ) was used to measure the TNI of E7. Approximately 10 mg of sample was loaded into aluminum hermetic pans sealed at room temperature. Three temperature scans were made between 80°C and 25°C to determine TNI.
Microscopy-Characterization of gel microstructure
Gels comprised of E7 and dispersions of PS-colloids were sandwiched between glass substrates using Mylar spacers of the desired thickness, as described above. After heating the samples to a temperature between 71.0 to 80.0°C, the films were thermally quenched into the two-phase region by one of two methods. To achieve rapid quenching, we immersed the samples into a preheated water bath at a desired temperature. Alternatively, cooling rates of ~10°C/min were achieved by using a temperature controlled stage. Images were collected every 20 seconds and then processed as described below.
Fourier Transform frequency domain images of the microstructure were obtained using an FFT plug-in with ImageJ (available from NIH). These frequency domain images were then radially averaged using a Radial Average plug-in with ImageJ. A background frequency domain image, obtained by FFT of an image of a dispersion of colloids prior to the thermal quench, was subtracted from the frequency domain images of the quenched samples. The structural peaks present in the frequency domain images were fit to Gaussian functions using a curve-fitting tool in MatLab 2011a. The peak positions, and associated characteristic domain sizes, were obtained from the Gaussian fits. The error bars in Figure 6 show standard deviations calculated from four independent measurements of Qmax at each quench depth. In Figure 7, the error bars show the standard deviation of the distribution of domain sizes within each independent experiment.
Figure 6.
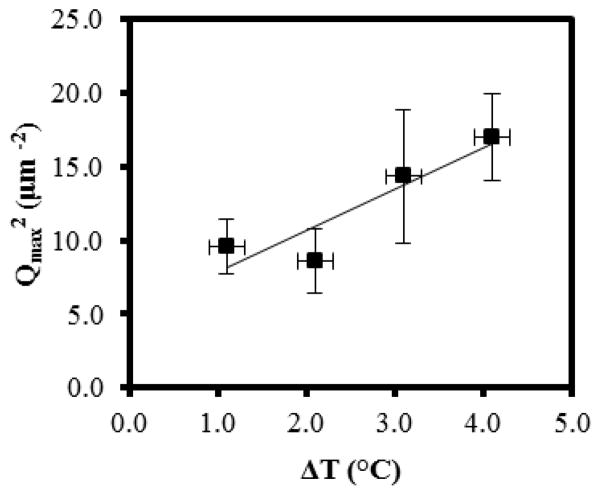
Dependence of Qmax2 on quench depth ΔT for a sample containing 13.3 wt% PS-colloid in E7 (thickness of ~4 μm). (n=4)
Figure 7.
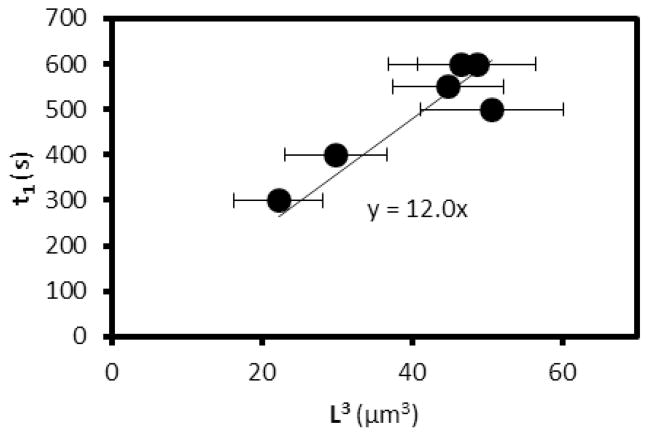
Plot of t1 as a function of L3, as predicted by eqn. (5). See text for discussion.
Rheology
An Advanced Rheometric Expansion System (ARES, TA Instruments, Rheometric Scientific, Piscataway, NJ) equipped with a 25 mm parallel-plate and temperature-controlled oven was used to measure the mechanical properties of the PS-colloid/E7 mixtures. Samples (~300 μl) were loaded between the preheated plates at 80°C with excess material typically extending beyond the plates. A gap of ~0.7 mm between the plates was used in the experiments reported in this paper, and the samples were pre-sheared at 80°C to disperse the colloids before cooling to the desired temperature. All temperature ramp, frequency-sweep, and strain-sweep experiments were performed with controlled shear-strain amplitude. The parameters used in the temperature ramp and frequency-sweep experiments were chosen to be in the linear viscoelastic response regime of the material. To perform frequency-sweep and strain-sweep experiments at the indicated temperatures, the samples were cooled at 1.0 °C/min and measurements were performed immediately after reaching the desired temperatures.
Results and Discussion
Formation of CLC gels
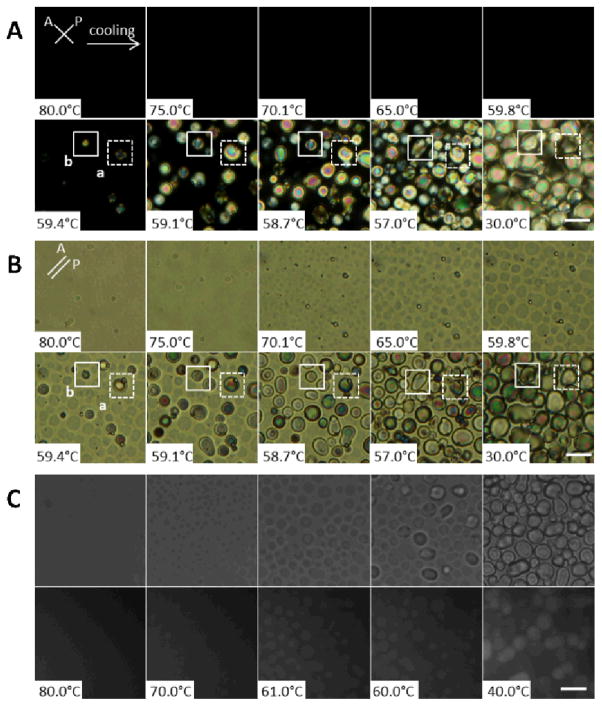
Figure 1 shows a series of optical micrographs obtained during preparation of a CLC gel comprised of 13.3 wt% PS-colloids in E7. The sample was confined between two glass microscope slides that were spaced apart using Mylar films. From observations of the interference colors of the LC, we estimate the distance between the two surfaces of the glass slides to be 4–5 μm (see below for comments regarding thicker samples). The initial temperature of the sample shown in Figure 1 was 80.0°C, and it was subsequently cooled to room temperature at a rate 0.2°C/min while images were collected. The images shown in Figure 1A were obtained using crossed-polarizers (transmission mode). Inspection of Figure 1A reveals that the sample appeared dark between crossed-polars at temperatures above 59.8°C, indicating the sample was isotropic at these elevated temperatures. The appearance of the bright, birefringent regions at 59.4°C indicates the nucleation and growth of nematic domains. Consistent with this result, we measured TNI of E7 to be 59.4°C using DSC. Surprisingly, however, we observed the individual nematic domains to almost cease growing after a period of time, independent of whether or not other LC domains crowded the growing domain. This characteristic of the growth of the nematic domains is highlighted in Figure 1A (see domains labelled as a and b). These two domains can be seen to nucleate at 59.4°C, and grow in size until the temperature reaches 59.1°C at which point their growth appears to cease (at a domain size of ~10–15 μm; also see Figure SI.1). As detailed below, after this initial period of rapid domain growth, we observed some domains to continue to slowly grow via diffusive processes and coalescence (that is growth did not completely cease; see domain b between 58.7°C and 57.0°C). The final domain structure shown in Figure 1A at 30°C is consistent with our past studies of CLC gels formed using E7 and PS-colloids.14, 17 The growth dynamics shown in Figure 1A contrast to past studies of the formation of CLC gels. For example, Terentjev, Poon and coworkers reported that nematic domains of 5CB in dispersions of PMMA colloids continued to grow until adjacent nematic domains collided, resulting in the jamming of colloidal particles between domain boundaries.8, 9 In Figure SI.1 we provide additional comparisons between our observations and those reported in past studies.9
Figure 1.
(A) Polarized light and (B) corresponding brightfield micrographs of a 13.3 wt% PS-colloid/E7 film at the indicated temperatures (cooling at a rate of 0.2°C/min). (C) Brightfield (top row) and fluorescence (bottom row) micrographs of a 13.3 wt% PS-colloid/E7 (doped with 0.1% Nile Red) film at the indicated temperatures (cooling at a rate of 0.2°C/min). The scale bars correspond to 20 μm.
To provide insight into the observations reported in Figure 1A, we collected brightfield images of the sample during cooling (Figure 1B). The homogenous state of the PS-colloid/E7 sample is evident at temperatures of 75.0°C or higher. The brightfield images also reveal that a cellular microstructure formed in the sample at a temperature above the nematic transition of E7 (e.g., at 65.0°C, the cellular microstructure is evident in the images). That is, a cellular microstructure was observed to form in the isotropic phase of E7. As the temperature of the sample was lowered further, the optical contrast between the domains and the walls of the cellular microstructure became more pronounced, and the lateral sizes of the domains increased. At 59.4°C, close to TNI of E7, the nematic phase was observed to nucleate and grow within the pre-existing cellular microstructure, with growth almost ceasing when the nematic phase had filled each cell of the microstructure. In contrast to the previously described mechanism of formation of a CLC gel in which the microstructure of the gel formed during the isotropic-to-nematic transition (Figure 2A), the results in Figure 1B reveal that the microstructure of the CLC gel formed from E7 and PS-colloids was templated by colloidal assemblies formed in the isotropic phase prior to the nematic transition of E7 (Figure 2B).
Figure 2.
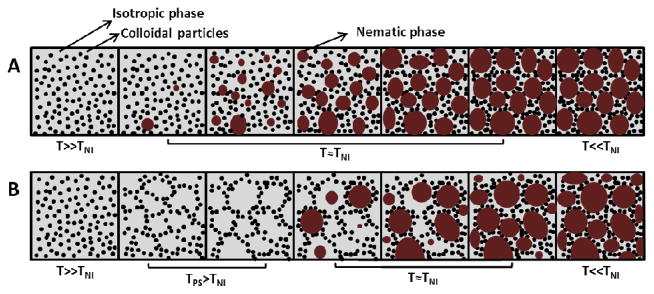
Schematic illustrations of two distinct pathways that lead to formation of CLC gels upon cooling of colloids dispersed initially in an isotropic phase of mesogens (the temperature decreases left to right) (A) The pathway proposed by Terentjev, Poon and coworkers for the PMMA colloids in 5CB.14 (B) The pathway identified in this study for PS-colloids in E7. (Gray: isotropic phase of the nematogens, black: colloids, red: nematic phase of the nematogens, T: temperature of the system, TNI: nematic-to-isotropic phase transition temperature of the pure nematogen, TPS: colloidal phase separation temperature.)
We also collected fluorescence micrographs of a sample of the type described above that was additionally doped with 0.1% Nile Red fluorophore (Figure 1C). The regions with higher intensity of fluorescence signal in Figure 1C at 70.0°C and 61.0°C correspond to discontinuous, nearly circular shaped domains evident in brightfield images (see top row of images in Figure 1C). This observation, when combined with Figure 1A, supports our conclusion that the discontinuous domains above 59.4°C are enriched in isotropic E7, and that the continuous domains are enriched in PS-colloids (as shown in Figure 2B). We present additional images of these microstructures in Figure SI.2. We comment that the formation of the domain structure was found to be reversible. The domains were observed to disappear upon reheating of a sample to 70.1°C and then to reform upon cooling. We also confirm below that the material formed via the pathway described above does possess the mechanical signature of a colloidal gel (see section on Rheology).
Role of thermodynamics in CLC gel formation
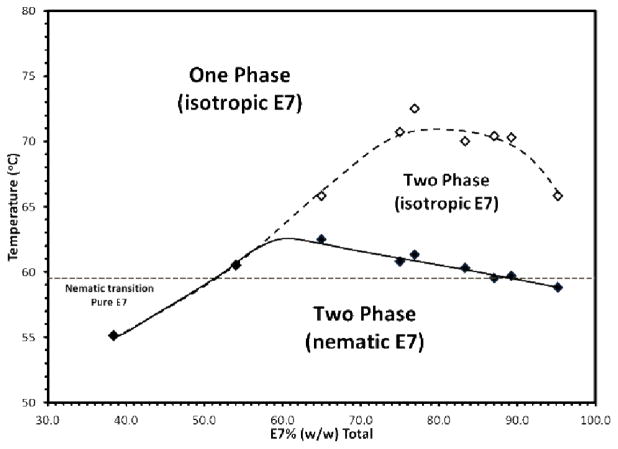
We hypothesized that the cellular microstructure that was observed to form in the isotropic phase of E7 (as described above) arose from the phase separation of the system into colloid-rich and colloid-lean phases. To test this hypothesis, we mapped out the phase diagram of the PS-colloid/E7 system and determined the limits of stability of the single phase dispersion of PS-colloids in E7. Temperature ramp/microscopy measurements of the type shown in Figure 1 were performed as a function of the weight percent of PS-colloids in the E7 (see Figure SI.3 and comments). The temperatures at which (i) the PS-colloids phase separated in the isotropic E7 and (ii) the isotropic E7 transformed into a nematic phase were recorded (Figure 3). In Figure 3, at temperatures above the dashed boundary, stable dispersions of PS-colloids in isotropic E7 were observed, whereas at temperatures below the solid line, a CLC gel with nematic domains was observed. At temperatures between these two boundaries, we observed a cellular microstructure in the isotropic phase of E7, consistent with that shown in Figure 1. We confirmed the locations of the phase boundaries in Figure 3 by using DSC. The phase separation of the PS-colloids coincided with an exothermic process and TNI determined by microscopy agreed with values obtained by using DSC (see Figure SI.4).
Figure 3.
Phase behavior of PS-colloids in E7. Lines are drawn to guide the eye. All samples were sandwiched between two glass slides. Thickness of the samples: ~4 μm. See text for discussion of the effect of sample thickness on the system.
We note here that aspects of the phase diagram shown in Figure 3 are reminiscent of polymer-dispersed LC systems.22–24 In particular, polymers dispersed in isotropic phases of mesogens have been reported to phase separate above the isotropic-nematic transition temperature. The majority of these studies, however, have established the limits of stability in experiments that involved polymerization-induced phase separation. Attempts to characterize the onset and dynamics of the phase separation using light scattering and a PMMA/7CB system revealed dynamics that were sufficiently fast (~10 seconds) that it was not possible to determine the phase separation pathway, i.e. whether phase separation occurs via nucleation-and-growth or spinodal decomposition.25 Simulations have also not provided clear insight into the phase separation pathway.26
We also note that the phase separation of the PS-colloids in the isotropic phase of E7 (as documented in Figure 3) indicates the existence of an effective attraction between the PS-colloids. It is possible that the origin of the attractive interaction between the PS colloids is due to a surface-induced nematic-like layer that forms on the colloid surface above the bulk-nematic isotropic clearing temperature. Two observations support this hypothesis – the phase separation is not seen with isotropic solvents such as silicone oil or glycerol and (ii) the phase separation in E7 is dependent on colloid surface properties. For example, amine-terminated PS-colloids and silica colloids do not form gels through the mechanism described in this paper. Additional studies, however, are needed to establish the origin of the effective attraction between the colloids used in the current study.
Characterization of the dynamics of phase separation
To characterize the dynamics of the phase separation leading to the microstructure shown in Figure 1, a film of E7 containing PS-colloids (13.3 wt%) with a thickness ~4 μm was equilibrated at 71.0°C and then quenched to 67.0°C at a rate ~10.0°C/min while collecting images using brightfield optical microscopy (Figure SI.5). Following the thermal quench, similar to Figure 1B, we observed the homogenous collapse of the film into two phases, resulting in formation of a cellular microstructure in isotropic E7. The observation of the homogenous collapse of the dispersed phase without a latency period (after passing across the phase boundary) in all of our samples is consistent with spinodal decomposition, as described by Cahn-Hilliard theory, which we explore further below.27–29
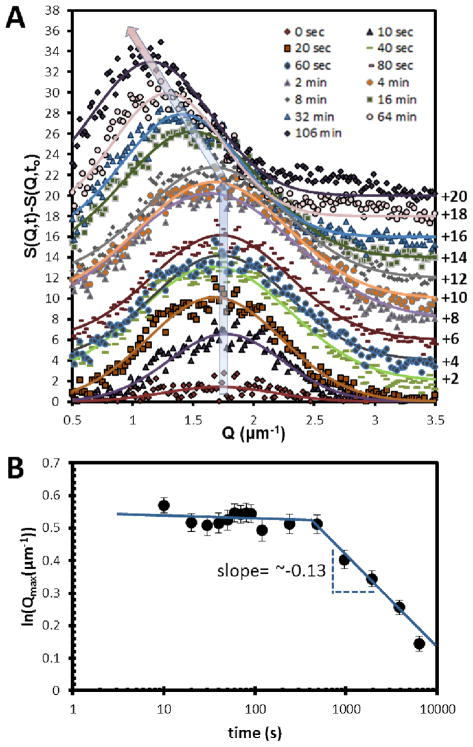
We performed FFT on the images obtained following the thermal quench to calculate structure factors (detailed procedure given in Figure SI.6) and quantify the dynamics of the microstructure evolution. Gaussian functions were fit to the structure factors shown in Figure 4A. The positions of the peaks, as shown in Figure 4B, correspond to the inverse of the lateral sizes of the E7-rich domains. It is evident from inspection of Figure 4B that a structural peak grew at Qmax = 1.7 μm−1 without change in Qmax for ~8 mins. This behavior is also consistent with the predictions of Cahn-Hilliard theory for spinodal decomposition. In brief, Cahn-Hilliard theory predicts that the wavelength of the concentration fluctuations that grow most rapidly will be given by,28, 29
Figure 4.
Microstructural characterization of a film of 13.3 wt% PS-colloids in E7 following a quench from 71.0°C to 67.0°C. (A) Change in the structure factor, S(Q,t) with time plotted as a function of Q. (B) Structural peak position, Qmax, plotted as a function of time. The thickness of the sample was ~4 μm.
| (1) |
where c is the concentration, Rm is the amplification factor of the fastest growing wavelength, t is the time, β is the wavenumber, and βm, is the dominant wavenumber with which the system decomposes. The latter quantity is given by,
| (2) |
where f is the Helmholtz free energy, and κ describes the contribution of the concentration gradients to the free energy of the system and is given by;
| (3) |
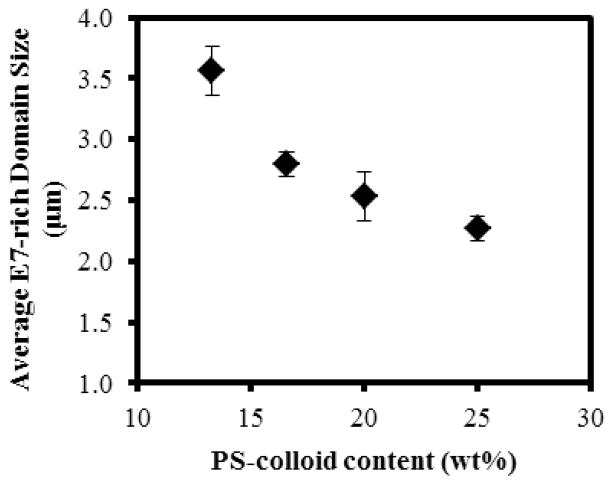
We also note that a kinetic expression derived by Dhont et al. based on the Smoluchowski equation leads to similar predictions to those of the above-described theory.4, 30 As noted above, in our experiments shown in Figure 4, we observed βm to be ~1.7 μm−1 (experimentally reported as Qmax). The corresponding domain size is L ≈ 2π/βm = 3.7 μm, consistent with past studies that have reported L to be several particle diameters in size in the spinodal decomposition regime.31 We measured the domain size L to depend on the concentration of PS-colloids dispersed in E7. Specifically, it was observed to decrease with increasing concentration of the PS-colloids (see Figure 5).
Figure 5.
The average size of the E7-rich domains measured as a function of the PS-colloid concentration following a thermal quench at 10°C/min from 71°C to 67°C (see Methods for details). The thickness of the sample was ~4 μm. (n=3)
Here we also note that long-lived structural peaks at fixed Q have been reported in scattering patterns obtained during colloidal gelation. However, the invariant position of those structural peaks was due to the arrested dynamics of the system after gelation3, 4, 32 We emphasize that the evolution of the microstructure at constant Q, as shown in Figure 4B for the first ~8 mins of our experiment is not due to gelation (see below for characterization by rheology) but rather is a signature of the dynamic process of spinodal decomposition.
We also measured the dynamics of the spinodal decomposition as a function of the depth of the thermal quench (ΔT) below the spinodal (using ~4 μm thick films). The results of these measurements are shown in Figure 6. Inspection of Figure 6 reveals that the measured domain size decreased with increasing depth of the quench. According to the theory proposed by Cahn, βm and ΔT are related by: 28
| (4) |
where s is entropy. This theory predicts a decrease in characteristic domain size with increasing depth of quench, which is consistent with our experimental observations. Although the uncertainty in the experimental data shown in Figure 6 prevents identification of the exact dependence of Qmax on ΔT, we note that it is consistent with a linear dependence of Qmax2 on ΔT (as predicted by eqn (4).
As noted above, Figure 4B shows the position of the structural peak in the radially averaged FFTs, Qmax, plotted as a function of time. The initial period of domain growth at constant Q occurs for about 500 s. This characteristic time (defined here as t1) is consistent with an order-of-magnitude analysis based on the size of the E7-rich domains.31 In brief, the initial growth at constant Q will cease when sufficient time has elapsed for colloids to diffuse a distance corresponding to the size of the domains. This characteristic time can be estimated as,30–33
| (5) |
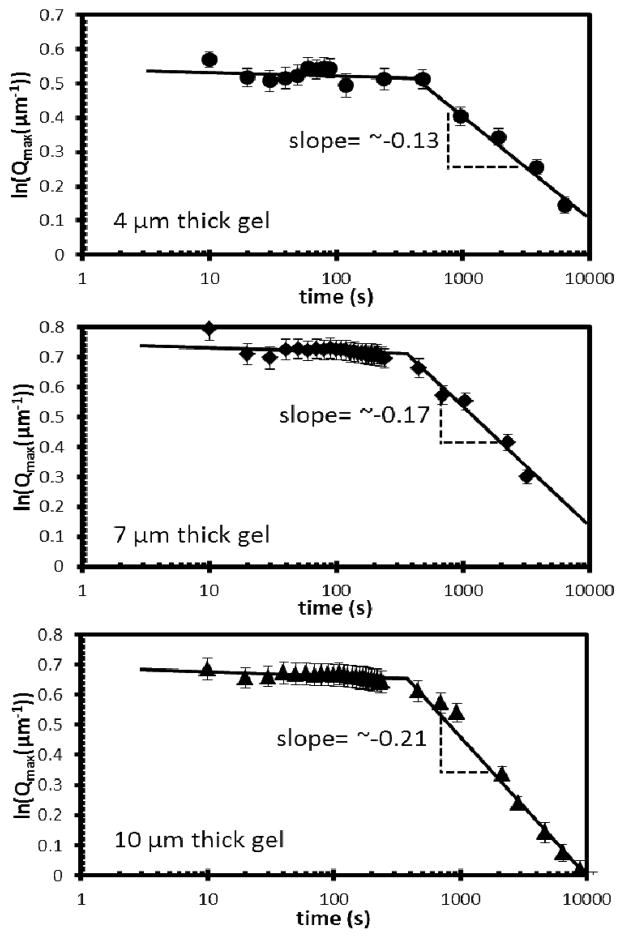
where kB is the Boltzmann constant, η is viscosity and L is the characteristic size of the domains. Experimental values of t1 are plotted in Figure 7 as a function of L3. Inspection of Figure 7 reveals that experimentally measured values of t1 and L are consistent with eqn (5).31–33 From the slope of the plot in Figure 7, we estimate the effective viscosity of the medium through which the colloids diffuse to be ~55 mPa.s. Although we do not have independent measurements of the viscosity of isotropic E7, past studies have reported the viscosity of isotropic 5CB at 40°C to be 22 mPa.s.34 Because E7 contains higher molecular weight mesogens that 5CB, we would expect its viscosity in the isotropic phase to be higher than 5CB. In the diffusive coarsening regime (t > t1), eqn. (5) predicts that the slope of a plot of ln(Qmax) vs ln(t) is −1/3. However, the slope that we measured with PS-colloids and E7 confined within a film of thickness ~4 μm was −0.13 (see Figure 4B). We note, however, that the lateral size of the domains formed during the initial linear growth period was ~4 μm (= 2π/Qmax), which is comparable to the thickness of the film. We hypothesized that the small magnitude of the exponent was, therefore, due to confinement of the E7-rich domains within the thin film. To test this proposition, we measured the dynamics of evolution of the microstructure as a function of the thickness of the film (Figure 8; film thicknesses of 4 μm, 7 μm, and 10 μm; temperature of 67°C). As shown in Figure 8, we observed the slope to increase in magnitude from −0.13 to −0.21 as the thickness of the CLC gel film increased from 4 μm to 10 μm. This result supports our hypothesis that confinement of the film is responsible for the slower rate of coarsening of the microstructure.
Figure 8.
Structural peak position, Qmax, plotted as a function of time for 13.3 wt% PS-colloid/E7 films of indicated thicknesses. The temperature of each system was 67°C.
We end by noting that we did not observe arrest of the coarsening of the E7-rich domains in experiments performed above TNI (see Figure 8). This contrasts to some past studies of colloidal phase separation where spinodal decomposition was followed by arrest of particle motion and gelation.4 Below we report rheological measurements that were performed to provide additional insight into the mechanism of gelation of the PS-colloid/E7 system. For clarity, we note here that the mechanical signature of a gel was observed in the PS-colloid/E7 system at temperatures below TNI.
Rheology
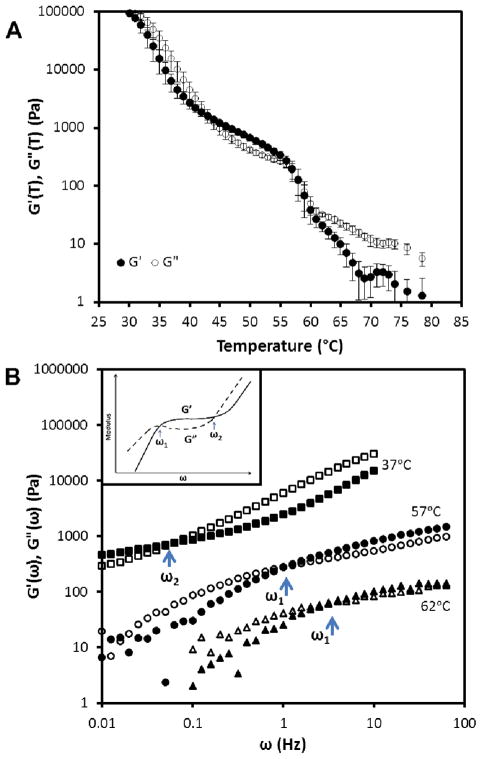
We investigated the rheology of the PS-colloid/E7 system by performing temperature ramp and frequency-sweep experiments under dynamic mode at fixed strain amplitude. Figure 9A shows the storage and loss moduli of a 13.3 wt% PS-colloid/E7 sample measured as a function of temperature. The sample was cooled at 1.0°C/min from 80.0°C at 2% strain and a frequency of 2 Hz. We confirmed that these strain and frequency values correspond to the linear response regime of the material. Upon cooling, we measured the storage modulus to increase from 3 ± 1 Pa at 70.0°C to 25 Pa at 60.5°C, followed by an increase to 220 Pa at 57°C (following passage across TNI). With additional cooling, we observed the storage modulus at 30°C to reach G′~105 Pa.
Figure 9.
(A) Temperature (at 2 Hz, 2% strain) and (B) frequency (at 2% strain and indicated temperature) dependence of storage (filled symbols) and loss (open symbols) modulus of 13.3 wt% PS-colloids in E7. The inset in B shows an illustration of a typical frequency-response of a colloidal gel; fluidization for ω<ω1, elastic response for ω1<ω<ω2, viscous dissipation for ω>ω2.
We interpret the change in modulus between 70.0°C and 60.5°C to be due to enrichment of the colloids in the continuous colloid-rich phase that forms upon spinodal decomposition in isotropic E7. At 60.5 °C, we estimate the concentration of colloids in the colloid-rich phase to be ~40 vol% (assuming all colloids are present in the continuous colloid-rich phase). Past studies have established that monodisperse hard sphere systems exhibit a glassy arrest at ~56 vol% of the particles.35 We do not, therefore, expect arrest of colloid mobility when the colloids are concentrated to 40 vol%. This conclusion is supported by the frequency-response of measurements that are presented below.
As mentioned above, following cooling to 57°C from 60.5°C (TNI = 59.4°C), we observed the storage modulus to increase from ~25 Pa to ~220 Pa. We estimated the contribution of the nematic elasticity of the E7-rich domains to the modulus as G′~K/L2, where K is the Frank elastic constant (10−11 J/m) and L is the nematic domain size.20, 36 For L~5 μm, we calculate G′ as ~2 Pa, which is two orders of magnitude smaller that the measured increase in the modulus. Alternatively, we considered it possible that an increase in concentration of colloids in the colloid-rich continuous phase might be responsible for the change in mechanical properties at TNI. In support of this mechanism, we estimated the concentration of colloids in the colloid-rich phase by determining the volume fraction of the colloid-rich phase in the sample using optical microscopy. We estimated the concentration of colloids in the colloid-rich phase to increase to ~50 vol% from ~40 vol% upon passing across TNI. Furthermore, the increase in modulus below 40°C (to 100 kPa) was accompanied by formation of an even higher concentration of colloids in the continuous phase. We estimated the colloid concentration in the colloid rich phase of a 13.3 wt% gel at 30.0 °C to be ~55 vol%, a value that coincides with the concentration of colloids at which glassy arrest of hard-sphere colloids has been observed.
Figure 9B shows the frequency response of the storage and loss moduli of a 13.3 wt% PS-colloids/E7 sample at temperatures corresponding to (i) a cellular microstructure in the isotropic phase of E7 (62.0°C) and (ii) a cellular microstructure in the nematic phase of E7 (37.0°C and 57.0°C). Prior to performing these measurements, the samples were pre-sheared at 80.0°C and cooled at a rate 1.0°C/min to the desired temperature. The frequency sweep experiments were performed immediately after cooling to the desired temperature.
At low frequencies (ω < 4 Hz), the sample at 62.0°C exhibited liquid-like behavior (G″ > G′, where G″ is the loss modulus and G′ is the storage modulus). Around 4 Hz, a crossover to a solid-like regime (G′ > G″) was measured (ω1 in the inset of Figure 9B). When cooled to 57.0°C, although below TNI, the sample exhibited a similar frequency-dependent behavior but with moduli that were an order of magnitude higher. The crossover (ω1) was also displaced to a lower frequency (approximately 1 Hz). The liquid-like response measured at low frequencies is consistent with particle mobility and reorganization on the time-scale of the strain.37 The mobility of the colloids inferred from the frequency-response measurement is consistent with microscopy-based observations of diffusive coarsening of the microstructure at the two temperatures mentioned above (see above). On time-scales shorter than ~1 s, however, colloid reorganization was evidently limited during the strain and the material exhibited a solid-like behavior. We emphasize that these samples did not exhibit a solid-like response at low frequencies, consistent with our conclusion that the colloid concentrations in the continuous phase were too low to cause glassy arrest (see above). We also note that the difference in cross-over frequency (ω1) measured at 57.0°C and 62.0°C is consistent with the measured difference in coarsening rate of the PS-colloid/E7 mixtures above and below the TNI (Figure SI.7).
At temperatures well below TNI (e.g., 37°C, as described below), we observed 13.3 wt% PS-colloid/E7 to form a solid-like CLC gel. (Figure 9B) At low frequencies, the sample exhibited solid-like behavior (G′>G″), with a plateau modulus of G′~500 Pa. With increasing frequency, the sample exhibited a crossover to liquid-like behavior at a frequency of ω2~0.1 Hz. The plateau in storage modulus and crossover to a fluid-like regime at higher frequency are both characteristic of colloidal gels, as previously reported.2, 38 At low frequencies, the elasticity of the colloidal network dominates the mechanical properties of the system (in contrast to the sample near TNI, the colloids do not possess sufficient mobility to relax in response to applied strain at low frequency) whereas at high frequencies, dissipative processes associated with the viscosity of the LC phase dominates the rheology.2, 38 Consistent with this interpretation, we observed the coarsening of the microstructure of a 13.3 wt% PS-colloid/E7 gel at 35°C to arrest (no measurable coarsening).
We end this section by emphasizing the contrasting frequency response of the PS-colloid/E7 samples near TNI and when quenched below TNI. First, we note that at 37°C, we observed a cross-over at high frequency to G″>G′, consistent with the role of viscous dissipation within the LC-rich domain of the material. In contrast, within the frequency range accessible on our rheometer, we did not observe G″>G′ in the limit of high frequency for the samples near TNI. We do predict that a second cross-over will exist, but it appears to lie beyond the frequency range accessible with our rheometer. Indeed, it appears possible that the sample at 62°C may be exhibiting the cross-over at the upper limit of the frequency range of our experiment (see Fig. 8B).
Control of gel microstructure using spinodal decomposition
The results described above establish that the microstructure of CLC gels of PS-colloids in E7 form via spinodal decomposition in the isotropic phase of E7. This result has the practical advantage that the scaling relationships described above can be used to design the microstructure of CLC gels. In this section, we illustrate this opportunity by demonstrating control of the LC-rich domain size of the CLC gel via spinodal decomposition. The results described above indicate that the LC-rich domain size of a CLC gel can be manipulated via control of either the depth of the thermal quench into the two phase region or via diffusive ripening of the microstructure following phase separation. The results shown in Figure 10 demonstrate the latter strategy. A film of PS-colloids in E7 with thickness of ~4 μm was quenched into the two-phase region to a temperature of 61.0°C (isotropic phase of E7), and then annealed at constant temperature for a desired length of time. Subsequently, the film was cooled at a rate 0.2°C/min to 30.0°C. Inspection of Figure 10 reveals that the sample held ~2 h at 61.0°C possesses a microstructure with a characteristic size of ~5.4 μm whereas the sample held ~2 days at 61.0°C had a domain size of ~10.9 μm. Upon subsequent cooling into the nematic phase of E7, this difference between average sizes of the E7-rich domains was largely preserved (at 59°C, a sample annealed for 2 h at 61.0°C exhibited an average E7-rich domain size of ~5.6 μm whereas sample annealed for ~2 days at 61.0°C exhibited a domain size of ~10.8 μm). Further cooling to 30°C resulted in domain sizes of ~7.5 μm and ~12.4 μm, respectively. Overall, these results suggest the basis of a general and facile means of designing the microstructure of this emerging and technologically important class of responsive soft solids.14, 17
Figure 10.
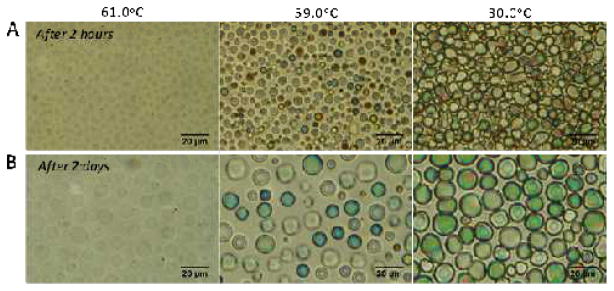
Bright-field micrographs of 13.3 wt% PS-colloid in E7 at the indicated temperatures (A) Sample after equilibration for 2 hours at 61.0°C following a rapid quench from 80.0°C. Subsequently, the sample was cooled to 59.0°C then 30.0°C at a rate of 0.2°C/min. (B) Sample after equilibration for 2 days at 61.0°C following a rapid quench from 80.0°C. Subsequently, the sample was cooled to 59.0°C then 30.0°C at a rate of 0.2°C/min.
Conclusion
In summary, we have unmasked a new pathway that leads to the formation of CLC gels. The onset of the process that ultimately results in gelation is triggered by a thermodynamic instability. Specifically, a cellular microstructure that involves coexisting particle-rich and particle-lean phases is formed by spinodal decomposition in the isotropic phase of the mesogens. This cellular microstructure serves as a template for the CLC gel, with the nematic domains growing within the E7-rich domains confined by the particle-rich boundaries of the domains. We note, in addition, that the results reported in this paper also generate a number of key questions that are yet to be answered. We do not yet fully understand, for example, the origin of the effective attraction between the PS-colloids in the isotropic E7 that triggers the spinodal decomposition. It is possible that nematic fluctuations or surface-induced prenematic ordering in the isotropic phase of E7 underlie this attraction.26 In addition, we note that spinodal decomposition of colloidal and macromolecular systems is typically accompanied by formation of a bicontinuous microstructure (although exceptions do exist such as, for example, cases in which the viscosities of the separate phases differ greatly39). We do not, even at the shortest times of our observations, find evidence of such a bicontinuous microstructure. Instead, we observe the formation of a microstructure that we interpret to comprise a continuous particle-rich phase and a discontinuous E7-rich phase. While these and other mysteries remain to be resolved, the results presented in this paper clearly establish that the microstructure of the gel is controlled by dynamics associated with a thermodynamic instability. This is shown to permit systematic control over the microstructure of the CLC gels. Because the dynamic and mechanical properties of CLC gels are influenced by the microstructure, this advance opens up new ways to design responsive CLC gels.
Supplementary Material
Acknowledgments
The experiments reported in this paper were primarily supported by NSF through DMR-1121288 (Materials Research Science and Engineering Center), and the theory was supported by Department of Energy, Basic Energy Sciences DE-SC00004025. Partial support from the Army Research Office (W911NF-11-1-0251 and W911NF-10-1-0181), and the National Institutes of Health (CA108467and AI092004) is also acknowledged. The authors thank Professors Jan Dhont, Michael Cates, Paul Clegg, Ken Schweizer and Henk Lekkerkerker for insightful comments and helpful suggestions.
Footnotes
Electronic Supplementary Information (ESI) available: Additional images of CLC gels, experimental procedure details, some additional coarsening and phase separation dynamics measurements. See DOI: 10.1039/b000000x/
References
- 1.Zaccarelli E. Journal of Physics: Condensed Matter. 2007;19:1–50. [Google Scholar]
- 2.Lu PJ, Weitz DA. Annual Review of Condensed Matter Physics. 2013;4:217–233. [Google Scholar]
- 3.Lu PJ, Zaccarelli E, Ciulla F, Schofield AB, Sciortino F, Weitz DA. Nature. 2008;453:499–503. doi: 10.1038/nature06931. [DOI] [PubMed] [Google Scholar]
- 4.Verduin H, Dhont JKG. Journal of Colloid and Interface Science. 1995;172:425–437. [Google Scholar]
- 5.Trappe V, Prasad V, Cipelletti L, Segre PN, Weitz DA. Nature. 2001;411:772–775. doi: 10.1038/35081021. [DOI] [PubMed] [Google Scholar]
- 6.Herzig EM, White KA, Schofield AB, Poon WCK, Clegg PS. Nature Materials. 2007;6:966–971. doi: 10.1038/nmat2055. [DOI] [PubMed] [Google Scholar]
- 7.Agarwal A, Huang E, Palecek S, Abbott NL. Advanced Materials. 2008;20:4804–4809. [Google Scholar]
- 8.Meeker SP, Poon WCK, Crain J, Terentjev EM. Physical Review E. 2000;61:R6083–R6086. doi: 10.1103/physreve.61.r6083. [DOI] [PubMed] [Google Scholar]
- 9.Vollmer D, Hinze G, Ullrich B, Poon WCK, Cates ME, Schofield AB. Langmuir. 2005;21:4921–4930. doi: 10.1021/la047090w. [DOI] [PubMed] [Google Scholar]
- 10.Bai Y, Abbott NL. Langmuir. 2011;27:5719–5738. doi: 10.1021/la103301d. [DOI] [PMC free article] [PubMed] [Google Scholar]
- 11.de Gennes PG, Prost J. The Physics of Liquid Crystals. 2. Oxford; New York: 1993. [Google Scholar]
- 12.Lockwood N, Gupta J, Abbott NL. Surface Science Reports. 2008;63:255–293. [Google Scholar]
- 13.Loudet JC, Barois P, Poulin P. Nature. 2000;407:611–613. doi: 10.1038/35036539. [DOI] [PubMed] [Google Scholar]
- 14.Pal SK, Agarwal A, Abbott NL. Small. 2009;5:2589–2596. doi: 10.1002/smll.200900961. [DOI] [PubMed] [Google Scholar]
- 15.Petrov PG, Terentjev EM. Langmuir. 2001;17:2942–2949. [Google Scholar]
- 16.Poulin P, Stark H, Lubensky TC, Weitz DA. Science. 1997;275:1770–1773. doi: 10.1126/science.275.5307.1770. [DOI] [PubMed] [Google Scholar]
- 17.Agarwal A, Sidiq S, Setia S, Bukusoglu E, de Pablo JJ, Pal SK, Abbott NL. Small. 2013;9:2785–2792. doi: 10.1002/smll.201202869. [DOI] [PMC free article] [PubMed] [Google Scholar]
- 18.Anderson VJ, Terentjev EM, Meeker SP, Crain J, Poon WCK. The European Physical Journal E. 2001;4:11–20. [Google Scholar]
- 19.Vollmer D, Hinze G, Poon WCK, Cleaver J, Cates ME. Journal of Physics: Condensed Matter. 2004;16:L227–L233. [Google Scholar]
- 20.Wood TA, Lintuvuori JS, Schofield AB, Marenduzzo D, Poon WCK. Science. 2011;334:79–83. doi: 10.1126/science.1209997. [DOI] [PubMed] [Google Scholar]
- 21.Mondiot F, Wang X, de Pablo JJ, Abbott NL. Journal of the American Chemical Society. 2013;135:9972–9975. doi: 10.1021/ja4022182. [DOI] [PMC free article] [PubMed] [Google Scholar]
- 22.Benmouna F, Daoudi A, Roussel F, Leclercq L, Buisine JM, Coqueret X, Benmouna M, Ewen B, Maschke U. Macromolecules. 2000;33:960–967. [Google Scholar]
- 23.Mucha M. Progress in Polymer Science. 2003;28:837–873. [Google Scholar]
- 24.Roussel F, Buisine JM, Maschke U, Coqueret X, Benmouna F. Physical Review E. 2000;62:2310–2316. doi: 10.1103/physreve.62.2310. [DOI] [PubMed] [Google Scholar]
- 25.Ahn W, Kim CY, Kim H, Kim SC. Macromolecules. 1992;25:5002–5007. [Google Scholar]
- 26.Kyu T, Chiu HW. Polymer. 2001;42:9173–9185. [Google Scholar]
- 27.Cahn JW. Acta Metallurgica. 1961;9:795–801. [Google Scholar]
- 28.Cahn JW. The Journal of Chemical Physics. 1965;42:93. [Google Scholar]
- 29.Cahn JW, Hilliard JE. The Journal of Chemical Physics. 1958;28:258. [Google Scholar]
- 30.Dhont JKG, Duyndam AFH, Ackersod BJ. Langmuir. 1992;8:2907–2912. [Google Scholar]
- 31.Aarts DGAL, Dullens RPA, Lekkerkerker HNW. New Journal of Physics. 2005;7:40–40. [Google Scholar]
- 32.Poon WCK, Pirie AD, Pusey PN. Faraday Discussions. 1995;101:65–76. [Google Scholar]
- 33.Siggia ED. Physical Review A. 1979;20:595–605. [Google Scholar]
- 34.Koenig GM, Ong R, Cortes AD, Moreno-Razo JA, de Pablo JJ, Abbott NL. Nano letters. 2009;9:2794–2801. doi: 10.1021/nl901498d. [DOI] [PubMed] [Google Scholar]
- 35.Mason TG, Weitz DA. Physical Review Letters. 1995;75:2770–2773. doi: 10.1103/PhysRevLett.75.2770. [DOI] [PubMed] [Google Scholar]
- 36.Zapotocky M, Ramos L, Poulin P, Lubensky TC, Weitz D. Science. 1999;283:209–212. doi: 10.1126/science.283.5399.209. [DOI] [PubMed] [Google Scholar]
- 37.Wyss H, Miyazaki K, Mattsson J, Hu Z, Reichman D, Weitz DA. Physical Review Letters. 2007;98:238303. doi: 10.1103/PhysRevLett.98.238303. [DOI] [PubMed] [Google Scholar]
- 38.Trappe V, Weitz DA. Physical review letters. 2000;85:449–452. doi: 10.1103/PhysRevLett.85.449. [DOI] [PubMed] [Google Scholar]
- 39.Onuki A. Europhysics Letters. 1994;28:175–179. [Google Scholar]
Associated Data
This section collects any data citations, data availability statements, or supplementary materials included in this article.


