

In synchronized Chlamydomonas reinhardtii cells, the carbon-concentrating mechanism is induced prior to dawn, which coincides with the relocalization of key proteins to the chloroplast pyrenoid.
Abstract
In the model green alga Chlamydomonas reinhardtii, a carbon-concentrating mechanism (CCM) is induced under low CO2 in the light and comprises active inorganic carbon transport components, carbonic anhydrases, and aggregation of Rubisco in the chloroplast pyrenoid. Previous studies have focused predominantly on asynchronous cultures of cells grown under low versus high CO2. Here, we have investigated the dynamics of CCM activation in synchronized cells grown in dark/light cycles compared with induction under low CO2. The specific focus was to undertake detailed time course experiments comparing physiology and gene expression during the dark-to-light transition. First, the CCM could be fully induced 1 h before dawn, as measured by the photosynthetic affinity for inorganic carbon. This occurred in advance of maximum gene transcription and protein accumulation and contrasted with the coordinated induction observed under low CO2. Between 2 and 1 h before dawn, the proportion of Rubisco and the thylakoid lumen carbonic anhydrase in the pyrenoid rose substantially, coincident with increased CCM activity. Thus, other mechanisms are likely to activate the CCM before dawn, independent of gene transcription of known CCM components. Furthermore, this study highlights the value of using synchronized cells during the dark-to-light transition as an alternative means of investigating CCM induction.
Carbon-concentrating mechanisms (CCMs) have evolved in most unicellular aquatic photosynthetic organisms to compensate for the kinetic constraints of the primary carboxylase Rubisco (Spreitzer and Salvucci, 2002) and limited availability of dissolved carbon dioxide (CO2). In eukaryotic algae (Giordano et al., 2005; Moroney and Ynalvez, 2007; Wang et al., 2011) and cyanobacteria (Price et al., 2008), these CCMs are biophysical means of concentrating CO2 around Rubisco, thereby favoring the carboxylation reaction and improving growth in CO2-limited environments.
In the model green alga Chlamydomonas reinhardtii, three elements are important for CCM activity: first, inorganic carbon (Ci) transporters at the plasma membrane and chloroplast envelope (Spalding, 2008); second, carbonic anhydrases, which facilitate the interconversion of CO2 and HCO3– and operate in parallel within each cellular compartment (Moroney et al., 2011); and third, the localization of Rubisco to a chloroplast microcompartment called the pyrenoid to minimize CO2 leakage (Ma et al., 2011; Meyer et al., 2012). The CCM is induced at low (air level) CO2 concentrations, resulting in an increased whole-cell affinity for Ci and internal Ci accumulation (Badger et al., 1980), coincident with the de novo synthesis of several proteins (Manuel and Moroney, 1988).
Further candidate CCM genes have been identified as low CO2-induced through microarray and transcriptomic studies (Miura et al., 2004; Yamano et al., 2008; Brueggeman et al., 2012, Fang et al., 2012) or by isolating mutants with reduced growth or Ci accumulation at low CO2 (Spalding et al., 1983; Colombo et al., 2002; Thyssen et al., 2003). Low CO2-induced genes investigated in this study include several Ci transporter candidates, some of which are among the most highly induced genes under low CO2 (Brueggeman et al., 2012). High Light-Activated3 (HLA3) encodes a plasma membrane-localized ABC-type transporter (Duanmu et al., 2009), Low CO2-Inducible1 (LCI1) encodes another plasma membrane transporter (Ohnishi et al., 2010), and LCIA, Chloroplast Carrier Protein1 (CCP1), and CCP2 all encode proteins putatively involved in Ci transport and associated with the chloroplast envelope (Wang et al., 2011).
Two carbonic anhydrases were also of interest. The Carbonic Anhydrase1 (CAH1) gene encodes a periplasmic carbonic anhydrase and is highly CO2 responsive, although CAH1-deficient mutants retain a functional CCM (Van and Spalding, 1999). CAH3 encodes a thylakoid-lumenal carbonic anhydrase essential for growth at ambient CO2, although the gene is minimally CO2 responsive and the protein is expressed equally under high and low CO2 (Karlsson et al., 1998).
Expression of other CCM-related genes was also determined, including Low-CO2 Stress Response1 (LCR1), which encodes a MYB-domain transcription factor upstream of CAH1 and LCI1 and downstream of CCM master regulator Inorganic Carbon Accumulation5 (CIA5 [also known as CCM1]; Yoshioka et al., 2004). LCIB and LCIC, which form a peripyrenoidal complex associated with carbon recapture (Wang and Spalding, 2014), were also included in this study, as were RBCS and rbcL, which encode the small and large subunits of Rubisco, the major pyrenoid component (Borkhsenious et al., 1998).
In addition to CO2 responsiveness, CCM activity in C. reinhardtii is associated with light and photosynthesis. In particular, accumulation of Ci in C. reinhardtii cells and chloroplasts is light dependent (Spalding and Ogren, 1982) and may be driven by ATP from cyclic electron transport (Spalding et al., 1984). HLA3 is a member of the ATP-binding cassette superfamily, which suggests light dependency, and HLA3 expression is inhibited by 3-(3,4-dichlorophenyl)-1,1-dimethylurea and in PSI and PSII mutants (Im and Grossman, 2002). Although originally identified as a high light-induced gene, HLA3 may in fact be responding to low CO2 levels brought about by increased photosynthesis at higher light intensities, consistent with the induction of other CCM genes under these conditions (Im and Grossman, 2002). Similarly, CAH1 transcription requires light, low CO2, and photosynthetic electron flow (Dionisio-Sese et al., 1990). At the protein level, the LCIB-LCIC complex relocalizes from the stroma to the area around the pyrenoid both in response to light and to CO2 levels (Yamano et al., 2010). However, cells acclimating to low CO2 induce external carbonic anhydrase activity and active HCO3– transport even in the dark, although induction is delayed compared with cells switched to low CO2 in the light (Bozzo and Colman, 2000). This suggests that light, while an important regulator of CCM activity, is not an absolute requirement for expression of CCM components. In synchronized cells grown at ambient CO2, genes encoding putative Ci transporters and mitochondrial carbonic anhydrases are transcriptionally up-regulated in the light, whereas other key CCM gene transcripts (CAH3, stromal carbonic anhydrase CAH6, and LCIB) reach maximum levels during the last half of the dark period (Tirumani et al., 2014).
While the majority of experiments investigating CCM induction have used cells in asynchronous cultures grown in continuous light, the aim of this study was to investigate the dynamics of CCM induction and molecular regulation in synchronized cells grown in dark/light cycles, focusing on a detailed time course during the dark-to-light period transition. Given the apparent down-regulation of the CCM in the dark (Marcus et al., 1986), we hypothesized that induction of the CCM during the dark-to-light transition might involve nontranscriptional/translational mechanisms regulating existing CCM components, unlike the CO2 response, which requires strong transcriptional up-regulation and de novo protein synthesis.
To investigate possible mechanisms of CCM regulation in synchronized cells, whole cell affinity for Ci (K0.5; the concentration of Ci required for half-maximal photosynthetic rates) as well as the relative abundance of known CCM (CO2-responsive) gene transcripts and proteins were measured across the dark-to-light transition, and unsynchronized cultures adapting to low CO2 were used as a control. We also set out to determine the extent that the thylakoid lumenal CAH3 and Rubisco relocalized from the stroma to the pyrenoid during the dark-to-light transition, because this preferential localization appears to be required for a fully functioning CCM (Blanco-Rivero et al., 2012; Meyer et al., 2012).
Unsynchronized cells adapting to low CO2 showed rapid increases in mRNA levels of CCM genes, followed by increased protein abundance and then CCM activity. In synchronized cells, CCM activity was initially down-regulated in the dark, but full CCM activity was inducible before dawn and also prior to maximum mRNA and protein accumulation. Rubisco and CAH3 were both found to have relocalized to the pyrenoid, coincident with increased CCM activity.
RESULTS
The CCM Is Partially Repressed in the Dark But Can Be Induced 1 h before Dawn
CCM induction during the dark-to-light transition was measured at the whole-cell and molecular level to identify factors affecting CCM regulation in synchronized cultures. Whole-cell affinity for Ci (K0.5) was derived using an oxygen electrode and HCO3– addition responses, following a light pretreatment used to deplete residual Ci supplies. In synchronized cells, K0.5 for Ci was measured from 2 h before dawn to 6 h after dawn (Fig. 1A). A relatively high K0.5 value (60 μm Ci) was found toward the end of the dark period (–2 h), indicating that the CCM was at least partially repressed in the dark, even after the short light pretreatment. From this time point, CCM inducibility rapidly increased, so that 1 h before dawn, cells were able to express a fully functioning CCM (as indicated by a low K0.5 of 11 µm Ci). This high affinity for Ci was maintained through dawn and the first 6 h of the light period (mean K0.5 of 11 to 19 μm Ci).
Figure 1.

Whole-cell affinity for Ci (K0.5) measured in wild-type C. reinhardtii during CCM induction in synchronized cells during the dark-to-light transition (A) and in response to low CO2 in asynchronous cultures (B). Synchronized cells were grown in 12-h/12-h dark/light cycles under low CO2 and harvested during the third dark-to-light transition after dilution (dawn = 0 h). Asynchronous cells were grown to midlog phase in high CO2 and harvested following the switch to low CO2 (time = 0 h). Values are mean ± 1 se of three to five independent experiments.
To provide a direct comparison for dark-to-light time courses, CCM induction in asynchronous cultures grown in continuous light and switched to low CO2 was also investigated. The very high K0.5 value (240 µm Ci) of high CO2-adapted cells indicated that the CCM was fully repressed at the beginning of the time course (Fig. 1B). Affinity for Ci rapidly increased following the transfer to low CO2, with the measured K0.5 reduced to 105 µm Ci within 1 h of the shift to low CO2. Cells showed maximum CCM induction (highest affinity for Ci) after 4 to 6 h at low CO2, as indicated by low K0.5 values (25–40 µm Ci). The maximum K0.5 value measured for high CO2-adapted cells was greater than that observed in dark-adapted (–2 h) cells, as was the overall decrease in K0.5 during each time course (10- and 6-fold, respectively), which suggests that the CCM was repressed to a greater extent at high CO2 than 2 h before dawn.
Maximum Gene Expression Occurs after CCM Induction during the Dark-to-Light Transition
In this comparative study between CCM regulation during the dark-to-light transition and the conventional CO2 response, quantitative reverse transcriptase (qRT)-PCR was used to track expression of CO2-responsive genes. Gene expression was quantified relative to the control gene Guanidine Nucleotide-Binding Subunit Beta-Like Protein (GBLP) and to the first time point. In synchronized cells 2 h before dawn, CCP1, CCP2, LCI1, LCIA, LCIB, and LCIC were all present at similar levels to high CO2-adapted cells (Supplemental Table S1). CAH1, LCR1, and rbcL were present in greater abundance, while HLA3 and RBCS were present in lesser abundance in dark-/light-grown (harvested in the dark 2 h before dawn [–2D]) compared with high CO2-grown (0 h) cells. Maximum levels of CAH1, CCP1, LCI1, LCIA, LCIB, and LCIC mRNA were not significantly different between dark/light and CO2 time courses (Supplemental Table S2). Some differences were observed in the maximum abundance of CCP2, HLA3, LCR1, rbcL, and RBCS, but these were below one order of magnitude and smaller than the differences observed at the beginning of the time courses. Overall, this indicates that transcriptional regulation during CCM induction in response to light is similar to that of CO2.
In synchronized cells, many CO2-responsive genes (CCP1, CCP2, LCI1, LCIA, LCIB, and LCIC) were up-regulated during the light period to a similar extent as for the CO2 response (Fig. 2; Supplemental Tables S3 and S4). However, the majority of transcriptional up-regulation did not occur until several hours after maximum CCM activity was observed (Figs. 1A and 2; Supplemental Fig. S1; Supplemental Table S2), contrasting with the concurrent CCM activation and low CO2-induced gene induction observed in cells adapting to low CO2 (Figs. 1B and 3; Supplemental Fig. S1; Supplemental Table S2).
Figure 2.

Expression profiles of CCM genes in synchronized cells during the dark-to-light transition. mRNA abundance was determined using qRT-PCR and normalized to mRNA levels in –2D cells and to GBLP (control gene) expression. Growth and harvest conditions were as described in Figure 1. During the dark period (–2 and –1 h), mRNA was harvested from cells taken either straight from the dark (D) or after a brief illumination in the oxygen electrode chamber (L) to mimic the light pretreatment necessary for K0.5 measurements. Values are mean ± 1 se of three to seven separate flasks harvested across at least three independent experiments.
Figure 3.

Expression profiles of CCM genes in asynchronous cells adapting to low CO2. mRNA abundance was determined using qRT-PCR and normalized to mRNA levels in high CO2-adapted cells and to GBLP (control gene) expression. Values are mean ± 1 se of three separate flasks harvested during a single experiment.
Although CO2-responsive genes were consistently up-regulated in the light, there were systematic differences in the timing of maximum mRNA expression compared with the CO2 response. For example, Ci transporter transcripts (CCP1, CCP2, HLA3, LCI1, and LCIA), LCR1, and CAH1 reached maximum levels between 2 and 4 h after dawn, whereas LCIB and LCIC levels were maximal just 1 h into the light period (Fig. 2; Supplemental Table S2). By contrast, CCM induction following transfer from high to low CO2 showed a more coordinated response. CO2-responsive transcripts accumulated rapidly, reaching maximum levels after approximately 2 h and then showing a steady decline over the next 4 h (Fig. 3; Supplemental Table S2).
Additionally, because K0.5 measurements required an initial period of preacclimation in the light, gene expression was also measured in synchronized cells harvested before dawn after a brief period of illumination in the oxygen electrode chamber (Fig. 2, harvested 2 h before dawn with light pretreatment [–2L] and –1L). This light pretreatment resulted in the strong up-regulation of the Ci transporter genes CCP1, CCP2, HLA3, LCI1, and LCIA but did not affect the expression of CAH1 and LCR1. LCIB and LCIC, although having a lower level of induction to begin with, also responded to the predawn light exposure.
RBCS (both RBCS1 and RBCS2) mRNA levels remained largely unchanged throughout the dark/light time course, including the predawn light treatment (Fig. 2). rbcL transcripts appeared to decrease in abundance by up to 80% both in response to the light treatment and from dawn to 6 h into the light; however, overall abundance of both RBCS and rbcL transcripts remained very high (at least one order of magnitude higher than the highly abundant reference gene GBLP; Supplemental Tables S1 and S2). Similarly, only minimal changes were detected in the abundance of genes encoding Rubisco (RBCS and rbcL) throughout the CO2 time course (Fig. 3).
CCM Repression in the Dark Is Independent of Key CCM Protein Abundance
The abundance of several CCM proteins during the dark-to-light transition was measured using immunoblots to determine whether increased mRNA abundance resulted in increased protein levels (Fig. 4). To complement qRT-PCR data, predawn samples (–2, –1) were harvested either directly from the dark or after light pretreatment. Although CO2-responsive transcripts were present only at low levels 2 h before dawn, their corresponding proteins were easily detectable at this time. LCIB and LCIC were present at high levels 2 h before dawn, while CCM activity was still low. These proteins reached maximum levels 2 to 4 h into the light period, several hours after maximum CCM activity occurred. CAH1 was also detectable in the dark and did not show major changes in abundance during the dark-to-light transition. No major change in either RBCS or rbcL abundance was detected during this time course. Predawn exposure to light (samples –2L and –1L) had minimal effect on the abundance of all proteins probed.
Figure 4.

Expression profiles of CCM-related proteins in synchronized cells during the dark-to-light transition. Soluble protein extracts were separated using SDS-PAGE and used for immunoblot analyses with antibodies raised against CAH1, LCIB, LCIC, and Rubisco (rbcL and RBCS). Sample loading was normalized by chlorophyll content. During the dark period (–2 and –1 h), protein was harvested from cells taken either straight from the dark (D) or after a brief illumination in the oxygen electrode chamber (L) to mimic the light pretreatment necessary for K0.5 measurements.
By contrast, for cells adapting to low CO2, immunoblot analyses of LCIB, LCIC, and CAH1 showed coordinated increases in mRNA abundance and protein concentration (Fig. 5; Supplemental Fig. S1). Unlike in dark-harvested (partially CCM-repressed) synchronized cells, LCIB, LCIC, and CAH1 were almost undetectable in high CO2-adapted cells (Fig. 5, 0 h). However, all three proteins rapidly accumulated in response to low CO2, reaching maximum abundance after approximately 3 (LCIB and LCIC) to 5 h (CAH1) and maintaining these high levels for remainder of the time course. No changes in rbcL or RBCS abundance were observed during the acclimation to low CO2.
Figure 5.

Expression profiles of CCM-related proteins in asynchronous cells adapting to low CO2. Soluble protein extracts were separated using SDS-PAGE and used for immunoblot analyses with antibodies raised against CAH1, LCIB, LCIC, and Rubisco (rbcL and RBCS). Sample loading was normalized by chlorophyll content.
Relocalization of Rubisco and CAH3 to the Pyrenoid Coincides with CCM Induction at End of Dark Period
Immunogold labeling was used to probe Rubisco and CAH3 localization, which are both known to be preferentially localized in the pyrenoid in response to low CO2 (Fig. 6). Two hours before dawn (–2D), approximately 75% of Rubisco-labeled particles were present in the pyrenoid while, 1 h later, almost 90% of labeled Rubisco was found in the pyrenoid (–1D), and this high count was maintained 2 h into the light period (2 h; Fig. 6A). This change in Rubisco localization coincided with the measured change in K0.5 but was independent of the dark-period light pretreatment (–2L and –1L).
Figure 6.
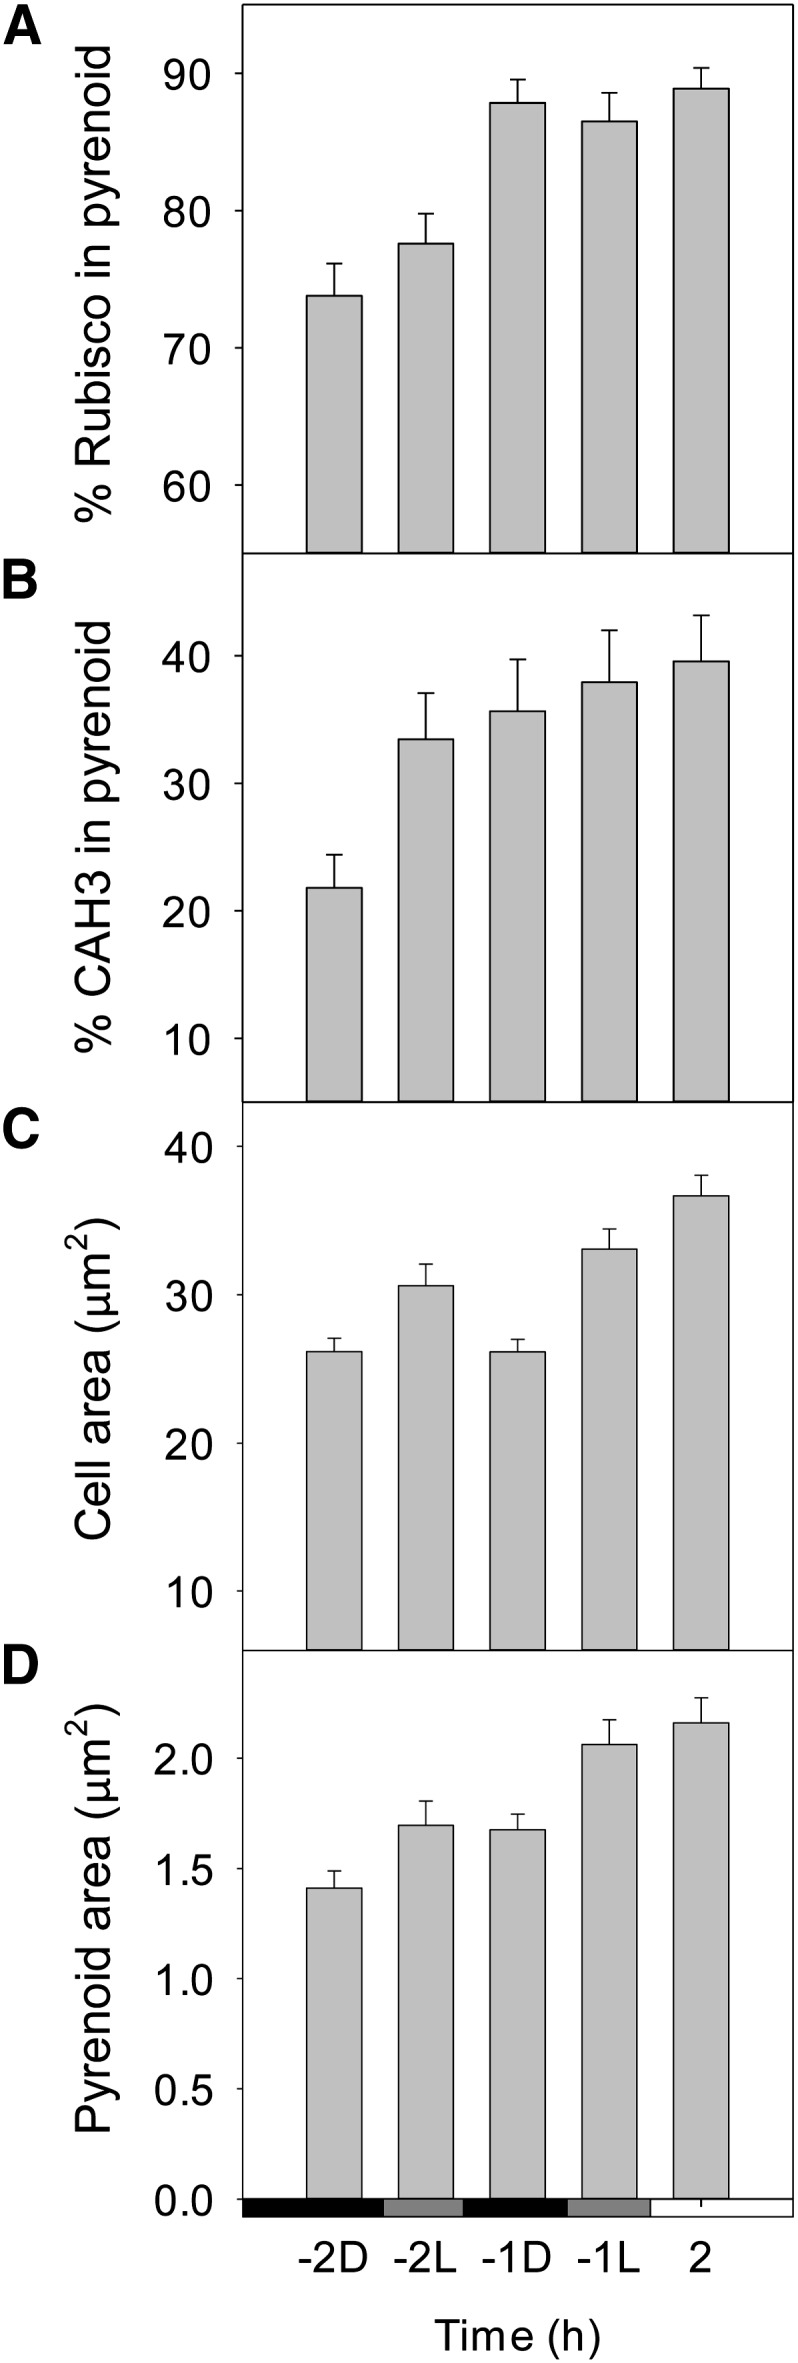
Localization of mobile CCM components in synchronized cells during the dark-to-light transition. Immunogold localization was used to determine the relative abundance in the pyrenoid of primary photosynthetic carboxylase and pyrenoid component Rubisco (A) and thylakoid lumen-localized carbonic anhydrase CAH3 (B; n = 53). Cell area (C) and pyrenoid area (D) were also determined (n = 80). Bars represent mean ± 1 se.
By contrast, relative CAH3 localization changed both before dawn in the dark and in response to predawn light exposure (Fig. 6B). Two hours before dawn, approximately 22% of CAH3 particles were in the pyrenoid (–2D), but this proportion increased to 35% 1 h before dawn (–1D) and reached 40% 2 h into the light period (2 h). The percentage of CAH3 in the pyrenoid also responded directly to the predawn light treatment (increasing to 33% at –2L and 39% at –1L).
In general, mean cell cross-sectional area increased in response to light exposure both before and after dawn (Fig. 6C). Pyrenoid area also increased in line with cell area across the time course (Fig. 6D).
DISCUSSION
Since Marcus et al. (1986) identified oscillations in both CCM activity and photosynthetic characteristics in synchronized cells, the C. reinhardtii CCM has been characterized to a much greater extent in asynchronous cells (for review, see Moroney and Ynalvez, 2007; Wang et al., 2011). The aim of this study was thus to reconcile changes at the molecular level with regulation of overall CCM activity and cellular dynamics of key CCM constituents in a detailed time course during the dark-to-light transition. Several key differences in CCM induction were observed in synchronized, as compared with asynchronous, cultures, as well as the differential expression of known CCM genes in response to light. This study has highlighted the possible importance of additional regulatory mechanisms because the CCM was inducible before dawn, without concomitant increases in mRNA or protein levels of known CCM components.
Comparison of CCM Induction in Response to Light and CO2
This study systematically characterized an 8-h period covering the dark-to-light transition as well as the first 6 h of acclimation to low CO2 for comparison. Coordinated increases in CCM mRNA and protein abundance support the idea that CCM induction in response to low CO2 relies on the de novo synthesis of many components. By contrast, synchronized cells, which divide at the start of the dark period, can induce CCM activity in advance of the light period and prior to increased expression of CCM gene transcripts and proteins. Some CCM gene transcripts, mostly encoding Ci transporters, were also found to respond differentially to predawn light exposure.
The genes analyzed by qRT-PCR in this study (CAH1, CCP1, CCP2, HLA3, LCI1, LCIA, LCIB, LCIC, and LCR1) have all been assigned putative roles in the CCM and identified as transcriptionally up-regulated in response to low CO2, in at least three of four microarray or transcriptomic studies published to date (supplemental data set 1 of Brueggeman et al., 2012). Maximum abundance of these gene transcripts occurred after 2 h at low CO2, and the average fold change from high CO2 levels was generally within 5-fold of the values obtained by Brueggeman et al. (2012; Supplemental Table S4).
In synchronized cells, the level of gene induction (fold increase) during the light period was generally within one order of magnitude of that observed in cells adapting to low CO2 (Supplemental Tables S3 and S4). Perhaps more importantly, the maximum levels of mRNA abundance (relative to GBLP) were also within 4-fold of values obtained for the CO2 time course (Supplemental Table S2). Strong up-regulation of CCM gene transcripts was thus observed in synchronized cells, but, crucially, this occurred only during the light period. Maximum mRNA levels were reached approximately 2 h into the light period, when cells had been expressing maximum CCM activity for the previous 3 h.
Tirumani et al. (2014) also showed that Ci transporter transcripts were up-regulated in the light in synchronized cells of a different wild-type strain (137C/CC-125), which allows greater confidence in the data given that differences between strains and growth conditions are often a major source of variation between experiments (Brueggeman et al., 2012; Fang et al., 2012). Tirumani et al. (2014) also showed that gene expression for carbonic anhydrases (CAH3 and CAH6) and LCIB was higher in the dark, although this induction was suppressed by high CO2. As with the different responses of CCM genes to predawn light treatment (discussed below), this suggests that CCM gene transcription responds to multiple signals, and to light and low CO2 in particular. In this study, expression of LCIB was measured from 2 h before dawn, which may be why this dark induction of key CCM genes was not observed. Expression of CAH3 and CAH6 was not measured in this study because these genes are minimally responsive to CO2. Finally, Tirumani et al. (2014) found that CAH3 protein only accumulates during the light period, but because they did not measure CCM activity or the abundance of CAH6 and LCIB, it is difficult to determine to what extent gene induction in the dark affects CCM expression.
In the CO2 response, de novo CCM protein expression was correlated with a large decrease in K0.5. qRT-PCR and immunoblot analyses for LCIB and LCIC showed maximum protein abundance occurring approximately 1 h after maximum mRNA abundance in both CO2 and dark/light time courses. However, LCIB and LCIC were only slightly induced in the light period compared with the large induction observed in response to low CO2. By contrast, CAH1 levels showed no increase during the light period despite increased transcription, which again distinguishes this response from the large increases in transcription and translation observed in response to low CO2. Overall, during the dark-to-light transition, minimal induction of CAH1, LCIB, and LCIC and the relatively high protein content in the dark were consistent with both the lower K0.5 and the inducibility of the CCM in the dark (Figs. 1A and 4).
Transcriptional Response to Light Pretreatment and Inducibility of the CCM in the Dark
Both the timing and speed of CCM induction in synchronized cells suggest that regulation during the dark-to-light transition may not depend on the de novo synthesis of known CCM proteins, in contrast to the low CO2 response. The differential regulation of mRNA expression and protein levels was further illustrated by the light pretreatment used for comparability with the protocol for K0.5 measurements. Transcripts for Ci transporters (CCP1, CCP2, HLA3, LCI1, and LCIA) all responded strongly to the light pretreatment, generally reaching levels at least as high as those achieved 1 h into the light period of a conventional dark/light cycle. LCIB and LCIC transcripts, although induced to a far lesser extent during the light period, showed a similar level of induction under predawn illumination. The speed and magnitude of this transcriptional response to light may be in part due to the greater light levels in the oxygen electrode chamber (photon flux density, 200–300 µmol photons m–2 s–1) compared with growth conditions in the incubator (50 µmol photons m–2 s–1). For example, mRNA levels of a CO2-responsive mitochondrial carbonic anhydrase (CAH4) increase linearly with increasing light intensity up to 500 µmol photons m–2 s–1 (Eriksson et al., 1998), well above the intensities used in this study.
However, not all CCM-related gene transcripts showed the same pattern of induction in response to predawn light exposure. LCR1, although slightly induced during the light period, did not respond to light before dawn. More notably, CAH1 mRNA levels also did not change in response to predawn light exposure, despite being strongly up-regulated during the following light period. This indicates that LCR1 and CAH1 transcription may be regulated in a different manner to other CO2-responsive genes. Rawat and Moroney (1995) also identified strong oscillations of CAH1 transcripts in synchronized cells, and CAH1 was later shown to be under circadian control (Fujiwara et al., 1996). The higher abundance of CAH1 mRNA in –2D (dark/light) cells compared with 0-h (CO2) cells is consistent with the previous observation of the presence of CAH1 mRNA in cells at the end of the dark period (Supplemental Table S1; Rawat and Moroney, 1995). This also explains the greater induction seen in the CO2 response compared with dark-/light-grown cells, even though the maximum CAH1 mRNA abundance was similar in both time courses (Supplemental Table S2).
The evidence presented thus far suggests that the increased affinity for Ci (K0.5) and inducibility of the CCM in advance of the light period is uncoupled from the transcriptional up-regulation of key CCM elements, which occurred in the light, as distinct from low CO2-induced CCM activity. Secondly, the transcriptional responsiveness of Ci transporter genes to predawn light treatment, relative to other components, shows there to be differentially regulated elements of the CCM. Together with the relatively high concentrations of key CCM proteins in cells growing through dark and into light periods, this leads us to suggest that posttranslational mechanisms might be important for CCM induction in synchronized cells during the dark-to-light transition.
Dynamics of Protein Abundance and Relocalization during CCM Induction across the Dark-to-Light Transition
The relative localization of mobile CCM components in synchronized cells was investigated as a possible means of modulating CCM activity independently of protein abundance. Importantly, Rubisco and CAH3 were found to be differentially localized during the dark-to-light transition, although with certain key differences in this response.
Rubisco accumulated within the pyrenoid during the 2 h before dawn, coinciding with measured changes in K0.5 values and suggesting that the aggregation of Rubisco in the pyrenoid is associated directly with increased CCM activity. Brief exposure to light prior to dawn did not affect Rubisco localization, which suggests that changes in localization during the dark-to-light transition may rely on an endogenous (light-independent) signal. Nevertheless, Rubisco is likely to respond to multiple signals because aggregation is also known to occur in response to low CO2 (Borkhsenious et al., 1998).
CAH3 localization, like Rubisco, may also be controlled by an endogenous signal that coordinates CCM induction. Two hours prior to dawn, 20% of CAH3 was localized to the pyrenoid, but 1 h later, the proportion of CAH3 in the pyrenoid had nearly doubled, and this high proportion was maintained 2 h into the light period. However, in cells harvested 2 h before dawn and exposed briefly to light, the proportion of CAH3 in the pyrenoid was also high. This suggests that CAH3 localization could also be directly regulated by light. This is consistent with qualitative data from immunofluorescence experiments showing that, in synchronized cells, CAH3 is distributed throughout the stromal thylakoids in the middle of the dark period (–6 h) but is pyrenoid localized in the middle of the light period (6 h; Tirumani et al., 2014). However, this quantitative study extends the implications of these findings by showing relocalization of CAH3 just prior to dawn (between –2 and –1 h) in the dark and in response to predawn illumination (at –2 h).
CAH3 relocalization has also been observed in cells acclimating to low CO2, and in this study, CAH3 was present in the pyrenoid at similar relative abundance in dark- versus light-adapted cells, compared with those adapted to high versus low CO2 (19% and 37%, respectively; Blanco-Rivero et al., 2012). In the CO2 response, this shift in localization was linked to the phosphorylation of CAH3 (Blanco-Rivero et al., 2012), but it has not been determined whether a similar mechanism is operating in air-grown synchronized cells. The low CO2-inducible protein LCI5 is also rapidly phosphorylated in response to low CO2, and this has been shown to occur in a redox-dependent manner (Turkina et al., 2006). A similar redox-dependent kinase may be responsible for phosphorylation of CAH3 in response to low CO2 and light; however, this would not explain the shift in CAH3 localization in the dark. Whatever the mechanism, the high relative localization of CAH3 in the pyrenoid after the light pretreatment 2 h before dawn may be partly responsible for the relatively low K0.5 value (incomplete repression of the CCM) at this point.
CONCLUSION
Although there are similarities in the transcriptional response of genes during CCM induction in response to low CO2 and during the dark-to-light transition, this study has identified several key differences that distinguish the response of synchronized cells from that of asynchronous cultures. The inducibility of the CCM before dawn and in advance of mRNA and protein accumulation was directly linked to increased localization of Rubisco and CAH3 to the pyrenoid and highlights the potential importance of posttranslational regulation of the CCM. Further work will be needed to determine the mechanism of relocalization of Rubisco and CAH3 as well as to elucidate the pathways triggered in response to the different signals. In any case, studies focusing on how components are modified, including their subcellular localization and interactions, will be necessary to further our understanding of the CCM. Investigating these changes in synchronized cultures of cells during the dark-to-light transition will provide additional means of probing these important aspects of CCM regulation.
MATERIALS AND METHODS
Algal Strain and Culture Conditions
The Chlamydomonas reinhardtii wild-type strain 2137 mt+ (Spreitzer and Mets, 1981) was maintained in the dark on Tris-acetate medium (Spreitzer and Mets, 1981) agar plates supplemented with Kropat’s trace elements (Kropat et al., 2011). Liquid cultures were grown in an Innova 42 incubator (New Brunswick Scientific) at 25°C with 50 μmol photons m–2 s–1 illumination, aeration, and shaking (125 rpm). Starter cultures were inoculated into Tris-minimal (Tris-acetate without acetate) medium from freshly replated Tris-acetate agar cells and grown to midlog phase (1–2 × 10⁶ cells mL–1). Experimental cultures were inoculated from starter cultures and harvested at midlog phase. High CO2 cultures were bubbled with 5% (v/v) CO2 for 6 d (one starter followed by one experimental culture) before switching to bubbling with air (low CO2; 0.04% [v/v]) for the CO2 response time course. Synchronized cultures were continuously bubbled with air, grown in 12-h/12-h dark/light cycles, and harvested when at midlog phase during the third light period after inoculation. Synchronicity of cell division under these conditions was confirmed by cell counts over a 72-h period from inoculation to midlog phase (harvest).
Oxygen Evolution Measurements
Apparent affinity for Ci was determined using the oxygen evolution method described by Badger et al. (1980). Cells grown in Tris-minimal liquid medium were harvested and resuspended in 25 mm HEPES-KOH (pH 7.3) to a density of 1.5 × 10⁷ cells mL–1. Aliquots of cells (1 mL) were added to a Clark-type oxygen electrode chamber (Rank Brothers) attached to a circulating water bath set to 25°C. The chamber was closed for a light pretreatment (200–300 μmol photons m–2 s–1 illumination for 10–25 min), allowing cells to consume internal Ci stores. When net oxygen evolution ceased, aliquots of NaHCO3 were added to the cells at 30-s intervals, and the rate of oxygen evolution was recorded every second using a PicoLog 1216 data logger (Pico Technologies). Cumulative concentrations of NaHCO3 after each addition were as follows: 2.5, 5, 10, 25, 50, 100, 250, 500, 1,000, and 2,000 µm. Some of the RNA and protein extraction and quantitation methods were conducted after 25-min illumination in the electrode chamber to mimic a standard light pretreatment plus Ci addition protocol.
Chlorophyll Extraction
Chlorophyll was extracted from cells for normalization of oxygen evolution measurements and loading of proteins for SDS-PAGE and immunoblots. Chlorophyll was extracted in 90% (v/v) acetone (10 min at 60°C), and the absorbance of the supernatant was measured at 647 and 664 nm. Chlorophyll concentration was calculated using the equations of Jeffrey and Humphrey (1975).
Analysis of Gene Expression by qRT-PCR
qRT-PCR was used to determine the relative abundance of CCM gene transcripts. Total RNA was extracted from 1 × 10⁷ cells using TRIzol Reagent (Life Technologies). Complementary DNA was synthesized from 500 ng of total RNA using SuperScript II reverse transcriptase (Life Technologies), RNaseOUT (Life Technologies), and oligo(dT)18 primers (Thermo Scientific). Relative gene expression was determined using a Rotor-Gene Q Real-Time PCR Cycler (Qiagen). Reactions (10 µL) used SYBR Green JumpStart Taq ReadyMix (Sigma-Aldrich), and gene expression was calculated relative to the first time point and the reference gene GBLP (Chlamydomonas Beta Subunit-Like Polypeptide/Receptor of Activated Protein Kinase C1; Schloss, 1990) according to the method of Livak and Schmittgen (2001). Primers were designed using the Web-based tools Primer3 (CCP1, CCP2, GBLP, LCIA, LCIB, LCIC, rbcL, and RBCS; Rozen and Skaletsky, 2000) or QuantPrime (CAH1, HLA3, LCI1, and LCR1; Arvidsson et al., 2008). Primer sequences are listed in Supplemental Table S5.
Detection of CCM Proteins Using Immunoblots
Cells (2.5 × 10⁷) were harvested by centrifugation, resuspended in 500 µL of protein extraction buffer (50 mm Bicine, pH 8.0, 10 mm NaHCO3, 10 mm MgCl2, and 1 mm dithiothreitol) and sonicated in 15-mL tubes for 15 min at 4°C on high power using a Diagenode bioruptor. Optimal lysis conditions were previously determined by visually inspecting samples under a light microscope. Unbroken cells were pelleted by centrifugation at 4,400g for 10 min at 4°C, and protein levels in the supernatant (soluble protein fraction) were quantified using Bradford reagent (Sigma-Aldrich). Proteins were separated on a 12% (w/v) polyacrylamide gel using SDS-PAGE. Sample loading was normalized by chlorophyll amount (extraction described above) for both dark/light and CO2 time courses (1.5 µg per lane). Samples were also normalized by protein (5 µg per lane) and probed using all antibodies, which gave similar results to normalization by chlorophyll, as summarized in Supplemental Figure S1.
For immunodetection, proteins were transferred electrophoretically to a polyvinylidene difluoride membrane (Bio-Rad). Membranes were probed with primary antibodies raised against Rubisco (RBCS and rbcL), LCIB, LCIC, or CAH1 and donkey secondary antibodies (enhanced chemiluminescence anti-rabbit IgG, horse radish peroxidase-linked whole antibody; GE Healthcare). Membranes were stripped using Restore Plus Western-Blot Stripping Buffer (Thermo Scientific) and reprobed to allow the detection of multiple proteins on a single membrane.
Transmission Electron Microscopy and Immunogold Localization
Synchronized C. reinhardtii cells were grown to midlog phase in 12-h/12-h dark/light cycles as described above. Prior to dawn, cells were fixed and harvested either in the dark (–2D and –1D) or after a light pretreatment (–2L and –1L) in the oxygen electrode chamber. A final sample was also prepared from cells harvested 2 h into the light period.
For fixation of cells for electron microscopy, glutaraldehyde (electron microscopy grade) was added to a final concentration of 0.5% (v/v) to cultures prior to harvest by centrifugation. Cells were then resuspended in 0.5% (v/v) glutaraldehyde and 1% (v/v) hydrogen peroxide in Tris-minimal medium and fixed for 30 min to 2 h at 4°C. All subsequent steps were carried out at room temperature (approximately 20°C).
Samples were postfixed and osmicated for 1 h in 1% (v/v) OsO4, 1.5% (w/v) K3[Fe(CN)6], and 2 mm CaCl2. After osmication, samples were stained in 2% (w/v) uranyl acetate for 1 h and serially dehydrated for 5 min each in 75% (v/v), 95% (v/v), and 100% ethanol, followed by two incubations in 100% acetonitrile. Samples were embedded in epoxy resin containing 34% (v/v) Quetol 651, 44% (v/v) nonenyl succinic anhydride, 20% (v/v) methyl-5-norbornene-2,3-dicarboxylic anhydride, and 2% (v/v) catalyst dimethyl-benzylamine (Agar Scientific), and the resin was refreshed four times over 2 d. Samples were degassed and cured at 60°C for at least 3 h. Sections (50 nm) were obtained with a Leica Ultracut UCT Ultramicrotome and mounted on bare 300-mesh nickel grids.
For immunogold labeling of Rubisco and CAH3, fixed and embedded samples were treated to remove superficial osmium and unmask epitopes (Skepper, 2000). Grids were incubated face down on droplets of 4% (w/v) metaperiodate for 15 min and then washed with distilled water. Samples were then incubated in 1% (w/v) periodic acid for 5 min and washed in distilled water. Nonspecific binding sites were blocked by incubating grids in Tris-buffered saline with 0.001% (v/v) Triton X-100 and 0.001% (v/v) Tween 20 (TBS-TT) containing 0.1% (w/v) bovine serum albumin (BSA) for 5 min. Primary antibodies were diluted in TBS-TT plus 0.1% (w/v) BSA and incubated in humid chambers for 16 h. Grids were then washed in TBS-TT and distilled water. Grids were incubated for 1 h with secondary antibodies (goat anti-rabbit 15-nm gold conjugates; BBI Solutions) diluted 1:200 in TBS-TT plus 0.1% (w/v) BSA, washed with TBS-TT and distilled water, and dried. The CAH3 antibody was from Agrisera AB.
Samples were examined with a Technai G2 transmission electron microscope at 120 kV (FEI Company) and imaged with Advanced Microscopy Techniques Image Capture Engine software. Image analysis (area measurements and particle counts) was performed using ImageJ (Abramoff et al., 2004). The fraction of gold particles in the pyrenoid was calculated for cells in which the pyrenoid and much of the chloroplast was visible. For each cell, the number of gold particles in the pyrenoid (density multiplied by area) was expressed as a percentage of the total number of particles in the chloroplast (stroma plus pyrenoid). Nonspecific labeling was determined by calculating the density of labeling in the cytosol, and this value was deducted from both the pyrenoidal and stromal densities.
Supplemental Data
The following materials are available in the online version of this article.
Supplemental Figure S1. Summary of relative changes in mRNA and protein abundance during CCM induction in synchronous and asynchronous cultures.
Supplemental Table S1. Relative mRNA levels of CCM genes at the first time point of dark/light and CO2 response time course experiments.
Supplemental Table S2. Relative mRNA levels of CCM genes at maximum expression during dark/light and CO2 response time course experiments.
Supplemental Table S3. Relative expression of CCM genes in synchronised cells during the dark to light transition.
Supplemental Table S4. Relative expression of CCM genes in asynchronous cells adapting to low CO2.
Supplemental Table S5. List of primers used in this study.
Supplementary Material
Acknowledgments
We thank Takashi Yamano (University of Kyoto) and Martin Spalding (Iowa State University) for the gift of antibodies (LCIB/LCIC and CAH1, respectively), Jeremy Skepper (Cambridge Advanced Imaging Centre) for help with electron microscopy and immunogold labeling, Robert Spreitzer (University of Nebraska, Lincoln) for the gift of wild-type C. reinhardtii strain 2137 mt+, and John Gray (University of Cambridge) for the gift of the Rubisco antibodies as well as financial support.
Glossary
- CCM
carbon-concentrating mechanism
- Ci
inorganic carbon
- qRT
quantitative reverse transcriptase
- TBS-TT
Tris-buffered saline with 0.001% Triton X-100 and 0.001% Tween 20
- BSA
bovine serum albumin
Footnotes
This work was supported by Biotechnology and Biological Sciences Research Council (grant no. BB/I024518/1).
The online version of this article contains Web-only data.
Articles can be viewed online without a subscription.
References
- Abramoff MD, Magalhaes PJ, Ram SJ. (2004) Image processing with ImageJ. Biophot Int 11: 36–42 [Google Scholar]
- Arvidsson S, Kwasniewski M, Riaño-Pachón DM, Mueller-Roeber B. (2008) QuantPrime: a flexible tool for reliable high-throughput primer design for quantitative PCR. BMC Bioinformatics 9: 465. [DOI] [PMC free article] [PubMed] [Google Scholar]
- Badger MR, Kaplan A, Berry JA. (1980) Internal inorganic carbon pool of Chlamydomonas reinhardtii: evidence for a carbon dioxide-concentrating mechanism. Plant Physiol 66: 407–413 [DOI] [PMC free article] [PubMed] [Google Scholar]
- Blanco-Rivero A, Shutova T, Román MJ, Villarejo A, Martinez F. (2012) Phosphorylation controls the localization and activation of the lumenal carbonic anhydrase in Chlamydomonas reinhardtii. PLoS ONE 7: e49063. [DOI] [PMC free article] [PubMed] [Google Scholar]
- Borkhsenious ON, Mason CB, Moroney JV. (1998) The intracellular localization of ribulose-1,5-bisphosphate carboxylase/oxygenase in Chlamydomonas reinhardtii. Plant Physiol 116: 1585–1591 [DOI] [PMC free article] [PubMed] [Google Scholar]
- Bozzo GG, Colman B. (2000) The induction of inorganic carbon transport and external carbonic anhydrase in Chlamydomonas reinhardtii is regulated by external CO2 concentration. Plant Cell Environ 23: 1137–1144 [Google Scholar]
- Brueggeman AJ, Gangadharaiah DS, Cserhati MF, Casero D, Weeks DP, Ladunga I. (2012) Activation of the carbon concentrating mechanism by CO2 deprivation coincides with massive transcriptional restructuring in Chlamydomonas reinhardtii. Plant Cell 24: 1860–1875 [DOI] [PMC free article] [PubMed] [Google Scholar]
- Colombo SL, Pollock SV, Eger KA, Godfrey AC, Adams JE, Mason CB, Moroney JV. (2002) Use of the bleomycin resistance gene to generate tagged insertional mutants of Chlamydomonas reinhardtii that require elevated CO2 for optimal growth. Funct Plant Biol 29: 231–241 [DOI] [PubMed] [Google Scholar]
- Dionisio-Sese ML, Fukuzawa H, Miyachi S. (1990) Light-induced carbonic anhydrase expression in Chlamydomonas reinhardtii. Plant Physiol 94: 1103–1110 [DOI] [PMC free article] [PubMed] [Google Scholar]
- Duanmu D, Miller AR, Horken KM, Weeks DP, Spalding MH. (2009) Knockdown of limiting-CO2-induced gene HLA3 decreases HCO3– transport and photosynthetic Ci affinity in Chlamydomonas reinhardtii. Proc Natl Acad Sci USA 106: 5990–5995 [DOI] [PMC free article] [PubMed] [Google Scholar]
- Eriksson M, Villand P, Gardeström P, Samuelsson G. (1998) Induction and regulation of expression of a low-CO2-induced mitochondrial carbonic anhydrase in Chlamydomonas reinhardtii. Plant Physiol 116: 637–641 [DOI] [PMC free article] [PubMed] [Google Scholar]
- Fang W, Si Y, Douglass S, Casero D, Merchant SS, Pellegrini M, Ladunga I, Liu P, Spalding MH. (2012) Transcriptome-wide changes in Chlamydomonas reinhardtii gene expression regulated by carbon dioxide and the CO2-concentrating mechanism regulator CIA5/CCM1. Plant Cell 24: 1876–1893 [DOI] [PMC free article] [PubMed] [Google Scholar]
- Fujiwara S, Ishida N, Tsuzuki M. (1996) Circadian expression of the carbonic anhydrase gene, Cah1, in Chlamydomonas reinhardtii. Plant Mol Biol 32: 745–749 [DOI] [PubMed] [Google Scholar]
- Giordano M, Beardall J, Raven JA. (2005) CO2 concentrating mechanisms in algae: mechanisms, environmental modulation, and evolution. Annu Rev Plant Biol 56: 99–131 [DOI] [PubMed] [Google Scholar]
- Im CS, Grossman AR. (2002) Identification and regulation of high light-induced genes in Chlamydomonas reinhardtii. Plant J 30: 301–313 [DOI] [PubMed] [Google Scholar]
- Jeffrey SW, Humphrey GF. (1975) New spectrophotometric equations for determining chlorophylls a, b, c1, and c2 in higher plants, algae and natural phytoplankton. Biochem Physiol Pflanz 165: 191–194 [Google Scholar]
- Karlsson J, Clarke AK, Chen ZY, Hugghins SY, Park YI, Husic HD, Moroney JV, Samuelsson G. (1998) A novel α-type carbonic anhydrase associated with the thylakoid membrane in Chlamydomonas reinhardtii is required for growth at ambient CO2. EMBO J 17: 1208–1216 [DOI] [PMC free article] [PubMed] [Google Scholar]
- Kropat J, Hong-Hermesdorf A, Casero D, Ent P, Castruita M, Pellegrini M, Merchant SS, Malasarn D. (2011) A revised mineral nutrient supplement increases biomass and growth rate in Chlamydomonas reinhardtii. Plant J 66: 770–780 [DOI] [PMC free article] [PubMed] [Google Scholar]
- Livak KJ, Schmittgen TD. (2001) Analysis of relative gene expression data using real-time quantitative PCR and the 2–ΔΔCT method. Methods 25: 402–408 [DOI] [PubMed] [Google Scholar]
- Ma Y, Pollock SV, Xiao Y, Cunnusamy K, Moroney JV. (2011) Identification of a novel gene, CIA6, required for normal pyrenoid formation in Chlamydomonas reinhardtii. Plant Physiol 156: 884–896 [DOI] [PMC free article] [PubMed] [Google Scholar]
- Manuel LJ, Moroney JV. (1988) Inorganic carbon accumulation by Chlamydomonas reinhardtii: new proteins are made during adaptation to low CO2. Plant Physiol 88: 491–496 [DOI] [PMC free article] [PubMed] [Google Scholar]
- Marcus Y, Schuster G, Michaels A, Kaplan A. (1986) Adaptation to CO2 levels and changes in the phosphorylation of thylakoid proteins during the cell cycle of Chlamydomonas reinhardtii. Plant Physiol 80: 604–607 [DOI] [PMC free article] [PubMed] [Google Scholar]
- Meyer MT, Genkov T, Skepper JN, Jouhet J, Mitchell MC, Spreitzer RJ, Griffiths H. (2012) Rubisco small-subunit α-helices control pyrenoid formation in Chlamydomonas. Proc Natl Acad Sci USA 109: 19474–19479 [DOI] [PMC free article] [PubMed] [Google Scholar]
- Miura K, Yamano T, Yoshioka S, Kohinata T, Inoue Y, Taniguchi F, Asamizu E, Nakamura Y, Tabata S, Yamato KT, et al. (2004) Expression profiling-based identification of CO2-responsive genes regulated by CCM1 controlling a carbon-concentrating mechanism in Chlamydomonas reinhardtii. Plant Physiol 135: 1595–1607 [DOI] [PMC free article] [PubMed] [Google Scholar]
- Moroney JV, Ma Y, Frey WD, Fusilier KA, Pham TT, Simms TA, DiMario RJ, Yang J, Mukherjee B. (2011) The carbonic anhydrase isoforms of Chlamydomonas reinhardtii: intracellular location, expression, and physiological roles. Photosynth Res 109: 133–149 [DOI] [PubMed] [Google Scholar]
- Moroney JV, Ynalvez RA. (2007) Proposed carbon dioxide concentrating mechanism in Chlamydomonas reinhardtii. Eukaryot Cell 6: 1251–1259 [DOI] [PMC free article] [PubMed] [Google Scholar]
- Ohnishi N, Mukherjee B, Tsujikawa T, Yanase M, Nakano H, Moroney JV, Fukuzawa H. (2010) Expression of a low CO2-inducible protein, LCI1, increases inorganic carbon uptake in the green alga Chlamydomonas reinhardtii. Plant Cell 22: 3105–3117 [DOI] [PMC free article] [PubMed] [Google Scholar]
- Price GD, Badger MR, Woodger FJ, Long BM. (2008) Advances in understanding the cyanobacterial CO2-concentrating-mechanism (CCM): functional components, Ci transporters, diversity, genetic regulation and prospects for engineering into plants. J Exp Bot 59: 1441–1461 [DOI] [PubMed] [Google Scholar]
- Rawat M, Moroney JV. (1995) The regulation of carbonic anhydrase and ribulose-1,5-bisphosphate carboxylase oxygenase activase by light and CO2 in Chlamydomonas reinhardtii. Plant Physiol 109: 937–944 [DOI] [PMC free article] [PubMed] [Google Scholar]
- Rozen S, Skaletsky H. (2000) Primer3 on the WWW for general users and for biologist programmers. Methods Mol Biol 132: 365–386 [DOI] [PubMed] [Google Scholar]
- Schloss JA. (1990) A Chlamydomonas gene encodes a G protein β subunit-like polypeptide. Mol Gen Genet 221: 443–452 [DOI] [PubMed] [Google Scholar]
- Skepper JN. (2000) Immunocytochemical strategies for electron microscopy: choice or compromise. J Microsc 199: 1–36 [DOI] [PubMed] [Google Scholar]
- Spalding MH. (2008) Microalgal carbon dioxide-concentrating mechanisms: Chlamydomonas inorganic carbon transporters. J Exp Bot 59: 1463–1473 [DOI] [PubMed] [Google Scholar]
- Spalding MH, Critchley C, Govindjee, Orgren WL. (1984) Influence of carbon dioxide concentration during growth on fluorescence induction characteristics of the green alga Chlamydomonas reinhardii. Photosynth Res 5: 169–176 [DOI] [PubMed] [Google Scholar]
- Spalding MH, Ogren WL. (1982) Photosynthesis is required for induction of the CO2-concentrating system in Chlamydomonas reinhardii. FEBS Lett 145: 41–44 [Google Scholar]
- Spalding MH, Spreitzer RJ, Ogren WL. (1983) Reduced inorganic carbon transport in a CO2-requiring mutant of Chlamydomonas reinhardii. Plant Physiol 73: 273–276 [DOI] [PMC free article] [PubMed] [Google Scholar]
- Spreitzer RJ, Mets L. (1981) Photosynthesis-deficient mutants of Chlamydomonas reinhardii with associated light-sensitive phenotypes. Plant Physiol 67: 565–569 [DOI] [PMC free article] [PubMed] [Google Scholar]
- Spreitzer RJ, Salvucci ME. (2002) Rubisco: structure, regulatory interactions, and possibilities for a better enzyme. Annu Rev Plant Biol 53: 449–475 [DOI] [PubMed] [Google Scholar]
- Thyssen C, Hermes M, Sültemeyer D. (2003) Isolation and characterisation of Chlamydomonas reinhardtii mutants with an impaired CO2-concentrating mechanism. Planta 217: 102–112 [DOI] [PubMed] [Google Scholar]
- Tirumani S, Kokkanti M, Chaudhari V, Shukla M, Rao BJ. (2014) Regulation of CCM genes in Chlamydomonas reinhardtii during conditions of light-dark cycles in synchronous cultures. Plant Mol Biol 85: 277–286 [DOI] [PubMed] [Google Scholar]
- Turkina MV, Blanco-Rivero A, Vainonen JP, Vener AV, Villarejo A. (2006) CO2 limitation induces specific redox-dependent protein phosphorylation in Chlamydomonas reinhardtii. Proteomics 6: 2693–2704 [DOI] [PubMed] [Google Scholar]
- Van K, Spalding MH. (1999) Periplasmic carbonic anhydrase structural gene (Cah1) mutant in Chlamydomonas reinhardtii. Plant Physiol 120: 757–764 [DOI] [PMC free article] [PubMed] [Google Scholar]
- Wang Y, Duanmu D, Spalding MH. (2011) Carbon dioxide concentrating mechanism in Chlamydomonas reinhardtii: inorganic carbon transport and CO2 recapture. Photosynth Res 109: 115–122 [DOI] [PubMed] [Google Scholar]
- Wang Y, Spalding MH. (2014) LCIB in the Chlamydomonas CO2-concentrating mechanism. Photosynth Res 121: 185–192 [DOI] [PubMed] [Google Scholar]
- Yamano T, Miura K, Fukuzawa H. (2008) Expression analysis of genes associated with the induction of the carbon-concentrating mechanism in Chlamydomonas reinhardtii. Plant Physiol 147: 340–354 [DOI] [PMC free article] [PubMed] [Google Scholar]
- Yamano T, Tsujikawa T, Hatano K, Ozawa S, Takahashi Y, Fukuzawa H. (2010) Light and low-CO2-dependent LCIB-LCIC complex localization in the chloroplast supports the carbon-concentrating mechanism in Chlamydomonas reinhardtii. Plant Cell Physiol 51: 1453–1468 [DOI] [PubMed] [Google Scholar]
- Yoshioka S, Taniguchi F, Miura K, Inoue T, Yamano T, Fukuzawa H. (2004) The novel Myb transcription factor LCR1 regulates the CO2-responsive gene Cah1, encoding a periplasmic carbonic anhydrase in Chlamydomonas reinhardtii. Plant Cell 16: 1466–1477 [DOI] [PMC free article] [PubMed] [Google Scholar]
Associated Data
This section collects any data citations, data availability statements, or supplementary materials included in this article.