Neutron radiography traces the transport of deuterated water in soil and roots to reconstruct the water flow across the root tissue and along the xylem.
Abstract
Our understanding of soil and plant water relations is limited by the lack of experimental methods to measure water fluxes in soil and plants. Here, we describe a new method to noninvasively quantify water fluxes in roots. To this end, neutron radiography was used to trace the transport of deuterated water (D2O) into roots. The results showed that (1) the radial transport of D2O from soil to the roots depended similarly on diffusive and convective transport and (2) the axial transport of D2O along the root xylem was largely dominated by convection. To quantify the convective fluxes from the radiographs, we introduced a convection-diffusion model to simulate the D2O transport in roots. The model takes into account different pathways of water across the root tissue, the endodermis as a layer with distinct transport properties, and the axial transport of D2O in the xylem. The diffusion coefficients of the root tissues were inversely estimated by simulating the experiments at night under the assumption that the convective fluxes were negligible. Inverse modeling of the experiment at day gave the profile of water fluxes into the roots. For a 24-d-old lupine (Lupinus albus) grown in a soil with uniform water content, root water uptake was higher in the proximal parts of lateral roots and decreased toward the distal parts. The method allows the quantification of the root properties and the regions of root water uptake along the root systems.
Understanding how and where plant roots extract water from soil remains an open question for both plant and soil scientists. One of the open questions concerns the locations of water uptake along the root system (Frensch and Steudle, 1989; Doussan et al., 1998; Steudle, 2000; Zwieniecki et al., 2003; Javaux et al., 2008). A motivation of these studies is that a better prediction of root water uptake may help to optimize irrigation and identify optimal traits to capture water. Despite its importance, there is little experimental information on the spatiotemporal distribution of the uptake zone along roots growing in soil. The lack of experimental data is largely due to the technical difficulties in measuring water fluxes in soils and roots.
Quantitative information on the rate and location of root water uptake along roots growing in soil is needed to better understand the function of roots in extracting water from the soil and tolerating drought events. Such information may show which parts of roots are more involved in water extraction and how root hydraulic properties change during root growth and exposure to water-limiting conditions. For instance, it is not clear how root anatomy and the hydraulic conductivity of roots change as the soil becomes dry or the transpiration demand increases. Quantitative information of the location of root water uptake can be used to estimate the spatial distribution of hydraulic conductivities along roots. This information is needed to parameterize the most recent and advanced models of root water uptake, such as those of Doussan et al. (1998) and Javaux et al. (2008).
Most of the experimental information on the spatial distribution of water uptake is limited to roots grown in hydroponic and aeroponic cultures (Frensch and Steudle, 1989; Varney and Canny, 1993; Zwieniecki et al., 2003; Knipfer and Fricke, 2010a). These investigations substantially improved our knowledge of the mechanism of water transport in roots. However, roots grown in hydroponic and aeroponic cultures may have different properties than those of roots grown in soils. As the soil dries, the hydraulic conductivity of roots and of the root-soil interface changes and likely affects the profile of root water uptake (Blizzard and Boyer, 1980; Nobel and Cui, 1992; Huang and Nobel, 1993; McCully, 1995; North and Nobel, 1997; Carminati et al., 2011; Knipfer et al., 2011; McLean et al., 2011; Carminati, 2012).
New advances in imaging techniques are opening new avenues for noninvasively studying water uptake by roots in soils (Doussan et al., 1998; Garrigues et al., 2006; Javaux et al., 2008; Pohlmeier et al., 2008; Moradi et al., 2011). Imaging methods such as x-ray computed tomography, light transmission imaging, NMR, and computed neutron radiography allow quantifying the changes of water content in the root zone with different accuracy and spatial resolution. However, due to the concomitant soil water redistribution, the local changes in soil water content are not trivially related to root uptake. Consequently, the estimation of root water uptake requires coupling the imaging methods with the modeling of water flow in the soil, which, in turn, requires accurate information on the hydraulic properties of soil and roots. An additional complexity is represented by the peculiar and only partly understood hydraulic properties of the soil in the vicinity of the roots, the so-called rhizosphere.
The hydraulic properties of the rhizosphere are influenced by root and microorganism activity, soil compaction due to root growth, and the formation of air-filled gaps between soil and roots when roots shrink (Nye, 1994; North and Nobel, 1997; Carminati et al., 2010; Aravena et al., 2011; Moradi et al., 2011; Carminati, 2013; Zarebanadkouki and Carminati, 2014). To date, it has been technically difficult to quantify the hydraulic properties of the rhizosphere. Carminati et al. (2011) showed that the hydraulic properties of the first 1 to 2 mm near the root affect the profile of water content and water potential toward the root.
Recently, we introduced a novel method to noninvasively trace the flow of water in soil and roots (Zarebanadkouki et al., 2012, 2013). The method combines neutron radiography and the injection of deuterated water (D2O). Neutron radiography is an imaging technique that allows one to quantify the water distribution in thin soil samples with high accuracy and spatial resolution (Moradi et al., 2008). D2O is an isotope of normal water. Its chemical and physical properties are similar to those of water, but in contrast to water, it is almost transparent in neutron transmission imaging (Matsushima et al., 2012). This property makes D2O an excellent tracer for neutron imaging of water flow.
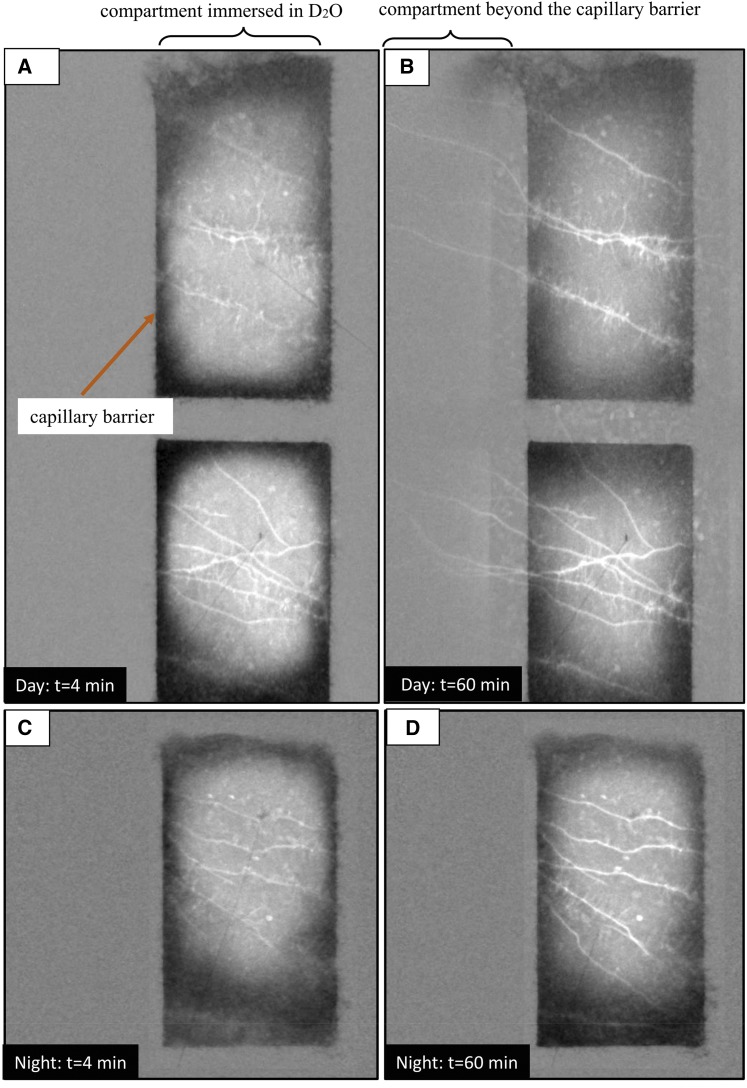
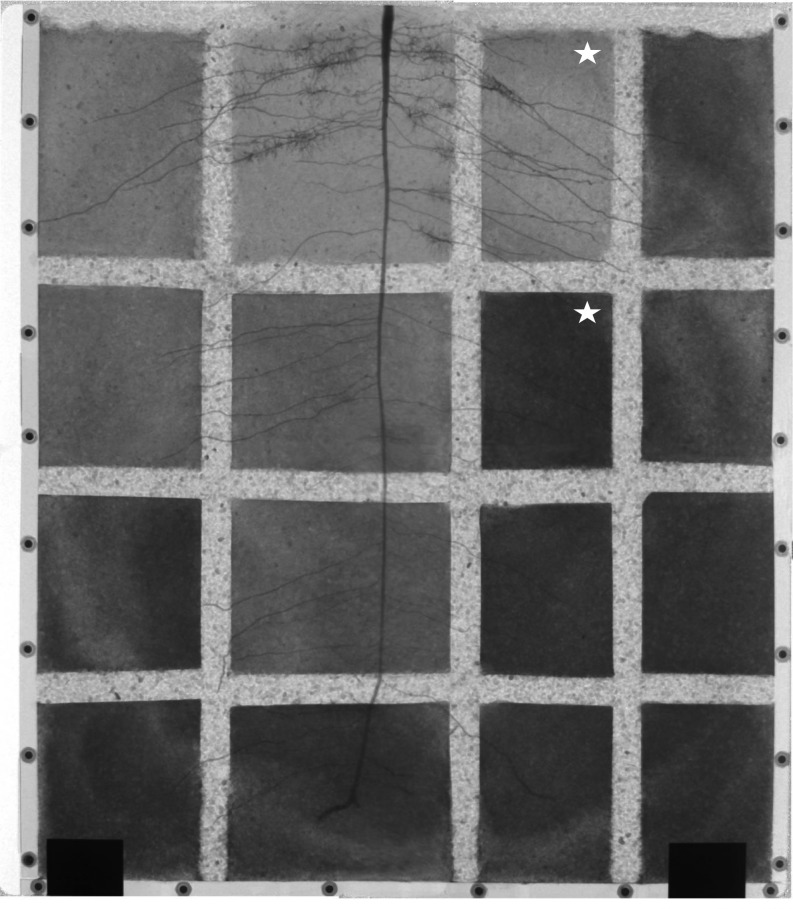
In our previous experiments (Zarebanadkouki et al., 2012, 2013), D2O was injected next to selected roots and its transport was monitored using time-series neutron radiography with a spatial resolution of 150 μm and a temporal resolution of 10 s for a duration of 2 h. We grew lupine (Lupinus albus) in aluminum containers (width of 25 cm, height of 30 cm, and thickness of 1 cm) filled with a sandy soil. The soil was partitioned into different compartments with a 1-cm layer of coarse sand acting as a capillary barrier (three vertical and four horizontal layers placed at regular intervals). The capillary barriers limited the transport of D2O into a given region of soil and facilitated the quantification of D2O transport into the roots. Figure 1 shows selected neutron radiographs of D2O injection during the day and night. This figure is modified from Zarebanadkouki et al. (2013). The radiographs show that (1) the radial transport of D2O into the roots was faster during the day than during the night and (2) the axial transport of D2O along the roots was visible only during the day, while it was negligible at night. The differences between nighttime and daytime measurements were caused by the net flow of water induced by transpiration.
Figure 1.
Neutron radiographs of two samples after injection of 4 mL of D2O during the day (A and B) and during the night (C and D). D2O was injected in one compartment during the nighttime and in two compartments during the daytime. The images show the differences between the actual radiographs at time t and the radiograph before injection (t = 0). Brighter colors indicate lower neutron attenuation and higher D2O-water ratio. The images show that (1) the transport of D2O was faster during the day than during the night and (2) D2O moved axially beyond the capillary barrier toward the shoot only during the day. Images are closeups of the original field of view of 15.75 × 15.75 cm showing the distribution of D2O in the soil and root after D2O injection. Figures are extracted from Zarebanadkouki et al. (2013). (A neutron radiograph of the whole sample used for daytime measurement is given in Figure 9.) [See online article for color version of this figure.]
The interpretation of tracing experiments with D2O in which water and D2O are mixed is not straightforward (Carminati and Zarebanadkouki, 2013; Warren et al., 2013a, 2013b). To determine the convective fluxes from the radiographs, Zarebanadkouki et al. (2012, 2013) introduced a diffusion-convection model of D2O transport in roots. The model was solved analytically. The model described the increase of the average D2O concentration in the root with a double-exponential equation, in which the rate constants of the first and second phases were related to the transport of D2O into the cortex and the stele of the roots. Although the model included important details of the root structure, such as different pathways of water across the root tissue, the diffusion of D2O across the root tissue was strongly simplified. In particular, our previous model assumed that as soon as the roots were immersed in D2O, the apoplastic free space of the root cortex was instantaneously saturated with D2O. In other words, we assumed that all cortical cells and the root endodermis were simultaneously immersed in an identical concentration of D2O equal to that of the soil. Additionally, we assumed that D2O concentration inside the cortical cell and the root stele was uniform (well-stirred compartment).
Although the radiographs clearly showed a significant axial transport of D2O beyond the capillary barrier during the daytime (Fig. 1B), the model of Zarebanadkouki et al. (2013) was not capable of simulating it appropriately. Indeed, our previous model could only simulate the changes in D2O concentration in the root segments immersed in D2O. Since the concentration of D2O in the root segment beyond the capillary barrier carries additional information on the axial and radial fluxes along the roots, we decided to modify our model to include such information.
Another approximation of the previous model was the assumption that the radial water flow to the root was uniform along the root segment immersed in D2O. However, Zarebanadkouki et al. (2013) found significant variations in root water uptake along the roots and suggested that root water uptake should be measured with a better spatial resolution.
The objective of this study was to provide an adequate model to interpret tracing experiments with D2O. We developed two different models to describe the transport of D2O into roots. (1) In the first model, we described the transport of D2O into the roots by taking into account the different pathways of water across the root tissue (i.e. the apoplastic and the cell-to-cell pathways). Although this model captures the complexity of the root structure, it requires several parameters, such as the ratio of the water flow in the apoplast over the water flow in the cell-to-cell pathway. We refer to this model as the composite transport model. (2) In the second model, we simplified the root tissue into a homogenous flow domain comprising both pathways. The latter model is a simplification of the complex root anatomy, but it has the advantage of requiring fewer parameters. We refer to this model as the simplified model.
In the next sections, we introduce the two modeling approaches and run a sensitivity analysis to test whether the transport of D2O into roots is sensitive to the parameters of the composite transport model. The question was, do we need the composite transport model to accurately estimate the water flow into the roots based on the experiments with neutron radiography? Or alternatively, can we use the simplified model to estimate the fluxes without the need of introducing several parameters?
Our final goal was to develop a numerical procedure to extract quantitative information on the water fluxes and the root hydraulic properties based on the tracing experiments with neutron radiography. Based on the results of the sensitivity analysis, we chose the simplified model to simulate the experiments. By fitting the observed D2O transport into the roots, we calculated the profiles of water flux across the roots of a 24-d-old lupine as well as the diffusion permeability of its roots.
THEORETICAL BACKGROUND
Model of D2O Transport in Root
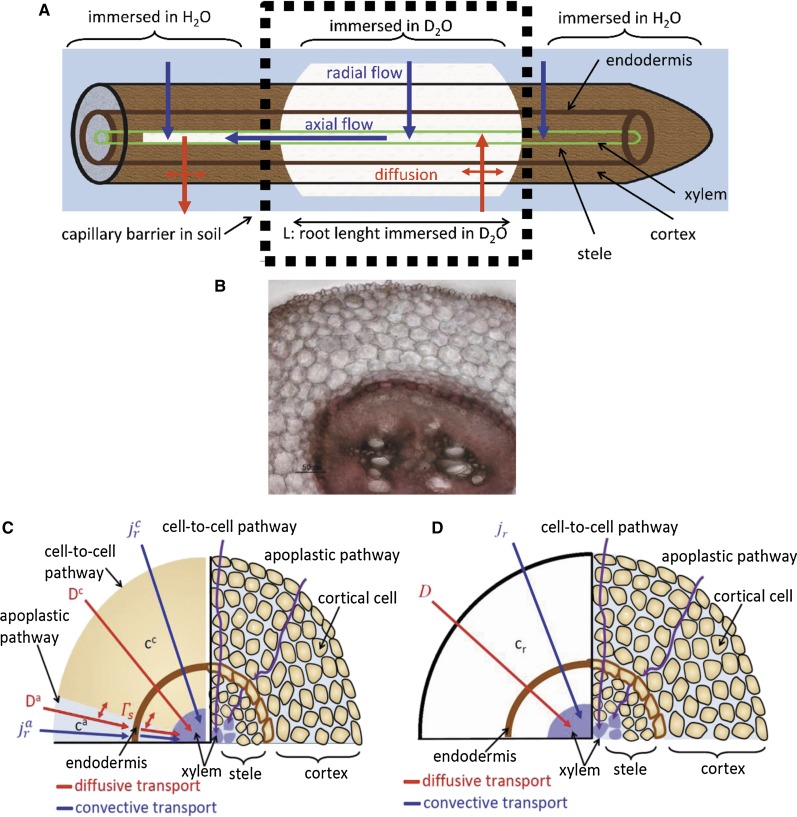
D2O enters the roots by (1) diffusion, which depends on the concentration gradient across the root tissue and the diffusional permeability of the roots, and (2) the convection induced by the transpiration stream. The transport of D2O through the root can then be described by a diffusion-convection model. We assumed that the water flow from the root surface to the xylem surface is radial, while the water flow in the xylem is longitudinal (Fig. 2A). Due to the composite structure of roots, the radial flow of water and the transport of D2O take place along different pathways: the apoplastic pathway and the cell-to-cell pathway (Fig. 2C). The apoplastic pathway occurs along the cell walls and the extracellular space. The cross-sectional area of the apoplastic pathway is only a few percent of the total cross-sectional area (Fritz and Ehwald [2011] reported a value of 3% in maize [Zea mays]). Although its cross section is small, the apoplastic pathway does not involve the crossing of cell membranes and is expected to be less resistant to water flow. However, the relative importance of the apoplastic and cell-to-cell pathways is still a matter of debate (Steudle, 2000; Knipfer and Fricke, 2010b).
Figure 2.
Illustration of D2O transport into a root partially immersed in D2O. A, Diffusion and convection along a root. Water flows radially to the xylem radius. In the xylem, water flows longitudinally. B, Cross section of a lupine root at a distance of 12 cm from the root tip. C, Representation of the root tissue and its effect on D2O transport in the composite transport model. D, Simplified model in which the different pathways are lumped together in a single averaged pathway across the root tissue. Here, ca and cc are the concentrations of D2O in the apoplastic and symplastic pathways, respectively; cr is the concentration of D2O in the root; Da and Dc are the diffusion coefficients of D2O in the apoplastic and symplastic pathways, respectively; D is the diffusion coefficient of D2O in the root assuming the root as a uniform tissue;  and
and  are radial fluxes of water in the apoplastic and symplastic pathways, respectively; jr is the radial flux of water into the root; and Γs is the exchange term of D2O between the apoplastic and cell-to-cell pathways.
We chose two scenarios to describe the D2O transport in the root. In the first scenario, we explicitly described the transport of D2O through the two different pathways and assumed that in the endodermis the apoplast is blocked. This assumption will not be valid for the root tip in which the endodermis has not yet developed. We refer to this model as the composite transport model. In the second scenario, we considered only a single pathway, which can be seen as the average of the two pathways, and described the endodermis as a layer with lower diffusional permeability. We refer to this model as the simplified model.
First Scenario: Composite Transport Model
We divided the flow domain into an apoplastic pathway and a cell-to-cell pathway. A schematic representation of the flow domain is shown in Figure 2C. The pathways are in parallel and exchange D2O with each other. We assumed a continuous apoplastic pathway across the root tissue with an interruption at the endodermis, where the transport of D2O is only via the cell-to-cell pathway. The transport of D2O in the apoplastic pathway is described by:
 |
and the transport of D2O in the cell to cell pathway is described by:
 |
where the superscripts a and c refer to the apoplastic and cell-to-cell pathways, respectively, θ is the water content (cm3 cm−3), r is the radial coordinate (cm), x is the longitudinal coordinate (cm), t is the time (s), ca and cc are the concentrations of D2O in the apoplastic and symplastic pathways, respectively (cm3 cm−3), Da and Dc are the diffusion coefficients of D2O in the apoplastic and symplastic pathways, respectively (cm2 s−1), jx is axial flux of water (cm s−1),  and
and  are the radial flux of water in the apoplastic and symplastic pathways, respectively (cm s−1), ωa is the volumetric fraction of the apoplast (cm3 cm−3), and Γs describes the exchange of D2O between the apoplastic and cell-to-cell pathways (s−1). The volumetric fraction of the apoplast, ωa, is assumed to be 3% (Richter and Ehwald, 1983; Fritz and Ehwald, 2011). Note that we assumed a similar diffusion coefficient in the radial and axial directions.
To quantify the exchange term, we followed the approach of Gerke and van Genuchten (1996), who modeled water flow and solute transport in dual-permeability soils. Although their approach was developed for structured soils, the mathematical treatment can be easily adapted to the root tissue. In fact, there is a strong analogy between the dualism between the macrospore and the soil matrix in structured soils and that of the apoplastic and cell-to-cell pathways in the root tissue. Using the approach of Gerke and van Genuchten (1996) and assuming that root cells are cylinders with radius rc (cm), the exchange term between the apoplastic and cell-to-cell pathways is given by:
 |
where β is a dimensionless geometry coefficient that was equal to 3 and 8 for a hollow and a solid cylinder, respectively (van Genuchten, 1985; Gerke and van Genuchten, 1996). β is a parameter that depends on the ratio between the surface and volume of the root cells. The larger is the surface-to-volume ratio, the faster is the D2O exchange between the apoplastic and cell-to-cell pathways. We assumed that the cells have a cylindrical shape (i.e. their radius is much smaller than their longitudinal length). We further assumed that the major resistance to the transport of D2O occurs at the cell membrane, while the inner cell volume has a uniform concentration of D2O. These approximations result in the representation of the root cells as hollow cylinders. The term “hollow” here refers to the fact the main resistance to D2O transfer acts at the cell wall.
We further assumed that the cell-to-cell pathway is in local hydraulic equilibrium with the apoplast and that, consequently, D2O moves between the two pathways only by diffusion.
The radial fluxes of water through the apoplastic and cell-to-cell pathways are expressed as:
 |
and
 |
where jr is the average radial flux of water (cm s−1), λ is the relative importance of the apoplastic transport (−), and ωc is the volumetric fraction of the cell-to-cell pathway (1 − ωa). The value of λ varies from 0 for purely apoplastic transport to 1 for purely cell-to-cell transport. Note that the radial and axial fluxes vary as a function of distance from the root center (radial direction r) and from the root tip (axial direction x). The fluxes are assumed to be constant over time during the measurements. We define jR(x) as the radial flux at the root surface (cm s−1).
The change in concentration of D2O in the root can be calculated from the weighted-average concentrations of D2O in the apoplastic and cell-to-cell pathways according to:
 |
where cr is the D2O concentration in the root (cm3 cm−3).
Mass conservation imposes that the radial and axial fluxes satisfy the following equation:
 |
where rx is the xylem radius (cm). From the root surface to the root xylem, we assumed only radial flow. In another words, we assumed that the axial transport of water occurs only in the xylem. In this case, mass conservation imposes that jr × r is constant between the root surface and the xylem radius.
Second Scenario: Simplified Model
A simplified approach consists of treating the root tissue as a single pathway whose diffusion D is an average of the diffusion through the apoplastic and cell-to-cell pathways (cm2 s−1). A schematic representation of the model is presented in Figure 2D. In this case, the transport of D2O in root can be described by:
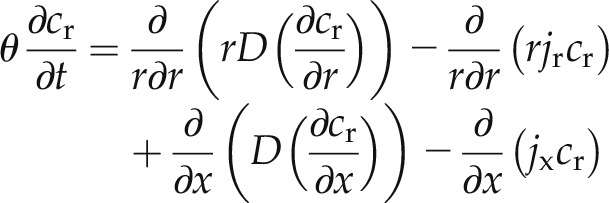 |
where cr is the average concentration of D2O in root.
Model Parameterization
All the variables in Equations 1, 2, and 8 are functions of the radial and longitudinal coordinates (r and x). For the diffusion coefficients, we assumed that the cortical cells in the cortex and the root stele had constant radii and diffusion coefficients along r and x. We further assumed that the endodermis was not yet developed in the first 1.5 cm from the root tip. Thus, we used the diffusion coefficient in the root tip as a representative of the diffusion coefficient of the cortical cells in the root tissue. We let the diffusion coefficient of the endodermis (De) and the radial flux of water into the roots (jr) vary with x [i.e. De = De(x) and jR = jR(x)].
For the composite transport model, we assumed that the volume fractions of the apoplastic and cell-to-cell pathways are ωa and (1 − ωa), respectively. Similarly, the fractions of water flow through the apoplastic and cell-to-cell pathways are (1 − λ) and λ, respectively. As a first approximation, we assumed that ωa and λ are constant in the axial direction. The apoplastic pathway is assumed to be interrupted at the endodermis (i.e. between and
and  ), with rc being the cell radius and re the endodermis radius. We also included the fact the diffusion in the endodermis is smaller than in the cortex. These assumptions are summarized as:
 |
Note that when ωa(r, x) = 0, Equation 1 cannot be solved. Indeed, in the endodermis, we solved only Equation 2. To solve the numerical problem, we imposed Ca = Cc in the endodermis.
For simplicity, we did not simulate the water movement in soil during D2O injection. The radiographs showed a quick water redistribution in the soil after D2O injection, and we assumed that afterward the water flow in soil was constant over time. During D2O injection, we imposed the measured concentration of D2O as the boundary condition at the root surface in soil. When the soil water content reached equilibrium, we shifted the boundary condition to the last node of the soil and simulated D2O diffusion through the soil. The diffusion coefficient in soil was parameterized according to Millington and Quirk (1961):
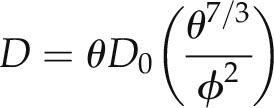 |
where θ is the soil water content (cm3 cm−3), D0 is the diffusion coefficient of D2O in pure water (cm2 s−1), and ϕ is the soil porosity. We used D0 = 2.27 × 10⁻⁹ m2 s−1, as measured by (Longsworth, 1960).
The diffusion coefficients of the root tissue were defined as follows: the diffusion of D2O in the apoplastic pathway was assumed to be one-sixth of the diffusion coefficients of D2O in pure water (D0 = 2.27 × 10⁻⁹ m2 s−1). Published values of diffusion coefficients for different solutes in the apoplast range from one-fifth to one-sixtieth of the diffusion in pure water (Pitman, 1965; Aikman et al., 1980; Richter and Ehwald, 1983; Kramer et al., 2007). We took the lower limit because D2O is a neutral molecule with a rather similar Mr compared with normal water. Higher values are expected for bigger and charged molecules. We assumed the same value for the diffusion in the xylem.
The diffusion coefficients of cortex and endodermis were obtained from inversely fitting the D2O distribution in roots during the nighttime. We fitted the D2O transport in the tip root segments assuming a constant diffusion coefficient across root tissue. This coefficient was used for the cortical cells in the root cortex and the root stele along the root length and root radius. Then, we fitted the D2O transport in the rest of the root segments to calculate the diffusion coefficient of the endodermis assuming a constant diffusion coefficient for the cortical cells obtained from the root tip.
We used the fitted diffusion coefficients for simulating the daytime experiments. For the daytime simulations, the parameters to fit were jR(x), λ, and β for the composite transport model and jR(x) for the simplified model. For those roots that were partly immersed in D2O, we also fitted the axial flux of water entering into the root segment immersed in D2O. Note that as a first attempt, we assumed that λ and β are uniform along the root length. This assumption may not be valid at the root tip, where the endodermis is not yet developed and water may flow mainly through the apoplast. The radial fluxes and diffusion coefficients are fitted for each longitudinal position along a root with intervals of 0.1 cm.
Model Implementation
A single root and the surrounding soil were modeled in cylindrical coordinates. To numerically solve Equations 7 and 8, each variable was represented in a two-dimensional matrix. Each element of the matrix encodes the identity of a specific portion of the root in radial and longitudinal positions. In our model, the soil was extended for 1 cm from the root surface. The root cortex extended from the root surface to the endodermis. The stele extended from the inner radius of the endodermis to the surface of xylem. We described the xylem as a single cylinder with a cross-sectional area corresponding to the total cross-sectional area of xylem vessels. The radii of the root, the endodermis, and the cortical cells and the cross-sectional area of the xylem were calculated from microscopic observation of the root cross section (Fig. 2C).
Equations 7 and 8 were solved numerically using a centered finite difference method. We used a rectangular computational grid with the number of equally spaced grid elements along the root radius (N) and the number of grid elements along the root length (M). The space discretization values along the root length and root radius were 0.1 and 0.0006 cm, respectively. The time derivatives were discretized with an explicit method. To ensure the stability of the simulations, we used a time step of 10−3 s.
The inverse problem was solved with a linear least-squares method using the lsqlin Solver in Matlab. The lsqlin Solver is based on the Levenberg-Marquardt algorithm, which starts by searching the minimum along the steepest gradient of the objective function and gradually switches to a direction based on a first-order approximation of the objective function. The objective function to minimize was the difference between measured and simulated concentrations of D2O along the root over time.
Different objective functions were used to estimate different parameters of the model. We used the difference between measured and simulated concentrations of D2O along a root at different times as an objective function to estimate De(x) and jR(x). When the root was partly immersed in D2O, to estimate the axial flux of normal water coming to the root segment immersed in D2O, the objective function was the difference between the average measured and simulated concentrations of D2O in the root segment immersed in D2O. Note that the final concentration of D2O in the root segment immersed in D2O depends on the axial flux of normal water coming into the root segment immersed in D2O. The difference between average measured and simulated concentrations of D2O in the root segment beyond the capillary barrier was used as the objective function to estimate λ.
We ran a sensitivity analysis to understand whether the composite transport model was sensitive to the parameters λ and β. To this end, as a first step we fitted the increase of D2O concentration into 15 roots during the nighttime. After solving the inverse problem, we obtained the distribution of the diffusion coefficients along the root length. We used these diffusion coefficients to simulate the transport of D2O in the root for varying parameters JR, λ, and β. The objective of the sensitivity analysis was to understand if the composite transport model is needed or if the simplified model can replace it without loss of precision.
RESULTS
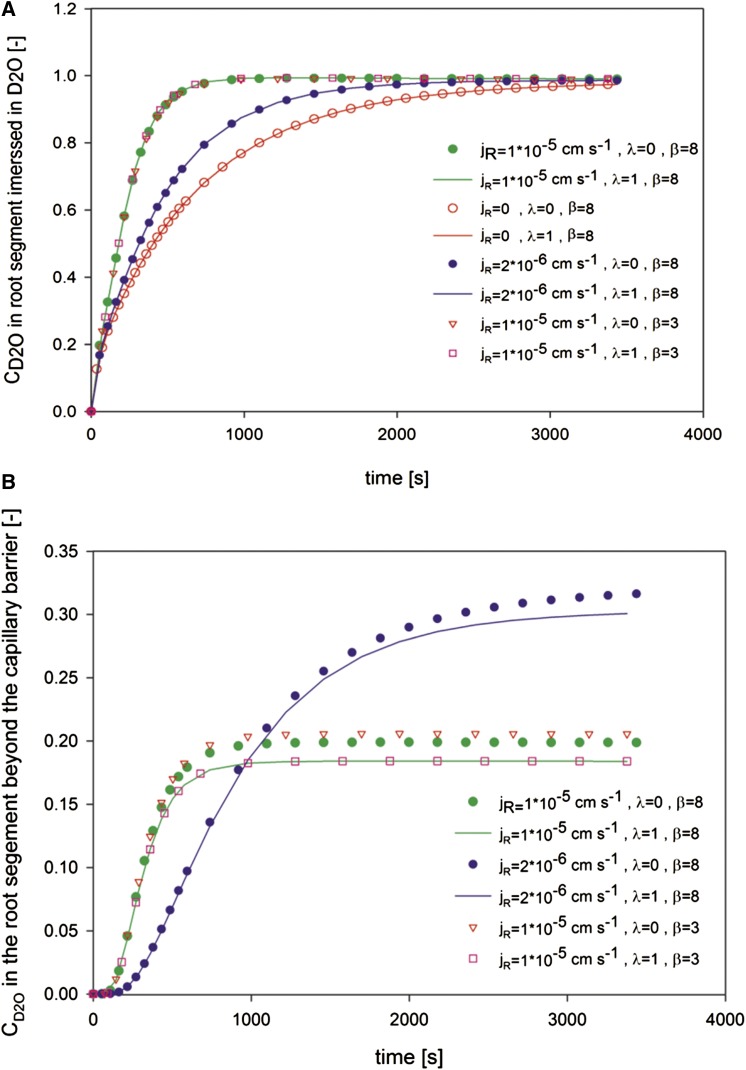
We first show the results of the sensitivity analysis. Figure 3 shows the simulated concentrations of D2O in a root segment immersed in D2O (Fig. 3A) and in the next root segment beyond the capillary barrier (Fig. 3B). We chose a range of reasonable values for jR and β, and we let λ vary from the minimum value of 0 to the maximum value of 1. For the sensitivity analysis, we assumed that jR was constant along x.
Figure 3.
Sensitivity analysis of the composite transport model. Average concentrations of D2O in the root segment immersed in D2O (A) and in the root segment beyond the capillary barrier (B) are shown.
The results show that the increase of D2O inside the root immersed in D2O was affected by the radial flux jR. Note that in Figure 3 and in all the subsequent figures, jR refers to the water fluxes at the root surface. When jR = 0, the increase of D2O was driven by diffusion and was visibly slower. The increase of D2O was faster as jR increased. Almost no differences were observed in the average concentration of D2O in the root segment immersed in D2O when the water flow changed from the purely apoplastic pathway (λ = 0) to the purely cell-to-cell pathway (λ = 1). Similarly, the concentrations of D2O in the root segment immersed in D2O were not sensitive to β. We varied β from a value of 3 to 8, corresponding to a hollow cylinder and a solid cylinder, respectively (van Genuchten, 1985; Gerke and van Genuchten, 1996).
When the radial flux increased by a factor of 5, D2O concentration beyond the capillary barrier equilibrated to a lower value (Fig. 3B). The time needed to reach equilibrium was faster. This observation is explained by the convective radial fluxes into the root that opposes the diffusion of D2O from the xylem to the rest of root tissue. In other words, the higher the convective fluxes, the lower the equilibrium concentration of D2O beyond the capillary barrier. The pathway of water through the tissue plays a role in this process: if the main pathway is cell to cell (λ = 1), the convective transport efficiently limits the diffusion; instead, if the main pathway is apoplastic (λ = 0), the convective fluxes bypass the root cells and are less efficient in opposing the diffusion of D2O out of the xylem. This is visible in Figure 3B, where the equilibrium value of the D2O concentration was lower for λ = 1 than for λ = 0. However, for the used diffusion coefficients and root radii, the differences between the simulations with λ = 1 and λ = 0 probably lie within our measurement errors. The same conclusion holds for β.
This sensitivity analysis showed that the composite transport is not sufficiently sensitive to the pathways of water through the root tissue. Therefore, to reduce the numbers of unknown parameters, we used the simplified model to quantify the transport of D2O into roots.
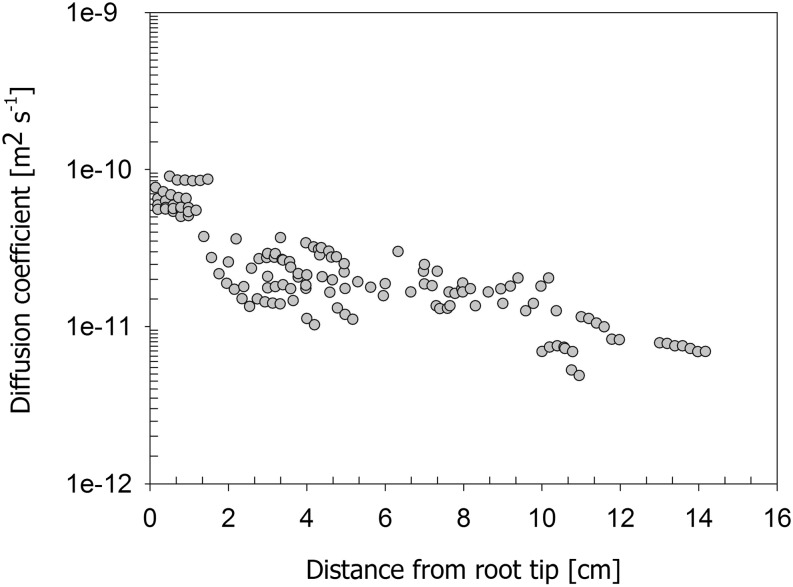
Figure 4 shows the diffusion coefficients of the endodermis as a function of distance from the root tip De(x). The data are obtained from the best fit of the simplified model to the observed average D2O concentration of 15 roots measured during the nighttime. Figure 4 shows that De(x) was higher in the distal root segments and decreased 10 times toward the proximal segment.
Figure 4.
Diffusion coefficient obtained from the best fit of the simplified model to the experimental data of D2O concentration across the root tissue during the nighttime. Note that we assumed that in the first 1.5 cm near the root tip, the diffusion of the endodermis is equal to that of the cortex. The data were obtained from 15 roots.
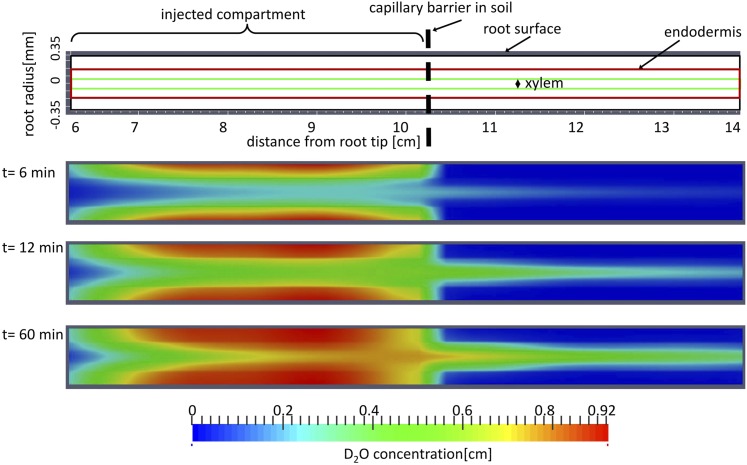
We used the diffusion coefficients estimated from the night measurements to simulate the transport of D2O into the roots during the day. The parameter to be fitted for the day measurements was jR(x). We let jR(x) be free to change along the roots and inversely estimated it by finding the best fit of the simplified model to the observed average D2O concentration in roots measured during the daytime. The simulated two-dimensional distribution of the D2O concentration in a root of 14 cm at different time steps after D2O injection is shown in Figure 5. The images show that as D2O reached the xylem, it was transported axially along the root and then diffused back in the segment beyond the barrier that was immersed in water.
Figure 5.
Simulated concentration of D2O across the root tissue at different times after D2O injection. The color bar shows the concentration of D2O in the root. The length of the root and the location of D2O injection are presented in Figure 7A.
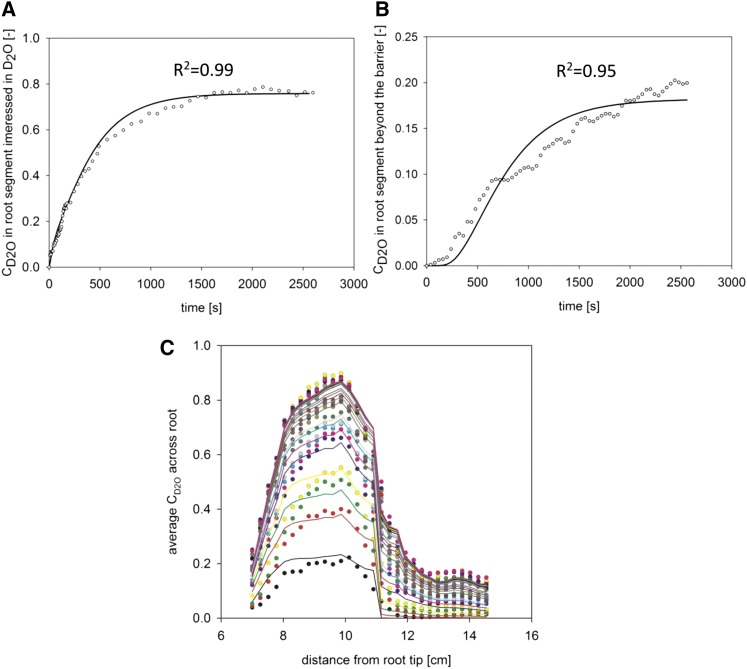
Figure 6 shows a comparison between the simulations shown in Figure 5 and the experimental data obtained from neutron radiographs. The location of D2O injection is illustrated in Figure 7A. The average concentrations of D2O in the root segment immersed in D2O (Fig. 6A) and in the root segment beyond the capillary barrier (Fig. 6B) showed a good agreement with the experimental data.
Figure 6.
Measured concentration of D2O (dots) and the best fit of the simplified model (solid lines) for roots partly immersed in D2O. The simulated concentrations refer to the root in Figure 5. Root length and location of D2O injection are illustrated in Figure 7A. A, Average D2O concentration in the root segment immersed in D2O with the best fit of the model. B, Average D2O concentration in the root segment beyond the capillary barrier with the best fit of the model. C, Average D2O concentration across the root as a function of distance to the root tip at different time steps after D2O injection. Each line refers to a different time step after D2O injection.
Figure 7.
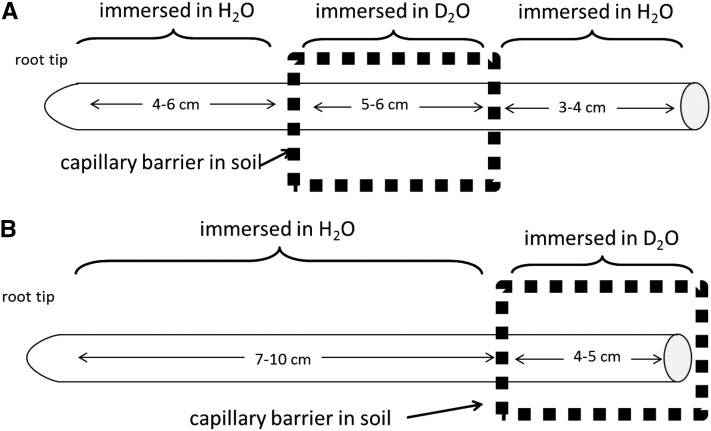
Schematic representation of the roots measured during the daytime and whose results are shown in Figure 8.
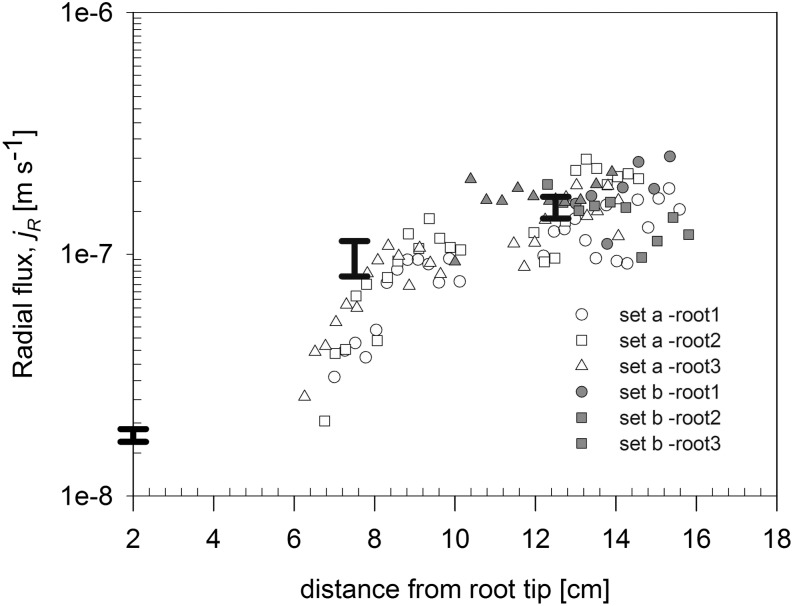
We fitted the profiles of D2O concentration along six roots during the daytime. We selected roots that had similar root lengths and were located at similar soil depths. Root lengths and locations of D2O injection are shown in Figure 7. We chose three roots that were partly immersed in D2O at their middle parts (Fig. 7A) and three roots that were partly immersed in D2O at their proximal parts (Fig. 7B). The fitted radial fluxes along the six roots are plotted in Figure 8. The results show that water uptake along the lateral roots was not uniform. Water flux was higher in the proximal segments and decreased toward the distal segments. Remarkably, the radial fluxes predicated for the root segmented beyond the capillary barrier for the roots that were immersed in D2O at the middle parts (Fig. 7A) were in line with the fluxes predicted for the roots that were immersed in D2O at the proximal parts (Fig. 7B; i.e. compare the white and black symbols at 10–16 cm from the root tip in Fig. 8). This agreement shows the validity of our method in estimating the radial fluxes for the root segment immersed in D2O and the root segment beyond the capillary barrier.
Figure 8.
Radial flux into the root as a function of distance from the root tip. The radial flux is calculated for two different sets of roots presented in Figure 7. Set a refers to roots that were partly immersed in D2O at the middle parts, and set b refers to roots that were partly immersed in D2O at the proximal parts. The bar lines show the range of radial fluxes for different positions of root calculated by Zarebanadkouki et al. (2013).
Additionally, the profile of jR(x) along the root was in agreement with the results of Zarebanadkouki et al. (2013). In Figure 8, we compared the results of Zarebanadkouki et al. (2013) with those of the new model. In Zarebanadkouki et al. (2013), the radial fluxes were calculated for the radius of the endodermis. Here, they have been scaled for being comparable to jR(x). The results of the two models match well.
DISCUSSION
We have implemented a new model of D2O transport in the roots to quantify the water fluxes from neutron radiographs. The model describes the transport of D2O with a diffusion-convection equation in cylindrical coordinates, and it includes different pathways: the apoplastic pathway and the cell-to-cell pathway.
A sensitivity analysis indicated that the transport of D2O was not sensitive to the parameter λ, which describes the relative importance of the apoplastic and cell-to-cell pathways. Therefore, to reduce the number of parameters, we used a simplified model in which there is only one lumped pathway of water across the root tissue. The model was sensitive to both the diffusional coefficient of D2O across the root tissue and the radial water flux into the root. Fitting for the diffusion coefficient the nighttime measurements and using the same coefficients for the daytime measurements allowed us to calculate the radial flux of water into the root as a function of distance from the root tip. The results showed that the diffusion coefficient was higher near the root tip and decreased toward the proximal parts. The diffusion coefficient of the tip root was 6.7 × 10⁻¹¹ m2 s−1, and it decreased to 6.5 × 10⁻¹² m2 s−1 at a distance of 14 cm from the root tip. Oppositely, the radial flux of water was lower in the distal segments than in the proximal segments. It was 3 × 10⁻⁸ m s−1 at a distance of 6 cm from the root tip, and it increased to 1.6 × 10⁻⁷ m s−1 at a distance of 15 cm from the root tip. The results are in agreement with those obtained with the previous model of Zarebanadkouki et al. (2013; Fig. 8).
The sensitivity analysis showed that the D2O transport was not sensitive to the pathways of water across the root tissue. The low sensitivity of the model was caused by the significant contribution of diffusion to the movement of D2O into the root. However, our sensitivity analysis is limited to the special case studied here and cannot be generalized to all roots. For example, the pathways of water may become important for thicker roots with low diffusion coefficients, in which convection is likely to become more important than diffusion. Some sensitivity was observed for the root segment after the barrier (i.e. in the segments after the region immersed in D2O; Fig. 3B). If the sensitivity increases and the error in our measurements decreases thanks to future technical improvements, it may become possible to estimate the relative importance of the pathways.
Another issue is that our sensitivity analysis is constrained to our assumptions. One of our assumptions is that the apoplastic pathway was completely blocked by the endodermis. In case the endodermis did not fully block the apoplast, our model should become more sensitive to λ. We also assumed that the diffusion coefficient of the cortical cells was constant along the roots. However, as roots get older, their cell membrane becomes less permeable (Bramley et al., 2009). This overestimation of the diffusion coefficient of the cortical cells in the proximal root segments would result in a quick equilibrium between the D2O concentrations in the apoplastic and cell-to-cell pathways. In this case, the concentration of D2O in the root is independent from the pathways of water, due to the similar concentration of D2O in both pathways.
The advantage of our new model compared with the previous version is that it fully solves the diffusion and convection of D2O in both radial and axial directions. In the previous model, D2O diffusion was strongly simplified. There, we assumed an immediate transport of D2O through the apoplast. We also assumed that the concentration of D2O in the root stele (45% of root volume) was uniform. In our new model, we explicitly solved the diffusion from the root surface to the xylem, including the endodermis as a layer with reduced diffusion coefficient.
Our new model includes the back diffusion of normal water from the xylem to the rest of the tissue. The back diffusion of D2O from the xylem to the rest of the root tissue becomes significant when roots are partly immersed in D2O. In this case, normal water is transported into the segments of the xylem immersed in D2O. This normal water will diffuse through the root tissue, and the D2O concentration in the root will not converge to the concentration of D2O in soil. Additionally, in our new model, the axial transport of D2O is fully solved. This allows estimating the profile of radial flux along the root length with a higher spatial resolution compared with the previous model. The previous model estimated the fluxes based on the average concentration of D2O in the root segment immersed in D2O and had a spatial resolution of around 5 cm.
To calculate jR(x), we assumed that the diffusion coefficient of cortical cells and endodermis was constant during the day and night. Although this choice allows one to reduce the uncertainty in the parameter estimation, the validity of this assumption should be critically discussed. In fact, changes in aquaporin’s activity in response to variations in the transpiration demand may alter the diffusion of D2O through the cell-to-cell pathway, the exchange of D2O between the apoplastic and cell-to-cell pathways, and the fraction of water flow through the cell-to-cell pathway λ. In the case of an increased aquaporin activity during the day and a consequent increase in the diffusion coefficients, our approach would result in an overestimation of jR(x). This is probably the most critical problem of our approach, and it is our priority to properly address it.
Our method and assumptions could be improved by three-dimensional imaging of D2O transport in the root. A three-dimensional profile of D2O concentration in roots might open new possibilities to estimate the relative importance of the apoplastic and cell-to-cell pathways. In our study, we derived the average concentration of D2O across roots from two-dimensional radiography, and the model was employed to best fit the average concentration. However, an average concentration of D2O in the root is obviously not sufficient to estimate the spatial distribution of D2O across the root tissue. New advancements in neutron tomography imaging could also allow quantifying the diffusion coefficient of cortical cells along the root. To this end, tomography faster than 1 min would be required. While waiting for future advancements in neutron imaging, we can use our modeling approach to reconstruct the water transport through the entire root systems.
In conclusion, the significance of this study is the description of a new method to locally quantify the flow of water into living roots grown in soil. Thanks to this method, we can measure where roots take up water from soil. So far, we employed the method to study lupines growing in sandy, wet soils. As the soil dries, the hydraulic conductivity of roots and their rhizosphere is expected to decrease, affecting root water uptake. In these circumstances, the location of root water uptake may shift to different root segments, for instance to young and distal root segments covered with hydrated mucilage, as proposed by Carminati and Vetterlein (2013). This method would allow testing such a hypothesis. It would also be of high interest to employ the method to study water uptake in plants with contrasting root architectures and growing in different soil conditions. The measured water fluxes into the roots can be used to reconstruct the profile of axial and radial hydraulic conductivities as well as the xylem water potential along the root system, as done by Doussan et al. (1998). Hopefully, such information will help to identify the root traits that best increase the plant efficiency in taking up water from soil.
MATERIALS AND METHODS
Experimental Setup
Soil and plant preparation and image processing were described in detail by Zarebanadkouki et al. (2012, 2013). Lupine (Lupinus albus) was grown in 25-cm-wide, 30-cm-high, and 1-cm-thick aluminum containers filled with a sandy soil. The soil was partitioned into 16 compartments using 1-cm layers of coarse sand as capillary barriers, which served to limit the diffusion of D2O in selected regions (Fig. 9). The measurements with neutron radiography were conducted when plants were 18 to 21 d old. The plants were regularly irrigated during growth. The soil water content in each compartment ranged from 0.1 to 0.2 cm3 cm−3 at the beginning of the neutron radiography experiment. We injected D2O in selected soil regions, and its transport into the roots was monitored for 2 h using time-series neutron radiography at the imaging station ICON at the Paul Scherrer Institute in Switzerland. The measurements were performed during the daytime when plants fully transpired and during the nighttime when transpiration was reduced. The sharp contrast between roots and the surrounding soil allowed us to distinguish and segment the roots from the soil. The segmented roots were skeletonized, and their lengths and diameters were calculated using the Euclidean distance. Neutron attenuation in the pixels containing roots was the sum of the attenuation coefficients of the roots and of the soil in front of and behind the roots in the beam direction (across soil thickness). The actual contributions of water and D2O in the roots were calculated assuming that the amounts of water and D2O in the soil in the front of and behind the roots were equal to those of the soil at the sides of the roots. We calculated the volumetric concentration of D2O in roots (Cr) and soil (C0) as the thickness of D2O divided by the total liquid thickness in roots and soil, respectively. More details about the image processing are found in Zarebanadkouki et al. (2012).
Figure 9.
Neutron radiograph of the sample used during daytime measurement. The radiograph was obtained from stitching four radiographs with marginal overlap. The higher gray value corresponds to the higher soil water content (dark = wet). The compartments marked with stars were used for D2O injection during the daytime. The bright horizontal and vertical strips show the location of the capillary barrier used to stop the transport of D2O in soil. Note that we irrigated the dry compartments 1 d before the D2O injection experiment started.
Acknowledgments
We thank Jan Vanderborght, Katrin Huber, and Heino Nietfeld for discussions and suggestions on the composite transport model and Valentin Couvreur and Chris Topp for helpful suggestions and comments on a previous version of this article.
Glossary
- D2O
deuterated water
Footnotes
Some figures in this article are displayed in color online but in black and white in the print edition.
References
- Aikman DP, Harmer R, Rust TSO. (1980) Electrical resistance and ion movement through excised discs of sugar beet root tissue. Physiol Plant 48: 395–402 [Google Scholar]
- Aravena JE, Berli M, Ghezzehei TA, Tyler SW. (2011) Effects of root-induced compaction on rhizosphere hydraulic properties: x-ray microtomography imaging and numerical simulations. Environ Sci Technol 45: 425–431 [DOI] [PubMed] [Google Scholar]
- Blizzard WE, Boyer JS. (1980) Comparative resistance of the soil and the plant to water transport. Plant Physiol 66: 809–814 [DOI] [PMC free article] [PubMed] [Google Scholar]
- Bramley H, Turner NC, Turner DW, Tyerman SD. (2009) Roles of morphology, anatomy, and aquaporins in determining contrasting hydraulic behavior of roots. Plant Physiol 150: 348–364 [DOI] [PMC free article] [PubMed] [Google Scholar]
- Carminati A. (2012) A model of root water uptake coupled with rhizosphere dynamics. Vadose Zone J 11: 10.2136/vzj2011.0106 [Google Scholar]
- Carminati A. (2013) Rhizosphere wettability decreases with root age: a problem or a strategy to increase water uptake of young roots? Front Plant Sci 4: 298. [DOI] [PMC free article] [PubMed] [Google Scholar]
- Carminati A, Moradi AB, Vetterlein D, Vontobel P, Lehmann E, Weller U, Vogel HJ, Oswald SE. (2010) Dynamics of soil water content in the rhizosphere. Plant Soil 332: 163–176 [DOI] [PubMed] [Google Scholar]
- Carminati A, Schneider CL, Moradi AB, Zarebanadkouki M, Vetterlein D, Vogel HJ, Hildebrandt A, Weller U, Schüler L, Oswald SE. (2011) How the rhizosphere may favor water availability to roots. Vadose Zone J 10: 988 [Google Scholar]
- Carminati A, Vetterlein D. (2013) Plasticity of rhizosphere hydraulic properties as a key for efficient utilization of scarce resources. Ann Bot (Lond) 112: 277–290 [DOI] [PMC free article] [PubMed] [Google Scholar]
- Carminati A, Zarebanadkouki M. (2013) Comment on: “Neutron imaging reveals internal plant water dynamics.” Plant Soil 369: 25–27 [Google Scholar]
- Doussan C, Pagès L, Vercambre G. (1998) Modelling of the hydraulic architecture of root systems: an integrated approach to water absorption. Model description. Ann Bot (Lond) 81: 213–223 [Google Scholar]
- Frensch J, Steudle E. (1989) Axial and radial hydraulic resistance to roots of maize (Zea mays L.). Plant Physiol 91: 719–726 [DOI] [PMC free article] [PubMed] [Google Scholar]
- Fritz M, Ehwald R. (2011) Mannitol permeation and radial flow of water in maize roots. New Phytol 189: 210–217 [DOI] [PubMed] [Google Scholar]
- Garrigues E, Doussan C, Pierret A. (2006) Water uptake by plant roots. I. Formation and propagation of a water extraction front in mature root systems as evidenced by 2D light transmission imaging. Plant Soil 283: 83–98 [Google Scholar]
- Gerke HH, van Genuchten MT. (1996) Macroscopic representation of structural geometry for simulating water and solute movement in dual-porosity media. Adv Water Resour 19: 343–357 [Google Scholar]
- Huang B, Nobel PS. (1993) Hydraulic conductivity and anatomy along lateral roots of cacti: changes with soil water status. New Phytol 123: 499–507 [DOI] [PubMed] [Google Scholar]
- Javaux M, Schröder T, Vanderborght J, Vereecken H. (2008) Use of a three-dimensional detailed modeling approach for predicting root water uptake. Vadose Zone J 7: 1079 [Google Scholar]
- Knipfer T, Besse M, Verdeil JL, Fricke W. (2011) Aquaporin-facilitated water uptake in barley (Hordeum vulgare L.) roots. J Exp Bot 62: 4115–4126 [DOI] [PMC free article] [PubMed] [Google Scholar]
- Knipfer T, Fricke W. (2011a) Water uptake by seminal and adventitious roots in relation to whole-plant water flow in barley (Hordeum vulgare L.). J Exp Bot 62: 717–733 [DOI] [PMC free article] [PubMed] [Google Scholar]
- Knipfer T, Fricke W. (2010b) Root pressure and a solute reflection coefficient close to unity exclude a purely apoplastic pathway of radial water transport in barley (Hordeum vulgare). New Phytol 187: 159–170 [DOI] [PubMed] [Google Scholar]
- Kramer EM, Frazer NL, Baskin TI. (2007) Measurement of diffusion within the cell wall in living roots of Arabidopsis thaliana. J Exp Bot 58: 3005–3015 [DOI] [PubMed] [Google Scholar]
- Longsworth LG. (1960) The mutual diffusion of light and heavy water. J Phys Chem 64: 1914–1917 [Google Scholar]
- Matsushima U, Kardjilov N, Hilger A, Graf W, Herppich WB. (2012) Application potential of cold neutron radiography in plant science research. J Appl Bot Food Qual 82: 90–98 [Google Scholar]
- McCully M. (1995) How do real roots work? Some new views of root structure. Plant Physiol 109: 1–6 [DOI] [PMC free article] [PubMed] [Google Scholar]
- McLean EH, Ludwig M, Grierson PF. (2011) Root hydraulic conductance and aquaporin abundance respond rapidly to partial root-zone drying events in a riparian Melaleuca species. New Phytol 192: 664–675 [DOI] [PubMed] [Google Scholar]
- Millington RJ, Quirk JP. (1961) Permeability of porous solids. Trans Faraday Soc 57: 1200–1207 [Google Scholar]
- Moradi AB, Carminati A, Vetterlein D, Vontobel P, Lehmann E, Weller U, Hopmans JW, Vogel HJ, Oswald SE. (2011) Three-dimensional visualization and quantification of water content in the rhizosphere. New Phytol 192: 653–663 [DOI] [PubMed] [Google Scholar]
- Moradi AB, Conesa HM, Robinson B, Lehmann E, Kuehne G, Kaestner A, Oswald S, Schulin R. (2008) Neutron radiography as a tool for revealing root development in soil: capabilities and limitations. Plant Soil 318: 243–255 [Google Scholar]
- Nobel PS, Cui M. (1992) Hydraulic conductances of the soil, the root-soil air gap, and the root: changes for desert succulents in drying soil. J Exp Bot 43: 319–326 [Google Scholar]
- North GB, Nobel PS. (1997) Drought-induced changes in soil contact and hydraulic conductivity for roots of Opuntia ficus-indica with and without rhizosheaths. Plant Soil 191: 249–258 [Google Scholar]
- Nye PH. (1994) The effect of root shrinkage on soil water inflow. Philos Trans R Soc Lond B Biol Sci 345: 395–402 [Google Scholar]
- Pitman M. (1965) Sodium and potassium uptake by seedlings of Hordeum vulgare. Aust J Biol Sci 18: 10–24 [Google Scholar]
- Pohlmeier A, Oros-Peusquens A, Javaux M, Menzel MI, Vanderborght J, Kaffanke J, Romanzetti S, Lindenmair J, Vereecken H, Shah NJ. (2008) Changes in soil water content resulting from root uptake monitored by magnetic resonance imaging. Vadose Zone J 7: 1010–1017 [Google Scholar]
- Richter E, Ehwald R. (1983) Apoplastic mobility of sucrose in storage parenchyma of sugar beet. Physiol Plant 58: 263–268 [Google Scholar]
- Steudle E. (2000) Water uptake by plant roots: an integration of views. Plant Soil 226: 45–56 [Google Scholar]
- van Genuchten MT. (1985) A general approach for modeling solute transport in structured soils. Mem Int Assoc Hydrogeol 17: 513–526 [Google Scholar]
- Varney GT, Canny MJ. (1993) Rates of water uptake into the mature root system of maize plants. New Phytol 123: 775–786 [Google Scholar]
- Warren JM, Bilheux H, Cheng CL, Perfect E. (2013a) Reply to: Comment on “Neutron imaging reveals internal plant water dynamics.” Plant Soil 371: 15–17 [Google Scholar]
- Warren JM, Bilheux H, Kang M, Voisin S, Cheng CL, Horita J, Perfect E. (2013b) Neutron imaging reveals internal plant water dynamics. Plant Soil 366: 683–693 [Google Scholar]
- Zarebanadkouki M, Carminati A. (2014) Reduced root water uptake after drying and rewetting. J Plant Nutr Soil Sci 177: 227–236 [Google Scholar]
- Zarebanadkouki M, Kim YX, Carminati A. (2013) Where do roots take up water? Neutron radiography of water flow into the roots of transpiring plants growing in soil. New Phytol 199: 1034–1044 [DOI] [PubMed] [Google Scholar]
- Zarebanadkouki M, Kim YX, Moradi AB, Vogel HJ, Kaestner A, Carminati A. (2012) Quantification and modeling of local root water uptake using neutron radiography and deuterated water. Vadose Zone J 11: 10.2136/vzj2011.0196 [Google Scholar]
- Zwieniecki MA, Thompson MV, Holbrook NM. (2003) Understanding the hydraulics of porous pipes: tradeoffs between water uptake and root length utilization. J Plant Growth Regul 21: 315–323 [Google Scholar]


