

The optimal lateral root branching density in the maize root system depends on the relative availability of nitrate (a mobile soil resource) and phosphorus (an immobile soil resource), with the optimum shifting to more branches when the nitrate-to-phosphorus ratio is high.
Abstract
Observed phenotypic variation in the lateral root branching density (LRBD) in maize (Zea mays) is large (1–41 cm−1 major axis [i.e. brace, crown, seminal, and primary roots]), suggesting that LRBD has varying utility and tradeoffs in specific environments. Using the functional-structural plant model SimRoot, we simulated the three-dimensional development of maize root architectures with varying LRBD and quantified nitrate and phosphorus uptake, root competition, and whole-plant carbon balances in soils varying in the availability of these nutrients. Sparsely spaced (less than 7 branches cm−1), long laterals were optimal for nitrate acquisition, while densely spaced (more than 9 branches cm−1), short laterals were optimal for phosphorus acquisition. The nitrate results are mostly explained by the strong competition between lateral roots for nitrate, which causes increasing LRBD to decrease the uptake per unit root length, while the carbon budgets of the plant do not permit greater total root length (i.e. individual roots in the high-LRBD plants stay shorter). Competition and carbon limitations for growth play less of a role for phosphorus uptake, and consequently increasing LRBD results in greater root length and uptake. We conclude that the optimal LRBD depends on the relative availability of nitrate (a mobile soil resource) and phosphorus (an immobile soil resource) and is greater in environments with greater carbon fixation. The median LRBD reported in several field screens was 6 branches cm−1, suggesting that most genotypes have an LRBD that balances the acquisition of both nutrients. LRBD merits additional investigation as a potential breeding target for greater nutrient acquisition.
At least four major classes of plant roots can be distinguished based on the organ from which they originate: namely the seed, the shoot, the hypocotyl/mesocotyl, and other roots (Zobel and Waisel, 2010). The last class is lateral roots, which form in most plants the majority of the root length, but not necessarily of the root weight, as lateral roots have smaller diameter. Lateral roots start with the formation of lateral root primordia, closely behind the root tip of the parent root. These primordia undergo nine distinguishable steps, of which the last step is the emergence from the cortex of the parent root just behind the zone of elongation, usually only a few days after the first cell divisions that lead to their formation (Malamy and Benfey, 1997). However, not all primordia develop into lateral roots; some stay dormant (Dubrovsky et al., 2006), although dormancy of primordia may not occur in maize (Zea mays; Jordan et al., 1993; Ploshchinskaia et al., 2002). The final number of lateral roots is thereby dependent on the rate of primordia formation as well as the percentage of primordia that develop into lateral roots. This process of primordia formation and lateral root emergence is being studied intensively, including the genes that are activated during the different steps and the hormones regulating the process (López-Bucio et al., 2003; Dubrovsky et al., 2006; Osmont et al., 2007; Péret et al., 2009; Lavenus et al., 2013). Significant genotypic variation in the density of lateral roots has been observed, ranging from no lateral roots to 41 roots cm−1 in maize (Table I; Trachsel et al., 2010; Lynch, 2013). This suggests that clear tradeoffs exist for the development of lateral roots and that these genotypes have preprogrammed growth patterns that are adaptive to specific environments. While some of the variation for lateral root branching density (LRBD) that has been observed across environments, for example by Trachsel et al. (2010), is constitutive, many genotypes have strong plasticity responses of LRBD to variations in soil fertility (Zhu et al., 2005a; Osmont et al., 2007). Both the nutrient and carbon status of the plant and the local nutrient environment of the (parent) root tip influence LRBD. Many studies have documented these plasticity responses, and others have tried to unravel parts of the sensing and signaling pathways that regulate LRBD. The utility of root proliferation into a nutrient patch has been studied and debated (Robinson et al., 1999; Hodge, 2004), but much less so the utility of having fewer or more branches across the whole root system. Our understanding of the adaptive significance of variation in LRBD among genotypes is thereby limited, with many studies not accounting for relevant tradeoffs. In this study, we integrate several functional aspects of LRBD with respect to nutrient acquisition, root competition, and internal resource costs and quantify these functional aspects using the functional structural plant model SimRoot. SimRoot simulates plant growth with explicit representation of root architecture in three dimensions (Fig. 1; Supplemental Movie S1). The model focuses on the resource acquisition by the root system and carbon fixation by the shoot while estimating the resource utilization and requirements by all the different organs.
Table I. Minimum, maximum, and median LRBD in different populations phenotyped by various researchers at several locations in the world.
Locations are as follows: D, Juelich, Germany; PA, State College, PA; and SA, Alma, South Africa. Some of the experiments included nutrient treatments: LN, low nitrogen availability; and LP, low phosphorus availability. Data were collected by counting the number of roots along a nodal root segment. Data were supplied by the person indicated under source: H.S., H. Schneider; L.Y., L. York; A.Z., A. Zhan; and J.P., J.A. Postma. WiDiv, Wisconsin Diversity panel; IBM, intermated B73 × Mo17; NAM, nested association mapping.
| Population | No. of Genotypesa | Experiment | Location | Date | Nutrient Treatments | Source |
LRBD |
||
|---|---|---|---|---|---|---|---|---|---|
| Minimum | Maximum | Median | |||||||
| cm−1 | |||||||||
| WiDiv | 527 | Field | SA | 2010 | – | H.S. | 1 | 15 | 9 |
| 400 | Field | SA | 2011, 2012 | – | H.S. | 0 | 18 | 6 | |
| 400 | Field | SA | 2013 | LN | H.S. | 0 | 13 | 6 | |
| IBM | 30 | Field | SA, PA | 2012, 2013, 2014 | LN | L.Y. | 0 | 41 | 6 |
| 18 | Mesocosms | PA | 2013 | LN | A.Z. | 1 | 10 | 4 | |
| NAM | 1,235 | Field | SA | 2010, 2011, 2012 | – | H.S. | 0 | 14 | 6 |
| 6 | Rhizotrons | D | 2011 | LN, LP | J.P. | 1 | 14 | 4 | |
Means for the individual treatments are presented in Supplemental Appendix S4, Figure S5.
Figure 1.

Rendering of two simulated maize root systems. The model presents 40-d-old maize root systems with 2 (left) and 20 (right) branches cm−1 major root axes. The simulations depicted here assumed that there were no nutrient deficiencies affecting growth. Carbon limitations do cause the laterals in the right root system to stay somewhat shorter. Different major axes, with their respective laterals, have different pseudocolors: light blue, primary root; green, seminal roots; red, crown roots; and yellow, brace roots. For animation of these root systems over time, see Supplemental Movie S1.
The formation of lateral roots presumably increases the sink strength of the root system, promoting the development of greater root length and thereby greater nutrient and water acquisition. However, greater LRBD also places roots closer together, which may increase competition for nutrients and water among roots of the same plant, effectively reducing the uptake efficiency per unit of root length. This decrease in efficiency when the root system increases in size was nicely modeled by Berntson (1994). Furthermore, the metabolic costs of the construction and maintenance of the additional root length, either calculated in units of carbon or in terms of other limiting resources, may reduce the growth of other roots or the shoot (Lynch, 2007b). We can thereby logically derive that there will be an optimum number of lateral roots depending on the balance of the marginal cost of root production and the marginal utility of soil resource acquisition. Therefore, the optimal LRBD will depend on environmental conditions. It is not clear in the literature what the optimal branching density might be, and how different environmental factors shift this optimum to fewer or more lateral branches per centimeter of parent root. Considering the primacy of soil resources as pervasive limitations to plant growth, understanding the utility and tradeoffs of lateral root branching density is important in understanding the evolution of root architecture and plant environmental adaptation in general. In addition, such information would be useful for trait-based selection to develop cultivars with increased productivity on soils with suboptimal availability of nutrients. The necessity and prospects of developing such cultivars are outlined by Lynch (2007a, 2011).
Here, we present results from root architectural simulations with which we estimated the optimal lateral branching density in maize in soils with variable availability of nitrogen and phosphorus. The model simulated the uptake benefits from having additional lateral roots, root competition as affected by the three-dimensional placement of roots over time, metabolic costs of lateral roots, and effects on whole-plant root architecture, notably with respect to rooting depth.
RESULTS
Simulated biomass production by 40-d-old maize plants on low-nitrate and low-phosphorus soils had differential sensitivity to the LRBD (Fig. 2). Maximum growth on low-nitrate soils was achieved with 1 to 3 branches cm−1, while on soils with greater yet suboptimal nitrate availability, this optimum shifted to 5 to 8 branches cm−1. For phosphorus acquisition, the highest tested branching frequency, 20 branches cm−1, was optimal. However, the simulated biomass production was not sensitive to LRBD beyond about 9 branches cm−1. Total simulated phosphorus and nitrate uptake followed very similar patterns to biomass production, except that nutrient uptake continued to increase with greater nutrient availability, even when it did not increase biomass (Fig. 3). For example, at LRBD 10, there were no significant differences in biomass production between the highest two nitrate or phosphorus levels, despite differences in nitrate and phosphorus uptake. The ceiling for biomass at 36 g plant−1 is a result of the model assumptions that relative growth rates cannot be greater than empirical values measured under high-fertility conditions. Nutrient uptake only reached a maximum when nutrient concentrations in the soil solution were, for all root segments during the whole simulation time, so large that uptake was limited by the Vmax, Vmax being the asymptote of the Michealis-Menten uptake function. This was never the case in these simulations, and nutrient uptake did not saturate. Total root length followed a similar pattern as the biomass response to LRBD with some exceptions (Fig. 4). At LRBD 12 and a phosphorus level of 0.84 kg ha−1, the model simulated a root length of 900 m, 200 m longer than the maximum of any of the nitrate runs. This large root length resulted from changes in root/shoot allocation, as the model is parameterized (Supplemental Appendix S1, section 2.16.7) in such a way that suboptimal phosphorus uptake reduces leaf area expansion rates and thereby allows a greater proportion of the daily carbohydrates to be allocated to the root system (in accordance with Lynch et al. [1991] and Usuda and Shimogawara [1991]). Concurrently, photosynthesis rates, which influence the total amount of carbohydrates available for growth, are not strongly affected by mild phosphorus deficiency.
Figure 2.

Simulated plant dry weight (g) at 40 d after germination. Each dot represents one simulation in which the maize root system had a given branching frequency (x axis) and a given nutrient regime (see key). A, Simulations for which nitrogen was the growth-limiting nutrient. B, Simulations for which phosphorus was the growth-limiting nutrient. Lines are smoothed splines drawn through the results of a set of simulations that had the same initial nutrient conditions. Nutrient conditions are presented as the initial nutrient availability (in kg ha−1) at the start of the simulation. For phosphorus, this is phosphate (PO4) in solution (not including the buffering). For each line, the region that is within 95% of the maximum is highlighted in gray. The vertical light blue line indicates the median branching frequency observed in a diverse panel of maize lines (Table I). For nitrate, the 104 kg ha−1 scenario is partly hidden behind the 208 kg ha−1 scenario. [See online article for color version of this figure.]
Figure 3.

As in Figure 2, but showing total nitrate and phosphorus uptake (mmol) instead of the plant dry weight. [See online article for color version of this figure.]
Figure 4.

As in Figure 2, but showing total root length (m) instead of the plant dry weight. [See online article for color version of this figure.]
In contrast low nitrogen status is assumed to reduce both leaf area expansion rates as well as photosynthetic rates per unit of leaf area; consequently, less carbohydrates are available for root growth compared with the low phosphorus simulations. Root length in the medium to high phosphorus runs (0.5 kg ha−1 or greater) declined from LRBD of about 10 to 12 to 20 branches cm−1 (Fig. 4). This decline is somewhat remarkable, as the total uptake and biomass increased. However, the root length duration, which is the integral of the root length over time in cm d, did not decline; rather, greater LRBD resulted in greater root growth initially, followed by reduced growth (Supplemental Appendix S2, Figs. S1 and S2). While the increased respiratory burden of the early root growth may play a role here, the results are mostly explained by a change in root/shoot allocation, triggered by the improved phosphorus status of the plant. This is best observed in the medium phosphorus simulations (0.84 kg ha−1) compared with the higher phosphorus simulations. Improved phosphorus status of the phosphorus-deficient plants, caused by the increased root growth during early plant establishment when LRBD is greater, caused greater relative shoot growth rates (for the relation between growth rates and phosphorus status, see Supplemental Appendix S1, section 2.16.7.1), which may compete with root growth for carbohydrates during later stages. In other words, the model simulated a typical increase in root-to-shoot ratio as the plant was increasingly more stressed. Reduced root growth during later stages may eventually reduce nutrient uptake and thereby reduce overall plant growth. However, this could again result in greater root growth, correcting the reduced length. These results represent fluctuations in carbon allocation in order to establish a nutrient homeostasis (functional equilibrium), which we will discuss below. An important point here is that greater LRBD may increase these fluctuations in root/shoot allocation, which complicates the relationship of LRBD with sustained root growth, nutrient uptake, and plant growth.
Carbon availability for root growth plays an important role in our results, as greater sink strength of the root system must be balanced with sufficient source strength in order to have greater root growth and subsequently greater soil exploration. We varied the source strength by increasing or decreasing the carbon fixation by the shoot by 20% (Fig. 5; Supplemental Appendix S3, Fig. S1). Increasing the carbon fixation increased the root length, total nutrient uptake, and growth significantly. It also shifted the optimal LRBD for nitrate acquisition from 2 to 4 branches cm−1 at 20% less carbon fixation to 5 to 20 branches cm−1 at 20% more carbon fixation. The phosphorus results do not show this shift toward greater branching frequencies with increasing carbon fixation, as greater branching frequencies are optimal even at a low carbon fixation rate (Supplemental Appendix S2, Fig. S1).
Figure 5.

As in Figure 2, but showing shoot dry weights. Results are shown for when the carbon (C) fixation was reduced (A), the same as in Figure 2 (B), or increased (C). [See online article for color version of this figure.]
Greater lateral root growth early in development followed by reduced lateral root growth during later stages may have consequences for overall rooting depth, as young laterals, recently formed in the vicinity to the tips of the major root axis, have greater growth rates than older laterals (for parameterization, see Supplemental Appendix S1, section 2.6.10). Furthermore, plant size in general influences root distribution. SimRoot accounts for the carbon allocation tradeoff between lateral roots and the axial roots, such that in the high-LRBD plants, the growth of axial roots may be reduced, causing shallower rooting. All three aspects, early growth, final plant size, and carbon allocation tradeoffs, may influence the depth of the root system differentially. The simulation results show that the sensitivity of the rooting depth (here shown as the depth above which 95% of the root system is located) for LRBD depends on the limiting nutrient (Fig. 6). For the phosphorus scenarios, the rooting depth was only slightly shallower when LRBD increased, while for the nitrate scenarios, the rooting depth was more sensitive to LRBD. As explained above, carbon availability restricts root growth in the nitrate scenarios more than in the phosphorus scenarios; consequently, allocation tradeoffs are stronger and the root system becomes more shallow in the high-LRBD runs. We simulated common soil scenarios in which most of the phosphorus is available in the topsoil while the nitrate is initially in the topsoil but leaches to deeper strata over time. Consequently, shallower rooting, associated with high LRBD, is beneficial for phosphorus uptake but not for nitrate uptake.
Figure 6.

As in Figure 2, but showing the depth above which 95% of the roots reside (m) and thereby a measure for rooting depth instead of the plant dry weight. [See online article for color version of this figure.]
Competition among roots may affect the resource acquisition of the entire root system. We plotted the uptake of nitrate and phosphorus per unit of root length duration (i.e. uptake efficiency) in order to understand how effective the individual root segments were in taking up nitrate and phosphorus (Fig. 7). We see that, in general, uptake efficiency for nitrate decreased with increasing LRBD, consistent with the idea that root competition increases with increasing LRBD and that increasing root shallowness reduces the uptake efficiency of nitrate. For phosphorus, root length duration is a good predictor of the total phosphorus uptake, and the uptake efficiency of phosphorus was sensitive to the phosphorus availability but not the LRBD. This is consistent with the idea that phosphorus depletion zones are small and, therefore, competition among roots is also relatively small, and consequently, root system shallowness was little affected by LRBD in the phosphorus simulations. In order to quantify root competition, we calculated the percentage overlap of the phosphorus depletion zones, defined as any soil domain in which the phosphorus concentration is reduced by at least 5% due to root foraging. The total overlap of phosphorus depletion zones at 40 d after germination, for which we made no distinction between the overlap of depletion zones of roots of the same plant or roots of neighboring plants, increased from 14% to 20% when the LRBD increased from 4 to 20 branches cm−1 (Supplemental Appendix S2, Fig. S3)
Figure 7.

As in Figure 2, but showing the nutrient uptake per surface duration (μmol cm−2 d−1) instead of the plant dry weight. The y axis shows the total nutrient uptake (Fig. 3) divided by the root surface area duration, which is the integral of the root surface area over time and thereby an important component for explaining total nutrient uptake. Root competition as well as less favorable coincidences of roots and nutrients in space and time may decrease the uptake per unit area. [See online article for color version of this figure.]
So far, we have presented simulation results in which only phosphorus or nitrogen was growth limiting. In order to understand a possible tradeoff for phosphorus or nitrogen uptake with respect to the LRBD, we ran several simulations in which we simulated both nitrate and phosphorus uptake simultaneously, allowing suboptimal nitrogen or phosphorus concentration in the shoot to have differential effects on leaf elongation and/or photosynthesis (Fig. 8). A previous study has shown that, depending on the nitrate and phosphorus availability, the uptake of both nutrients can be suboptimal at any one time during development, but that it is more likely that during early development phosphorus limits growth while during later stages nitrogen limits growth (Dathe et al., 2012). In this study, the relative availability of nitrate and phosphorus determined the optimal LRBD for growth. When nitrate availability was relatively low, plants grew better with low LRBD, which favors nitrate acquisition. When phosphorus was relatively low, plants grew better with high LRBD, favoring phosphorus acquisition. The concentration bandwidth at which the optimal LRBD shifts is relatively small, as the model fairly quickly switches from growth limited by one nutrient to growth limited by the other nutrient. This may be partly a deficit of the model not simulating plasticity responses to nutrient availability; however, this response is also consistent with the Sprengel-Liebig law of the minimum, which was based on careful observations of plant growth responses to fertilization (Dathe et al., 2012).
Figure 8.

As in Figure 2, but here we did not assume that when varying the availability of one nutrient the availability of the other nutrient was high. That is, in A, the phosphorus availability was 0.588 kg ha−1, and in B, the nitrate availability was 18.2 kg ha−1. Thereby, the biomass response shows how well the LRBD phenotype (x axis) performed in a soil where the relative availability of both nitrate and phosphorus might limit growth at some time during the life cycle of the plant. [See online article for color version of this figure.]
DISCUSSION
Genetic variation in LRBD (Table I; Trachsel et al., 2010) and the often observed plasticity responses of LRBD to different environmental factors (Osmont et al., 2007) suggest the existence of an environmentally dependent optimum LRBD for the acquisition of nutrients. Our results provide a theoretical basis for this optimum and show that the growth of maize under low nitrogen or phosphorus availability is sensitive to LRBD (Fig. 2). Greater LRBD (more than 9 laterals cm−1) is advantageous for phosphorus acquisition, while less LRBD (less than 7 laterals cm−1) is advantageous for nitrate acquisition. We will first discuss the phosphorus results, then the nitrate results, and finally the results when the availabilities of both nutrients are low.
Phosphorus
Fine roots are considered to be important for phosphorus acquisition, as they provide the greatest surface area for nutrient uptake for the least investment in biomass (i.e. the greatest return in phosphorus relative to the investment in carbon and phosphorus; Föhse et al., 1991; Zhu and Lynch, 2004; Hammond et al., 2009). For example, Silberbush and Barber (1983) showed that, in their model, phosphorus uptake was more responsive to changes in elongation growth rather than to changes in root radius. As a species with no secondary root growth, maize makes roots of varying diameters that remain constant over time. To a first approximation, the cost of a tissue is related to its volume, which has a quadratic relationship with root radius (assuming that the root approximates a cylinder) but a linear relationship with root elongation. An increase in diameter will increase uptake per unit of root length by increasing the root surface area at a quadratically increasing cost. Exploration of new soil via root elongation will increase uptake linearly with cost, given that the phosphorus availability in newly explored soil is constant. It follows that fine roots have an advantage over thick roots for phosphorus uptake. Furthermore, Silberbush and Barber (1983) also showed that, under agricultural conditions, phosphorus uptake was not sensitive to the distance between roots (i.e. root competition). Similarly, Wilberts et al. (2013) concluded that root competition is less for immobile nutrients. Wissuwa (2003) found in a simulation study that increasing root fineness by 22% increased phosphorus uptake by 3-fold, although a large part of this result could be contributed to the positive feedback of phosphorus uptake on growth of the whole plant, including the root system. Therefore, our observation that greater LRBD increases phosphorus capture, while decreasing average root diameter and not substantially increasing root competition, is consistent with expectations from the literature.
When internal resource pools of carbon or nutrients limit root growth, increasing LRBD may not increase the size of the root system. In our simulations, the growth rate of the lateral roots was assumed to be more sensitive to carbon availability than the growth of axial roots, similar to observations by Borch et al. (1999) and Mollier and Pellerin (1999). Consequently, LRBD and total root length were only positively correlated in the lesser LRBD ranges. Greater LRBD increases the total sink strength of the root system by increasing the number of lateral roots, but resource limitations at high LRBD cause the average growth rate of the lateral roots to decrease. This tradeoff between the number of laterals and the average length of laterals has been nicely shown in a large experimental data set by Pagès and Pellerin (1994). In our simulations at LRBD > 9, the total root length did not increase but, depending on the phosphorus level, remained constant or decreased (Fig. 4). There are three interacting processes in the model that contribute to this decrease: (1) a reduction in the number of secondary laterals, which only emerge from relatively long primary laterals; (2) an increased respiratory burden because of increased root growth during early growth stages; and (3) improved phosphorus status due to early increased root growth results in greater shoot growth and greater shoot-root ratios, reducing root growth slightly. The individual contributions of these processes are not easily determined, as they are tightly linked to other processes. For example, there is no obvious way of keeping the number and spatial distribution of the secondary lateral the same while changing the number of first order laterals. In low-phosphorus nutrient solution, Arabidopsis (Arabidopsis thaliana) increases the density of the second-order rather than the first order laterals (Gruber et al., 2013). Second order LRBD might thereby be an important phene that may interact with the first order LRBD and deserves further investigation in future studies. The respiratory burden of the root system can be significant. In previous studies, we estimated that the total biomass of maize on low-nitrate or low-phosphorus soils may be reduced by as much as 40% due to root respiration, which competes with root growth for carbohydrates (Postma and Lynch, 2011a).
Root respiration is related to root length duration and root fineness. Root length is initially increased in the high-LRBD runs (Supplemental Appendix S2, Fig. S2), and thereby the root respiration is also increased. This is possible, as during early stages the plant has enough carbohydrates from seed reserves and photosynthesis while shoot growth is reduced. During later stages, reduced leaf area expansion and increased root-to-shoot ratios improve the phosphorus status of the plant, but the carbon status is reduced due to reduced light capture and increased root respiration. Simultaneously, the improved phosphorus status increases the relative allocation of carbohydrates to the shoot, reducing the availability of carbohydrates for root growth even more. Consequently, root growth rates are reduced in the high-LRBD runs during later stages of development (Supplemental Appendix S2, Fig. S2). Reduced root growth might reduce the phosphorus status of the plant if we would continue the simulations to later growth stages. If so, these fluctuations in root-to-shoot allocation would represent typical (dampening) oscillations in root-to-shoot ratios as seen in functional plant models and discussed by Postma et al. (2014). These oscillations are not numerical artifacts but a result of the slow and irreversible growth adjustments that plants make to a continuously changing environment. Growth adjustments not only have effects on the size of the root system, the respiratory costs, and thereby the carbon status of the plant but also on the spatial placement of roots.
Shallow rooting is an important strategy for phosphorus acquisition (Lynch and Brown, 2001; Zhu et al., 2005b). Greater LRBD caused the root system to be more shallow (Fig. 6); however, the changes in rooting depth were small and had little effect on phosphorus uptake, as we observed nearly identical results in soils with stratified or homogenous phosphorus distribution (data not shown). Likewise, root competition, which might increase with greater LRBD, had little effect on simulated phosphorus uptake. We determined the overlap of the phosphorus depletion zones at day 40 and found that the overlap in the low LBRD (4 roots cm−1) was 14% and that this number increased to 20% in the highest LRBD (20 roots cm−1; Supplemental Appendix S2, Fig. S3). Therefore, we can conclude that our results for the sensitivity of biomass production on low-phosphorus soils for the LRBD are mostly determined by the carbon budgets of the plant relative to the sink strength of the root system and the dynamics thereof. We conclude that greater LRBD is advantageous for phosphorus acquisition; however, LRBD greater than about 9 laterals cm−1 may have little effect on plant growth on low-phosphorus soils, as the plant does not have enough carbon to grow more root length (Figs. 2 and 4).
Our simulations did not include the effects of the mycorrhizal symbiosis on phosphorus acquisition. This is due to the lack of empirical data to support the functional-structural modeling of the spatiotemporal patterns of phosphorus transfer from the fungus to the plant symbiont. The inclusion of mycorrhizas would have complex effects on key components of the model, including carbon budgets, effective phosphorus depletion zones and therefore root competition, and differential mycorrhizal benefits for contrasting root classes and ages. To the extent that hyphal grazing by soil organisms reduces the effective zone of fungus-mediated phosphorus depletion around roots, the general effects of LRBD on the geometry of phosphorus acquisition and root competition should not change much. The greater carbon demand of mycorrhizal roots (Nielsen et al., 1998) may increase the relative importance of the carbon balance, however, as discussed above for elevated CO2 scenarios. Therefore, we predict that mycorrhizal plants would have a lower LRBD for optimal phosphorus acquisition than nonmycorrhizal plants. This is speculation that warrants additional investigation.
Nitrate
In contrast to phosphorus acquisition, nitrate acquisition and, consequently, growth on low-nitrate soils were greatest with fewer laterals per centimeter. The lower the nitrate availability, the lower the optimal LRBD was for nitrate acquisition (Figs. 2 and 3). As for the phosphorus scenarios, carbon availability played an important role in the results. The nitrogen status of the plant directly influences the photosynthetic productivity of the leaf area, and thereby nitrogen-deficient plants are more likely to have carbon-limited growth than are phosphorus-deficient plants. At the same time, the uptake efficiency of individual roots is much less for plants with greater LRBD (Fig. 7). This decrease in efficiency is partly explained by shallower rooting (Fig. 6) but mostly by increased root competition and reduced soil exploration when LRBD increases. In contrast to phosphorus depletion zones, nitrate depletion zones are much larger; therefore, root competition for nitrate occurs at much lower root densities. Intuitively, one might expect the uptake rate per unit of root surface area to decline more at greater LRBD; however, the results show a stronger decline at lower LRBD (Fig. 7). This is easiest understood from a geometrically simplified example in which we imagine an axial root with laterals depleting a single large cylindrical depletion zone in which most of the nitrate is depleted. The radius of this cylindrical depletion zone is determined by the length of the longest laterals, while the uptake per unit of root length would be approximated by the volume of the cylinder divided by the total root length. Assuming that, due to carbon limitations that occur more quickly in the nitrate-deficient plants due to the strong effects of nitrate deficiency on photosynthesis, the total root length of the laterals is constant with varying LRBD. If so, we can derive that each doubling of LRBD would reduce the individual length of the laterals by half and the depletion volume by a factor of 4. In other words, a doubling in LRBD would reduce the uptake by 75%. This example demonstrates that the expected shape of the curve is that of exponential decline when there is strong competition but will be constant if there is no competition. Figure 7 clearly shows an intermediate situation in which competition plays a stronger role for nitrate uptake and less of a role for phosphorus uptake.
If we combine the root length duration data, which increases asymptotically with increasing LRBD, with the average uptake per unit of root length duration, which declines exponentially, we get a total uptake that has an optimum at 2 to 7 branches cm−1. We conclude that our results for the nitrate scenarios are strongly determined by a lateral length-density tradeoff. Increased LRBD is advantageous for nitrate uptake only if it does not compete for carbohydrates with root elongation rates. If the carbon status of the plant improves, for example by having greater photosynthesis in elevated CO2, the model predicts that the optimal LRBD for nitrate uptake shifts to more branches per centimeter of root (Fig. 5). Long roots are important for exploring a large soil domain, while greater root density might increase the rate at which a soil domain is depleted but not the total nitrate uptake.
Root Plasticity
The optimum LRBD on low-nitrate soils depends on the nitrate availability, as the carbon status of the plant depends on the severity of the nitrogen deficiency. This suggests that plants may have a plasticity response to nitrate availability that would result in fewer but longer laterals on low-nitrate soils. These predicted plasticity responses correspond with observations in the literature from artificial systems (López-Bucio et al., 2003; Gruber et al., 2013; Rosas et al., 2013) but require field validation, as results from Arabidopsis in soilless media may not be representative. Experimental validation is challenging, as real plants seek homeostasis of all nutrients. We present a case in which the plant has to forage for both nitrate and phosphorus (Fig. 8). The results show that the optimal LRBD depends on the relative availability of nitrate and phosphorus (i.e. if the nitrate-to-phosphorus ratio increases, so does the optimal LRBD). In other words, there is a root architectural tradeoff for the acquisition of nitrate and phosphorus. In most soils, the relative availability of nitrate and phosphorus varies with depth; therefore, plants may have different optimal branching behavior in different soil domains. If we take this into account, however, the logic reverses. Soil domains with relatively high phosphorus concentrations can only be depleted by relatively densely placed laterals, while domains with relatively high nitrate may be depleted with fewer laterals. For example, the part of the primary root of maize that is in shallow and presumably phosphorus-rich soil may have many more laterals than the bottom part (Belford et al., 1987; Fig. 9; Supplemental Appendix S2, Fig. S4). In general, root length density is greater in the topsoil, which has the greatest availability of immobile nutrients, and is smaller in deeper strata, where mobile resources such as water and nitrate are generally more available. Similarly, localized placement of phosphorus or nitrate may trigger root proliferation in some species (Drew, 1975; Drew and Saker, 1978; Granato and Raper, 1989; Jing et al., 2012; Li et al., 2012; Ma et al., 2013). The proliferation response into patches, however, is modulated by the nutrient and carbon status of the plant (Bilbrough and Caldwell, 1995; He et al., 2003). We can conclude that root growth plasticity responses need to integrate two signals, one coming from the nutrient homeostasis of the plant and one coming from the local soil domain. This may be part of the reason why root plasticity data and phenotypic data in general are so difficult to interpret in a functional way (Robinson et al., 1999).
Figure 9.
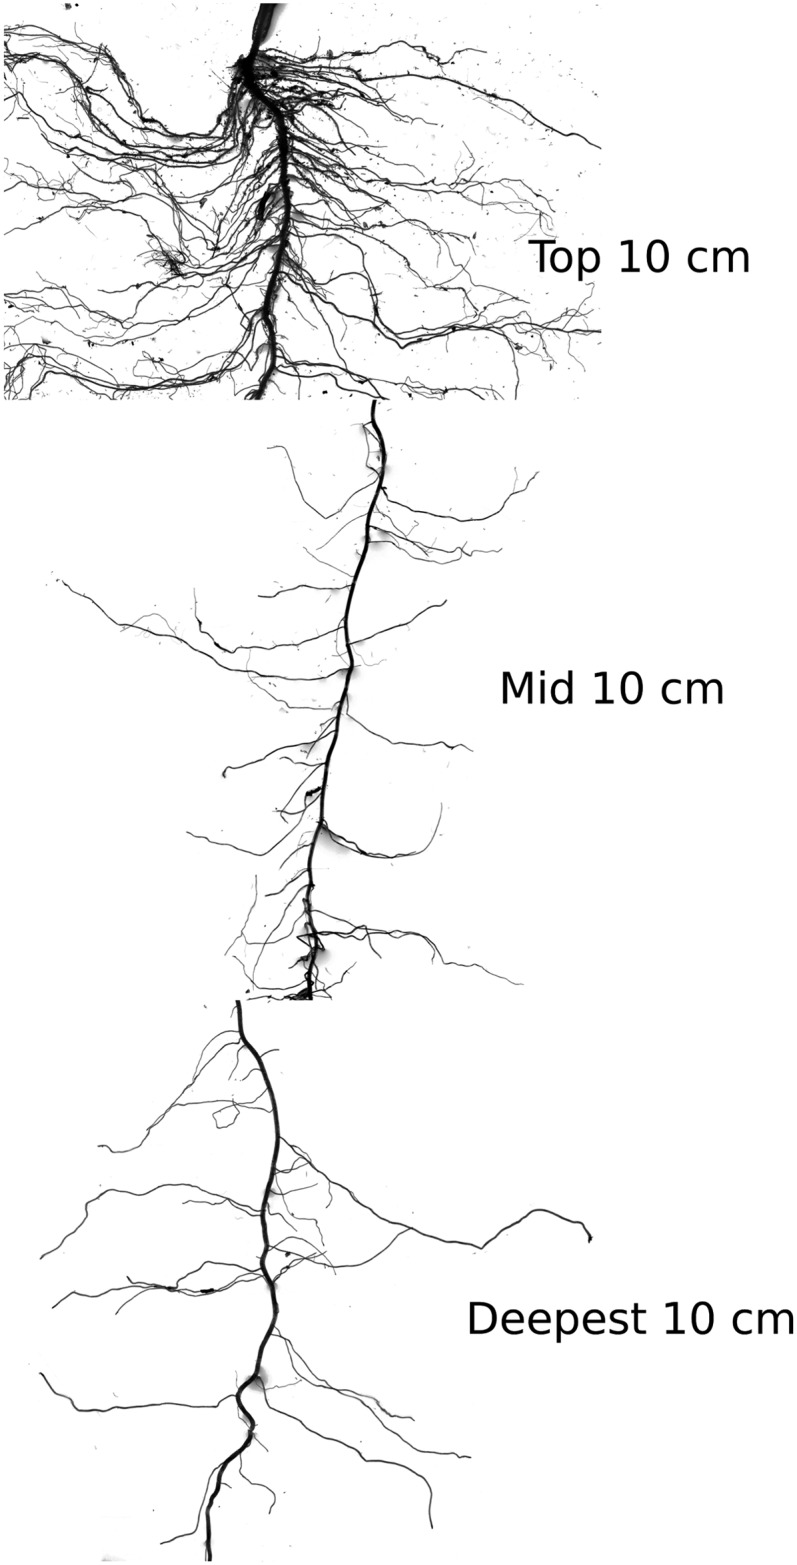
Image showing how LRBD may vary within a single root system. The image shows three root scans of 10-cm segments of a single primary root of a 28-d-old maize plant grown in a 20-L rhizotron box filled with a low-nutrient peat-basalt split mixture. The segments came from the basal part of the root (Top = 0–10 cm), the middle part (Mid = 40–50 cm), and the lowest part of the primary root that still carried laterals (Deepest = 80–90 cm). The scan shows the much larger branching frequency on top compared with the deeper segments. Differences in LRBD between the top and the rest of the primary root were highly significant based on 18 observations per location (three repetitions and six recombinant inbred lines from the same parents; for data, see Supplemental Appendix S2, Fig. S4).
Sensitivity Analyses
We ran several sensitivity analyses to determine if our results were sensitive to model parameters that were not the focus of this study. Specifically, we focused on nutrient mobility parameters, such as the mass flow component and the diffusion coefficients. However, although large changes in these parameters had effects on the total uptake, we found relatively small, but predictable, effects on LRBD. In general, greater mobility shifts the optimal LRBD down (Supplemental Appendix S3, Figs. S2 and S3). Increasing the kinetic parameters for nutrient uptake (Km and Vmax) increased total nutrient uptake, especially in the nitrate simulations with relatively high initial nitrate concentrations. However, Vmax and Km had little influence on the optimal LRBD (Supplemental Appendix S3, Fig. S4). We found that LRBD was sensitive to the carbon status of the plant. Greater light use efficiency increases the optimal LRBD on both low-nitrate and low-phosphorus soils (Fig. 5; Supplemental Appendix S3, Fig. S1). As expected, greater light use efficiency increased the root length of plants with greater LRBD and thereby increased the phosphorus uptake. These responses might be in agreement with the results of Poorter et al. (2012), who found in a meta-analysis that the root mass fraction tends to increase with greater daily irradiance, although no effect of elevated CO2 was found. Poorter et al. (2012), however, did not show absolute growth responses but changes in allocation patterns. In our simulations, increased root growth, due to better carbon status of the plant, feeds back into improved nutrient status of the plant and thereby increased shoot growth as well. The net effect of increased carbon fixation on the root mass fraction after 40 d of growth is thereby in some simulations negative while in others positive (data not shown). Several authors have reported that the LRBD increases with the increasing carbon status of the plant. Pritchard et al. (1999) list several publications that report positive correlations between elevated CO2 and LRBD, and Bingham and colleagues (Bingham and Stevenson, 1993; Bingham et al., 1998) report that feeding sugars to roots can increase LRBD. The simulations presented here provide a functional explanation for these plasticity responses, namely that the optimal LRBD for nutrient foraging shifts to greater lateral root densities when the carbon status of the plant improves. Our previous simulations have shown that root cortical aerenchyma (RCA) formation in the roots had greater benefit in plants with greater LRBD (Postma and Lynch, 2011a). All the simulations we presented thus far did not include the formation of RCA; however, when we do simulate RCA formation, we see that RCA increases biomass production on infertile soils, especially at greater LRBD (Supplemental Appendix S3, Fig. S5). Nevertheless, RCA does not greatly influence the optimal LRBD for nitrate and phosphorus acquisition.
Relevance to Other Soil Resources
Our results focus on nitrate and phosphate, two primary soil resources with sharply contrasting mobility. As discussed above, some differences in the effect of LRBD on the capture of nitrate versus phosphate were caused by the greater sensitivity of leaf photosynthesis to plant nitrogen status. However, a substantial portion of the difference in optimal LRBD for nitrate and phosphate capture is directly attributable to the relative mobility of these resources. In this context, we predict that the optimal LRBD for soil resource acquisition will be proportional to resource mobility; that is, the optimal LRBD for the acquisition of water and sulfate will be low, as shown here for nitrate (as proposed by Lynch [2013]), while the optimal LRBD for the acquisition of potassium, ammonium, iron, manganese, copper, and zinc will be high, as shown here for phosphate, and that the optimal LRBD for the acquisition of calcium and magnesium will be intermediate.
CONCLUSION
We used the functional structural plant model SimRoot to determine the optimal LRBD for maize. The optimal LRBD is lower for nitrate (less than 7 branches cm−1) and greater for phosphorus (greater than 9 branches cm−1). Interestingly, the median LRBD observed in several large field trials is 6 branches cm−1 (Table I). This may suggest that most genotypes balance the acquisition of both resources. Our results might provide an explanation for the large phenotypic variation observed, namely that genotypes with fewer branches are adapted to low-nitrate environments while genotypes with more branches are adapted to low-phosphorus environments. We attempted to predict possible plasticity responses in LRBD with respect to nitrate and phosphorus availability. However, whole-plant LRBD responses to nitrate and phosphorus availability and responses to local patches are not independent, as proliferation into a soil patch might have consequences for the optimal root-foraging strategy elsewhere in the root system. The effect of varying LRBD within a root system was not simulated in this study but could be a subject of future studies. The model predicted that the optimal LRBD is not only related to nutrient availability but also to the carbon status of the plant, and thereby to factors such as planting density, elevated atmospheric CO2, nonoptimal air temperature, etc. These results provide guidance for empirical validation of the utility of phenes and crop ideotypes for improved soil resource acquisition.
MATERIALS AND METHODS
We used SimRoot, a functional structural plant model that has successfully been used to simulate the growth of maize (Zea mays) under different environmental conditions (Lynch et al., 1997; Postma and Lynch, 2011a, 2011b, 2012; Dathe et al., 2012; Dunbabin et al., 2013). We describe SimRoot in more detail below, but in short, SimRoot dynamically simulates the architecture of the root system in three dimensions (Fig. 1; Supplemental Movie S1) and nutrient uptake by individual roots. Shoot growth is simulated nongeometrically but is represented by a canopy model simulating light capture and gas exchange. Total metabolic costs of root growth, respiration, nutrient uptake, and root exudation are explicitly accounted for. Imbalances between sink and source strength, and nutrient and carbon acquisition, are resolved using a set of empirically derived growth responses. The soil domain is simulated by a finite element model that contains nodal values for water content, nutrient content, and several soil properties. The finite element model solves the Richards equation for unsaturated water flow and the convection-dispersion equation for solute transport. Nutrient and water uptake by roots results in water flowing toward the roots and the development of nutrient depletion zones that may cause roots that are in close proximity to each other to compete for soil resources. Phosphorus depletion zones are small and require a high-resolution finite element mesh in order to solve. Phosphorus depletion zones, therefore, are simulated by the Barber-Cushman model, a radial one-dimensional model around each individual root segment. For comparison and discussion of these different methods of simulating nutrient transport in the soil and rhizosphere, see Postma and Lynch (2011a). All simulations simulated one individual plant growing in a row with between-row spacing of 60 cm and within-row spacing of 26 cm. The boundary conditions at the mid distance between plants were mirrored such that zero flux occurred across the boundary and roots were mirrored back in, in order to simulate a field-like root density distribution. Aboveground, canopy shading was calculated based on the simulated leaf area index.
Simulated Scenarios
Simulations conformed to two full factorial designs varying both LRBD and either phosphorus availability (assuming nitrate availability to be high) or nitrate availability (assuming phosphorus availability to be high). LRBD varied across eight levels (2, 4, 6, 8, 10, 12, 15, and 20 branches cm−1), phosphorus was varied across six levels (0.168, 0.336, 0.504, 0.672, 1.68, and 3.024 kg ha−1 in the liquid phase; buffer constant was 400), and nitrate was varied across six levels (7.8, 15.6, 26, 41.6, 104, and 208 kg ha−1). The phosphorus and nitrate levels were chosen such that they represented a range of stress levels, from severely reduced growth as might be found on highly weathered unfertilized soils to highly fertilized soils with no stress. We repeated the runs four times in order to show the variation caused by some stochastic elements in the model (see model description) across the LRBD. We reran these simulations, but with medium availability of nitrate or phosphorus, while varying the other nutrient across the mentioned levels. The primary data set presented here resulted from 2 × 8 × 12 × 4 = 768 simulations, in addition to sensitivity analyses.
Increased root competition with increasing LRBD is an important tradeoff of having more branches. In our previous work, we showed that root competition is especially important for nitrate uptake (Postma and Lynch, 2012). We used a 1- × 1- × 1-cm cubic finite element grid for simulating water and nitrate transport in the soil. The resolution of this grid is coarser than the branching frequencies of interest, which vary from 2 to 20 roots cm−1. This could mean that competition for nitrate may artificially increase if the resolution of the finite element grid is too coarse or that nitrate and water transport are numerically not solved correctly (Postma et al., 2008). Therefore, we ran our simulations with 0.6- and 2-cm cubic voxels to determine if the resolution of the finite element grid had any effect on the results and concluded that it did not (Supplemental Appendix S3, Fig. S5).
In order to test the robustness of our results and to understand the influence of different processes, we ran several other sensitivity analyses related to carbon fixation, metabolic cost of the root system, uptake kinetics, and soil mobility. We repeated the nitrate and phosphorus runs with 20% more or less carbon fixation. We repeated the simulation with the formation of RCA, which was assumed to decrease the metabolic cost of roots. Previous simulations have shown that the utility of RCA is greater in genotypes with greater LRBD (Postma and Lynch, 2011a). We also varied parameters that affect the mobility of the nutrients in the soil, as these parameters might affect root competition. The phosphorus diffusion coefficient was decreased and increased by a factor of 5, and the transpiration rate, which affects the mass flow of nitrate to the roots, was decreased and increased by a factor of 2. For the nitrate runs, we varied soil parameters, using parameterization for a high-leaching loamy sand, and we varied the plant transpiration rate in order to manipulate the mass-flow component.
Model Parameterization
SimRoot uses an extensive set of parameters for simulating maize growth on low-phosphorus and low-nitrogen soils. This parameter set, with references, was published previously (Postma and Lynch, 2011a, 2012). For this study, we used the previously published parameter set but varied the LRBD and the initial phosphorus and nitrogen availability by varying the initial concentrations and, in the case of nitrate, mineralization rates. Full parameterization is described in Supplemental Appendix S1. Our parameterization limits us to the first 6 weeks of vegetative growth, as few greenhouse studies provide data for longer periods, and processes like root loss that are currently not simulated become more important over time.
Several parameters in SimRoot are not single values but rather distributions. This causes some stochasticity in the root system and the model outputs. We simulated stochasticity in the lateral growth rate, such that not all laterals have the same length but the length of the laterals is log normally distributed, as described for field-grown maize by Pagès and Pellerin (1994). We also varied the growth direction stochastically using a uniform distribution. Stochasticity in the branching frequency, as employed for previous SimRoot studies, was purposely removed in this study, as branching frequency is the object of the study.
Model Description and Behavior
The programming of SimRoot has been described previously by Lynch et al. (1997) and Postma and Lynch (2011a, 2011b, 2012). SimRoot starts with the emergence of the primary root from the seed and the growth of the root system using a set of empirical rules (for rendering of the architecture, see Fig. 1; Supplemental Movie S1). These rules define (1) growth rates for specific root classes that are dependent on the age of the root tips, (2) the growth direction of the root tips based on soil impedance factors and gravitropic responses, and (3) a set of branching rules that determine the position and timing of the formation of new roots. While these rules are mostly predefined, the number of maize nodal roots is scaled allometrically as a means to integrate root and shoot resource allocation. The model uses predefined root growth rates, but only if sufficient carbon is available to sustain these root growth rates. If, on the other hand, root growth is source limited, the model will maintain the growth rate of the major root axes and reduce the growth rate of the lateral roots, in agreement with observations by Mollier and Pellerin (1999). Only when carbon availability reduces the growth rate of the lateral roots by more than 50% is the growth of the major axes reduced as well. Maintenance of the growth of the major root axes means that the total number of new first order lateral roots (LRBD × length of the major axes) is not affected by slight reductions in source capacity. Therefore, increased LRBD reduces the elongation rate of lateral roots when root growth is carbon limited.
When, and to what extent, the growth of the root system is limited by carbon depends on the carbon balance of the plant relative to the carbon that is needed for the potential growth rate of the root system. The model explicitly accounts for carbon costs, such as root respiration, root exudates, nutrient uptake, and growth. These carbon costs are balanced against the carbon that is available from seed reserves, photosynthesis, and a nonstructural carbon pool. This nonstructural carbon pool contains available carbon unused in previous time steps. Increasing LRBD will make the occurrence of carbon-limited growth more likely, as it effectively increases the number of growing tips and thereby the sink strength of the root system. Nutrient deficiency initially may reduce shoot growth and thereby increase carbon allocation to the root system, causing root growth more likely to be sink limited, similar to the findings by Wissuwa et al. (2005). But over time, as the root mass fraction increases and the nutrient deficiency not only decreases the leaf area expansion rate but also the photosynthetic efficiency of the leaf area, root growth may become increasingly limited by carbon availability. This means that in the model, plants experiencing mild phosphorus or nitrogen deficiency may have the same, or longer, root length than nondeficient plants, while severely deficient plants have reduced root length. The model behavior is in agreement with several reports in the literature and is further discussed by Postma and Lynch (2011b). During sink-limited growth, the model will store carbon in a nonstructural carbon pool, which can be depleted during later growth stages. This means that when growth is sink limited, increasing LRBD may reduce the nonstructural carbon pool and thereby reduce carbon availability and subsequent growth. This model behavior is relevant for understanding the carbon costs and simulated opportunity costs of LRBD (for discussion of opportunity costs, see Lynch, 2007b).
SimRoot not only simulates the growth of the plant in relation to the carbon economy but also simulates nutrient uptake by the root system and the effects of low nutrient availability on uptake and growth. Mass flow and diffusion of phosphorus in the rhizosphere around the root is simulated using the Barber-Cushman model (Itoh and Barber, 1983), while water flow (using the Richard equation) and nitrate movement (using the convection-dispersion equation) in the soil domain are simulated using SWMS_3D (Šimunek et al., 1995, Somma et al., 1998). Uptake of nitrate by the root system is based on Michaelis-Menten kinetics, just as in the Barber-Cushman model. The nitrate concentration at the root surface is a distance-weighted average of the nitrate concentration at neighboring finite element nodes, and uptake by the root nodes is distributed over the finite element nodes accordingly. Total nutrient acquisition is compared with the optimal and minimal nutrient requirements of the plant. Suboptimal nutrient concentrations in the plant tissue affect leaf area expansion and photosynthesis in a nutrient-specific manner (for details, see Postma and Lynch, 2011a, 2012). Individual root segments in the model may compete for the same soil resources when they are in proximity to each other. Competition for phosphorus may be less important than for nitrate (Postma and Lynch, 2012), as phosphorus depletion zones are usually less than 3 mm (Ge et al., 2000) while those for nitrate may be of several centimeters. Given that root length densities in maize average around 2 cm cm−3 (Anderson, 1988; Kuchenbuch et al., 2009), it is much more likely that roots compete for the same nitrate source than for the same phosphorus source. LRBD may increase competition for nutrients by placing lateral roots closer together. Root competition in the model is simply the result of the placement of roots and as such an implicit property of the simulation.
We simulated water uptake by the roots by dividing the transpiration of the shoot over the total root length equally, which is the same approach used by Somma et al. (1998). In relatively wet soils, this might be a reasonable approximation. Water uptake per se does not affect growth in our simulations; rather, it affects the mass flow of nutrients toward the roots. Mass flow may be especially important for nitrate uptake (Barber, 1995), as nitrate concentrations in the soil solution are much greater than phosphorus concentrations. Increasing root length, for example due to increasing LRBD, reduces the water uptake per unit of root length and thereby possibly reduces the nitrate uptake per unit of root length as well. Furthermore, dense clustering of roots when LRBD is high might actually cause local drying of soil, which, under natural conditions, would be compensated by water uptake elsewhere in the root system. Compensatory water uptake could thereby influence the mass flow of nitrate toward the roots. However, simulating the complexity of water uptake and transport in the roots using more mechanistic approaches, which was done by Doussan et al. (1998, 2006) and Javaux et al. (2008), is nontrivial. We implemented a semimechanistic approach in which compensatory water uptake could occur and used it to verify that the assumption of equal distribution of water uptake throughout the length of the root system is, for the conditions that we simulated, a reasonable approximation that does not affect the optimal LRBD (Supplemental Appendix S3, Fig. S6).
Statistics
All parameters in SimRoot can be defined as distributions instead of single values. We specified several parameters as distributions and repeated our primary runs four times in order to show the variation that is caused by the model’s random number generator. The random number generator was seeded with the computer clock at the start of the simulation and by the linux kernel-assigned process identifier in order to guarantee that the different simulations always received a different seed. We do not present any statistics or error bars on the variation of the output, as the interpretation of the variation is problematic and does not correspond to the usual interpretation of treatment contrasts. The presented variation is intended to convince the reader that the results are systematic and not an artifact of the random number generator.
Supplemental Data
The following materials are available in the online version of this article.
Supplemental Appendix S1. SimRoot parameterization.
Supplemental Appendix S2. Supplemental figures.
Supplemental Appendix S3. Additional sensitivity analysis.
Supplemental Movie S1. Rendering of two simulated maize root systems.
Supplementary Material
Glossary
- LRBD
lateral root branching density
Footnotes
This work was supported by Pennsylvania State University, the Forschungszentrum Jülich in the Helmholtz Association, and the European Union (European Plant Phenotyping Network FP7 Capacities Programme, grant no. 284443, and EUROOT FP7 Knowledge Based Bio-Economy, grant no. 289300).
Some figures in this article are displayed in color online but in black and white in the print edition.
The online version of this article contains Web-only data.
Articles can be viewed online without a subscription.
References
- Anderson E. (1988) Tillage and N fertilization effects on maize root growth and root:shoot ratio. Plant Soil 108: 245–251 [Google Scholar]
- Barber SA (1995) Soil Nutrient Bioavailability: A Mechanistic Approach. John Wiley & Sons, New York [Google Scholar]
- Belford RK, Klepper B, Rickman RW. (1987) Studies of intact shoot-root systems of field-grown winter wheat: II. Root and shoot developmental patterns as related to nitrogen fertilizer. Agron J 79: 310–319 [Google Scholar]
- Berntson GM. (1994) Modelling root architecture: are there tradeoffs between efficiency and potential of resource acquisition? New Phytol 127: 483–493 [Google Scholar]
- Bilbrough CJ, Caldwell MM. (1995) The effects of shading and N status on root proliferation in nutrient patches by the perennial grass Agropyron desertorum in the field. Oecologia 103: 10–16 [DOI] [PubMed] [Google Scholar]
- Bingham IJ, Blackwood JM, Stevenson EA. (1998) Relationship between tissue sugar content, phloem import and lateral root initiation in wheat. Physiol Plant 103: 107–113 [Google Scholar]
- Bingham IJ, Stevenson EA. (1993) Control of root growth: effects of carbohydrates on the extension, branching and rate of respiration of different fractions of wheat roots. Physiol Plant 88: 149–158 [Google Scholar]
- Borch K, Bouma TJ, Lynch JP, Brow KM. (1999) Ethylene: a regulator of root architectural responses to soil phosphorus availability. Plant Cell Environ 22: 425–431 [Google Scholar]
- Dathe A, Postma JA, Lynch JP (2012) Modeling resource interactions under multiple edaphic stresses. In LR Ahuja, VR Reddy, SA Saseendran, Q Yu, eds, Enhancing Understanding and Quantification of Soil-Root Interactions. ASA-CSSA-SSSA, Madison, WI, pp 273–294 [Google Scholar]
- Doussan C, Pagès L, Vercambre G. (1998) Modelling of the hydraulic architecture of root systems: an integrated approach to water absorption. Model description. Ann Bot (Lond) 81: 213–223 [Google Scholar]
- Doussan C, Pierret A, Garrigues E, Pagès L. (2006) Water uptake by plant roots. II. Modelling of water transfer in the soil root-system with explicit account of flow within the root system: comparison with experiments. Plant Soil 283: 99–117 [Google Scholar]
- Drew MC. (1975) Comparison of the effects of a localized supply of phosphate, nitrate, ammonium and potassium on the growth of the seminal root system, and the shoot, in barley. New Phytol 75: 479–490 [Google Scholar]
- Drew MC, Saker LR. (1978) Nutrient supply and the growth of the seminal root system in barley. III. Compensatory increases in growth of lateral roots, and in rates of phosphate uptake, in response to a localized supply of phosphate. J Exp Bot 29: 435–451 [Google Scholar]
- Dubrovsky JG, Gambetta GA, Hernández-Barrera A, Shishkova S, González I. (2006) Lateral root initiation in Arabidopsis: developmental window, spatial patterning, density and predictability. Ann Bot (Lond) 97: 903–915 [DOI] [PMC free article] [PubMed] [Google Scholar]
- Dunbabin VM, Postma JA, Schnepf A, Pagès L, Javaux M, Wu L, Leitner D, Chen YL, Rengel Z, Diggle AJ. (2013) Modelling root-soil interactions using three-dimensional models of root growth, architecture and function. Plant Soil 372: 93–124 [Google Scholar]
- Föhse D, Claassen N, Jungk A. (1991) Phosphorus efficiency of plants. Plant Soil 132: 261–272 [Google Scholar]
- Ge Z, Rubio G, Lynch JP. (2000) The importance of root gravitropism for inter-root competition and phosphorus acquisition efficiency: results from a geometric simulation model. Plant Soil 218: 159–171 [DOI] [PubMed] [Google Scholar]
- Granato TC, Raper CD., Jr (1989) Proliferation of maize (Zea mays L.) roots in response to localized supply of nitrate. J Exp Bot 40: 263–275 [DOI] [PubMed] [Google Scholar]
- Gruber BD, Giehl RFH, Friedel S, von Wirén N. (2013) Plasticity of the Arabidopsis root system under nutrient deficiencies. Plant Physiol 163: 161–179 [DOI] [PMC free article] [PubMed] [Google Scholar]
- Hammond JP, Broadley MR, White PJ, King GJ, Bowen HC, Hayden R, Meacham MC, Mead A, Overs T, Spracklen WP, et al. (2009) Shoot yield drives phosphorus use efficiency in Brassica oleracea and correlates with root architecture traits. J Exp Bot 60: 1953–1968 [DOI] [PubMed] [Google Scholar]
- He Y, Liao H, Yan X. (2003) Localized supply of phosphorus induces root morphological and architectural changes of rice in split and stratified soil cultures. Plant Soil 248: 247–256 [Google Scholar]
- Hodge A. (2004) The plastic plant: root responses to heterogeneous supplies of nutrients. New Phytol 162: 9–24 [Google Scholar]
- Itoh S, Barber SA. (1983) A numerical solution of whole plant nutrient uptake for soil-root systems with root hairs. Plant Soil 70: 403–413 [Google Scholar]
- Javaux M, Schroder T, Vanderborght J, Vereecken H. (2008) Use of a three-dimensional detailed modeling approach for predicting root water uptake. Vadose Zone J 7: 1079–1088 [Google Scholar]
- Jing J, Zhang F, Rengel Z, Shen J. (2012) Localized fertilization with P plus N elicits an ammonium-dependent enhancement of maize root growth and nutrient uptake. Field Crops Res 133: 176–185 [Google Scholar]
- Jordan MO, Harada J, Bruchou C, Yamazaki K. (1993) Maize nodal root ramification: absence of dormant primordia, root classification using histological parameters and consequences on sap conduction. Plant Soil 153: 125–143 [Google Scholar]
- Kuchenbuch R, Gerke H, Buczko U. (2009) Spatial distribution of maize roots by complete 3D soil monolith sampling. Plant Soil 315: 297–314 [Google Scholar]
- Lavenus J, Goh T, Roberts I, Guyomarc’h S, Lucas M, De Smet I, Fukaki H, Beeckman T, Bennett M, Laplaze L. (2013) Lateral root development in Arabidopsis: fifty shades of auxin. Trends Plant Sci 18: 450–458 [DOI] [PubMed] [Google Scholar]
- Li HB, Zhang FS, Shen JB. (2012) Contribution of root proliferation in nutrient-rich soil patches to nutrient uptake and growth of maize. Pedosphere 22: 776–784 [Google Scholar]
- López-Bucio J, Cruz-Ramírez A, Herrera-Estrella L. (2003) The role of nutrient availability in regulating root architecture. Curr Opin Plant Biol 6: 280–287 [DOI] [PubMed] [Google Scholar]
- Lynch JP. (2007a) Rhizoeconomics: the roots of shoot growth limitations. HortScience 42: 1107–1109 [Google Scholar]
- Lynch JP. (2007b) Roots of the second green revolution. Aust J Bot 55: 493–512 [Google Scholar]
- Lynch JP. (2011) Root phenes for enhanced soil exploration and phosphorus acquisition: tools for future crops. Plant Physiol 156: 1041–1049 [DOI] [PMC free article] [PubMed] [Google Scholar]
- Lynch JP. (2013) Steep, cheap and deep: an ideotype to optimize water and N acquisition by maize root systems. Ann Bot (Lond) 112: 347–357 [DOI] [PMC free article] [PubMed] [Google Scholar]
- Lynch JP, Brown KM. (2001) Topsoil foraging: an architectural adaptation of plants to low phosphorus availability. Plant Soil 237: 225–237 [Google Scholar]
- Lynch JP, Lauchli A, Epstein E. (1991) Vegetative growth of the common bean in response to phosphorus nutrition. Crop Sci 31: 380–387 [Google Scholar]
- Lynch JP, Nielsen KL, Davis RD, Jablokow AG. (1997) SimRoot: modelling and visualization of root systems. Plant Soil 188: 139–151 [Google Scholar]
- Ma Q, Zhang F, Rengel Z, Shen J. (2013) Localized application of NH4+-N plus P at the seedling and later growth stages enhances nutrient uptake and maize yield by inducing lateral root proliferation. Plant Soil 372: 65–80 [Google Scholar]
- Malamy JE, Benfey PN. (1997) Organization and cell differentiation in lateral roots of Arabidopsis thaliana. Development 124: 33–44 [DOI] [PubMed] [Google Scholar]
- Mollier A, Pellerin S. (1999) Maize root system growth and development as influenced by phosphorus deficiency. J Exp Bot 50: 487–497 [Google Scholar]
- Nielsen KL, Bouma TJ, Lynch JP, Eissenstat DM. (1998) Effects of phosphorus availability and vesicular-arbuscular mycorrhizas on the carbon budget of common bean (Phaseolus vulgaris). New Phytol 139: 647–656 [Google Scholar]
- Osmont KS, Sibout R, Hardtke CS. (2007) Hidden branches: developments in root system architecture. Annu Rev Plant Biol 58: 93–113 [DOI] [PubMed] [Google Scholar]
- Pagès L, Pellerin S. (1994) Evaluation of parameters describing the root system architecture of field grown maize plants (Zea mays L.). Plant Soil 164: 169–176 [Google Scholar]
- Péret B, Larrieu A, Bennett MJ. (2009) Lateral root emergence: a difficult birth. J Exp Bot 60: 3637–3643 [DOI] [PubMed] [Google Scholar]
- Ploshchinskaia ME, Ivanov VB, Salmin SA, Bystrova EI. (2002) [Analysis of possible mechanisms of regulation of root branching] (in Russian). Zh Obshch Biol 63: 68–74 [PubMed] [Google Scholar]
- Poorter H, Niklas KJ, Reich PB, Oleksyn J, Poot P, Mommer L. (2012) Biomass allocation to leaves, stems and roots: meta-analyses of interspecific variation and environmental control. New Phytol 193: 30–50 [DOI] [PubMed] [Google Scholar]
- Postma JA, Jaramillo RE, Lynch JP (2008) Towards modeling the function of root traits for enhancing water acquisition by crops. In LR Ahuja, VR Reddy, SA Saseendran, Q Yu, eds, Response of Crops to Limited Water: Understanding and Modeling Water Stress Effects on Plant Growth Processes. ASA-CSSA-SSSA, Madison, WI, pp 251–276 [Google Scholar]
- Postma JA, Lynch JP. (2011a) Root cortical aerenchyma enhances the growth of maize on soils with suboptimal availability of nitrogen, phosphorus, and potassium. Plant Physiol 156: 1190–1201 [DOI] [PMC free article] [PubMed] [Google Scholar]
- Postma JA, Lynch JP. (2011b) Theoretical evidence for the functional benefit of root cortical aerenchyma in soils with low phosphorus availability. Ann Bot (Lond) 107: 829–841 [DOI] [PMC free article] [PubMed] [Google Scholar]
- Postma JA, Lynch JP. (2012) Complementarity in root architecture for nutrient uptake in ancient maize/bean and maize/bean/squash polycultures. Ann Bot (Lond) 110: 521–534 [DOI] [PMC free article] [PubMed] [Google Scholar]
- Postma JA, Schurr U, Fiorani F. (2014) Dynamic root growth and architecture responses to limiting nutrient availability: linking physiological models and experimentation. Biotechnol Adv 32: 53–65 [DOI] [PubMed] [Google Scholar]
- Pritchard SG, Rogers HH, Prior SA, Peterson CM. (1999) Elevated CO2 and plant structure: a review. Glob Change Biol 5: 807–837 [Google Scholar]
- Robinson D, Hodge A, Griffiths BS, Fitter AH. (1999) Plant root proliferation in nitrogen-rich patches confers competitive advantage. Proc R Soc Lond B Biol Sci 266: 431–435 [Google Scholar]
- Rosas U, Cibrian-Jaramillo A, Ristova D, Banta JA, Gifford ML, Fan AH, Zhou RW, Kim GJ, Krouk G, Birnbaum KD, et al. (2013) Integration of responses within and across Arabidopsis natural accessions uncovers loci controlling root systems architecture. Proc Natl Acad Sci USA 110: 15133–15138 [DOI] [PMC free article] [PubMed] [Google Scholar]
- Silberbush M, Barber S. (1983) Sensitivity of simulated phosphorus uptake to parameters used by a mechanistic-mathematical model. Plant Soil 74: 93–100 [Google Scholar]
- Šimunek J, Huang K, van Genuchten MT (1995) The SWMS 3D Code for Simulating Water Flow and Solute Transport in Three-Dimensional Variably-Saturated Media. US Salinity Laboratory, US Department of Agriculture, Riverside, CA [Google Scholar]
- Somma F, Hopmans JW, Clausnitzer V. (1998) Transient three-dimensional modeling of soil water and solute transport with simultaneous root growth, root water and nutrient uptake. Plant Soil 202: 281–293 [Google Scholar]
- Trachsel S, Kaeppler SM, Brown KM, Lynch JP. (2010) Shovelomics: high throughput phenotyping of maize (Zea mays L.) root architecture in the field. Plant Soil 341: 75–87 [Google Scholar]
- Usuda H, Shimogawara K. (1991) Phosphate deficiency in maize. I. Leaf phosphate status, growth, photosynthesis and carbon partitioning. Plant Cell Physiol 32: 497–504 [Google Scholar]
- Wilberts S, Suter M, Walser N, Edwards PJ, Olde Venterink H, Ramseier D (July 6, 2013) Testing experimentally the effect of soil resource mobility on plant competition. J Plant Ecol 10.1093/jpe/rtt029 [Google Scholar]
- Wissuwa M. (2003) How do plants achieve tolerance to phosphorus deficiency? Small causes with big effects. Plant Physiol 133: 1947–1958 [DOI] [PMC free article] [PubMed] [Google Scholar]
- Wissuwa M, Gamat G, Ismail AM. (2005) Is root growth under phosphorus deficiency affected by source or sink limitations? J Exp Bot 56: 1943–1950 [DOI] [PubMed] [Google Scholar]
- Zhu J, Kaeppler SM, Lynch JP. (2005a) Mapping of QTL controlling root hair length in maize (Zea mays L.) under phosphorus deficiency. Plant Soil 270: 299–310 [Google Scholar]
- Zhu J, Kaeppler SM, Lynch JP. (2005b) Topsoil foraging and phosphorus acquisition efficiency in maize (Zea mays). Funct Plant Biol 32: 749–762 [DOI] [PubMed] [Google Scholar]
- Zhu JM, Lynch JP. (2004) The contribution of lateral rooting to phosphorus acquisition efficiency in maize (Zea mays) seedlings. Funct Plant Biol 31: 949–958 [DOI] [PubMed] [Google Scholar]
- Zobel RW, Waisel Y. (2010) A plant root system architectural taxonomy: A framework for root nomenclature. Plant Biosystems 144: 507–512 [Google Scholar]
Associated Data
This section collects any data citations, data availability statements, or supplementary materials included in this article.