Article first published online 2 September 2014.
Key Words: perfusion, CEUS, Crohn's disease, quantification, ultrasound
Abstract
Background:
To improve management of patients with Crohn's disease (CD), objective measurements of the degree of local inflammation in the gastrointestinal wall are needed. Increased microvessel density and perfusion are typical features of acute inflammation and can be estimated with contrast-enhanced ultrasound (CEUS). The aim of the study was to investigate whether CEUS can provide prognostic information about patients treated medically for an acute exacerbation of CD.
Methods:
Fourteen patients with CD who received medical treatment for acute exacerbation with systemic steroids or tumor necrosis factor–α inhibitors were prospectively recruited. The patients were examined with clinical scoring, blood tests, and CEUS at time 0, 1, 3, and 12 months after initiation of the treatment. Outcome was treatment efficacy or treatment failure defined as change in medical treatment after 1 month or later. The perfusion analysis was performed with a commercially available software program that analyzes the contrast intensity in a selected area, fits the data to a standardized time-intensity curve, and derives several relative perfusion parameters.
Results:
Six of the 14 patients had treatment failure during the study period. There was a significant difference between the groups for peak contrast enhancement (P = 0.013), rate of wash-in (P = 0.020) and wash-out (P = 0.008), and the area under the time-intensity curve in the wash-in phase (0.013) at the examination 1 month after the start of treatment.
Conclusions:
Perfusion analysis of the intestinal wall with CEUS 1 month after starting treatment in patients with CD can provide prognostic information regarding treatment efficacy.
Commonly, acute exacerbation of Crohn's disease (CD) is treated with systemic steroids or tumor necrosis factor–α (TNF-α) inhibitors.1 Currently, there are no optimal methods for assessing the efficacy of a treatment regime. In daily clinical practice, gastrointestinal (GI) endoscopy is normally used to evaluate disease activity in the GI-tract, but most of the small bowel, subepithelial structures, or extraintestinal complications cannot be visualized with this technique. There are also other limitations with endoscopy, such as risk of perforation, difficulties to pass stenosis, and patient discomfort. Therefore, cross-sectional imaging modalities such as computed tomography, ultrasonography (US), and magnetic resonance imaging (MRI) have become increasingly important.2 Ultrasonography seems to perform equally well as both computed tomography and MRI, e.g., in detection of disease and complications as well as in mapping extent and disease activity.3,4 Ultrasonography is more operator- and patient-friendly than other imaging methods because new machines are small, portable, relatively inexpensive, and noninvasive and is thus suitable for bed-side examination.5 Consequently, it is a modality well suited for the repeated examinations needed when evaluating treatment effect.
Contrast-enhanced ultrasound (CEUS) can be used for estimation of bowel wall perfusion.6–8 This is important because neovascularization in the GI wall is a histological finding in active CD related to the degree of inflammation. Also, the autoregulation of the blood supply in the bowel wall is dysfunctional in these patients.9–11
There seems to be a correlation between the enhancement from the ultrasound contrast agent, microvessel density,12 and the histological degree of inflammation.13 Several authors have also shown that there is a relationship between contrast enhancement and disease activity in CD both for CEUS and MRI.4,14–16 Analyzing the degree of enhancement from ultrasound contrast agents, however, require strict standardization and is thus impractical in daily clinical work. Dynamic contrast-enhanced ultrasound (DCE-US) or analysis of the time evolvement of contrast enhancement may be more robust because it is more closely related to the perfusion parameters. Although several studies show that relative perfusion parameters derived from DCE-US are related to disease activity and can separate inflammation and fibrosis,7,17–20 few studies have implemented this method in longitudinal studies of treatment outcome.
Already in 2002 using the ultrasound contrast agent Levovist, Di Sabatino et al21 found that in a subset of patients with quiescent disease and contrast enhancement, the disease relapsed after 6 months. Recently 2 prospective longitudinal studies were published using endoscopy as reference standard. Moreno et al22 examined patients before treatment and after 1 year with CEUS and found that bowel wall thickness predicted endoscopic remission better than contrast enhancement. Ordas et al23 examined patients before treatment and after 3 months using an MRI score including contrast enhancement and found a good correlation with endoscopy and an accuracy of 83% for predicting mucosal healing. These studies focus on contrast enhancement not perfusion, but in a recent study by Quaia et al,24 they found a difference in relative perfusion 3 months after initiation of treatment between treatment responders and nonresponders. This was a cross-sectional study, however, not including data from the start of the treatment or data on bowel wall thickness, which previously has been shown to be related to treatment outcome.25,26
The aim of this pilot study was to evaluate whether perfusion parameters derived from DCE-US of affected bowel with commercially available software can be used for monitoring disease activity in patients with CD. As a secondary aim, we wanted to examine when the most appropriate time to perform the follow-up examination was.
MATERIALS AND METHODS
The study was a prospective pilot study with 12-month follow-up performed in a single center.
Patients
Twenty patients with acute exacerbation of CD, scheduled for treatment with systemic steroids, adalimumab, or infliximab were prospectively recruited from the outpatient clinic or the bedward at the Section of Gastroenterology at Haukeland University Hospital. Inclusion criteria were acute exacerbation of CD with Crohn's disease activity index (CDAI) >150 requiring medical treatment with either systemic steroids or anti-TNF's, such as infliximab or adalimumab. Exclusion criteria were normal transabdominal ultrasound, abscess, perforation, or stenosis requiring surgery during the first month of follow-up, pregnancy, age <18 years, acute coronary or pulmonary failure, or allergy against the medical treatment or the ultrasound contrast agent. The patients were recruited from 2009 to 2012. The study was observational and decision-to-treat or change treatment was made by a physician without knowledge of the CEUS findings. Each patient underwent clinical scoring as well as blood and stool sampling at the start of the study and 1, 3, and 12 months into the follow-up period. Ileocolonoscopy was performed before study start to confirm disease status.
Clinical and Biochemical Tests
Patient history, demographic data, and current treatment regime were collected through patient interviews and/or access to medical records. Each patient was scored according to the Montreal classification.27 CDAI was registered before the ultrasound examination. Blood and stool samples were collected within 1 week after the ultrasound examination. Hemoglobin (g/dL), leukocyte count (109/L), platelet count (109/L), C-reactive protein (mg/L), and Albumin (mg/L) were measured in the blood, whereas the stool was analyzed for calprotectin (μg/mg).
Ultrasound Examination
Ultrasound was performed with a Logiq E9 ultrasound scanner (GE Healthcare, Milwaukee, WI), using a convex probe (C1-5, 1–6 MHz) for abdominal overview, a linear probe (ML6-15, 9–15 MHz) for detailed examination of the intestinal wall and a linear transducer (9L, 5.5–9 MHz) for the CEUS examination. All segments of the small and large bowel were examined. A small and large bowel wall thickness >2 mm was considered pathological if the bowel lumen diameter was >0.5 cm and >3 mm if the lumen diameter was <0.5 cm or collapsed. The length of the affected bowel wall, the bowel wall thickness, and the thickness of the individual ultrasound layers were measured as previously described.28,29 The ultrasound layers correspond closely to the mucosa, submucosa, and proper muscle of the GI wall.30 The thickest wall section was chosen for further examination.
DCE-US was performed using Sonovue (Bracco, Milan, Italy) and the contrast mode on the ultrasound scanner. In contrast mode, we used the general setting with color map 2.0, dynamic range 60, MI between 0.09 and 0.12, gain adjusted to reduce background tissue signal, and focus just behind the affected bowel wall. Two contrast injections were performed. First, the right iliac artery was examined and acted as a reference. The ultrasound probe was positioned over the right iliac artery so that it could be seen at approximately the same depth as the affected bowel and then 0.4 mL of Sonovue was injected over 2 seconds followed by a flush of 10 mL of saline over 4 seconds. For the second injection, 4.4 mL of Sonovue and 10 mL of saline with the same time intervals was given with the imaging plane in the longitudinal direction of the affected anterior bowel wall. This was done 5 to 10 minutes after the first bolus when no contrast signal could be seen in the affected bowel wall. A 60-second cine loop was recorded and exported as Digital Imaging and Communications in Medicine (DICOM) for further analysis.
Quantitative CEUS Analysis
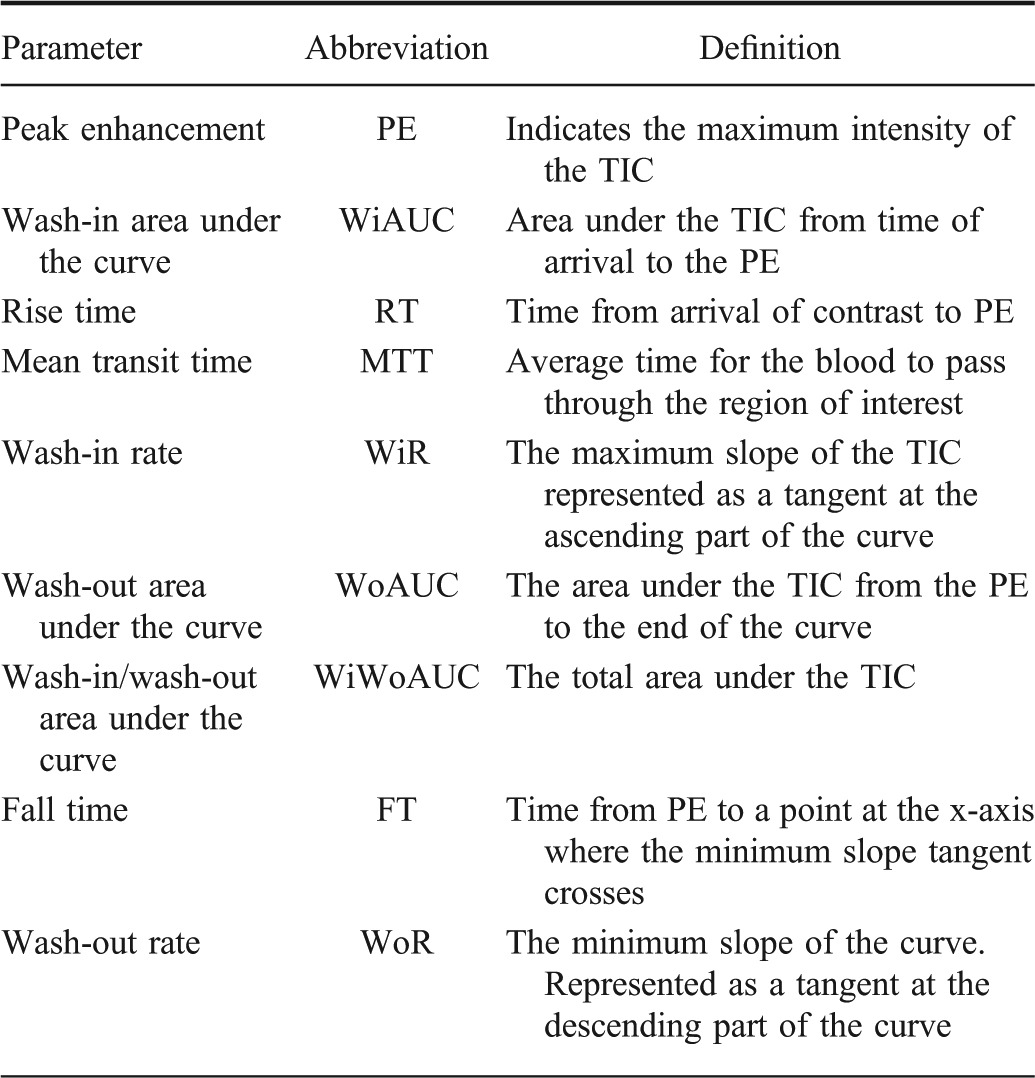
The analysis of the DICOM contrast recordings was performed with dedicated, commercially available software for perfusion analysis (Vuebox; Bracco Suisse SA, Geneva, Switzerland). Vuebox is a quantification software, which evaluates the CEUS data, based on signal intensity changes over time.8 The software converts the exported DICOM video data to linear intensity units using conversion algorithms specific for each probe, color map, and dynamic range.31 The reconstructed echo-power data are directly proportional to the concentration of the microbubbles within the dose range used,32 and as a function of time, these time-intensity signals are fitted to a standardized curve, from which several parameters can be derived (Fig. 1). Vuebox provides parameters related to signal amplitude, time, and a combination of amplitude and time (Table 1) by using wash-in/wash-out kinetics. Because of a proportional relationship between the perfusion parameters derived from Vuebox and regional blood flow, quantitative measurements are possible. The parameters are expressed in arbitrary units, providing perfusion parameters relative to the actual perfusion.8 Thus, the clinician is only able to assess whether an area of interest is hyper-, hypo-, or isoperfused in relation to the surrounding tissue. By normalizing the affected area to an internal reference such as the right iliac artery, perfusion parameters from different examinations can be compared.
FIGURE 1.
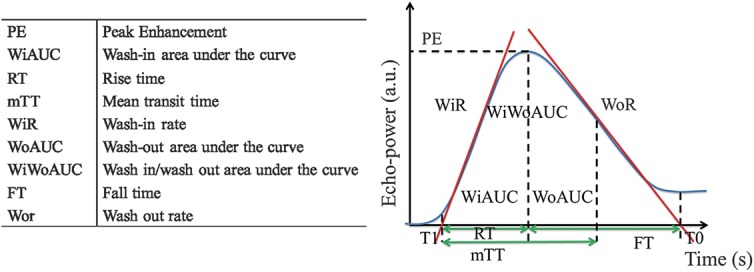
Different quantitative perfusion parameters derived from Vuebox. The parameters with their abbreviations are enlisted in the left panel, whereas the figure in the right panel shows how they are derived from the time-intensity curve (the figure is based on a corresponding figure in the Vuebox instruction manual).
TABLE 1.
Different Quantitative Perfusion Parameters with Corresponding Definitions, Derived from the Modeled Time-intensity Curve (TIC) in Vuebox
The workflow in the software consists of uploading the DICOM file, choosing the relevant probe calibration, deleting off plane frames, and choosing an area of interest that is automatically motion corrected. Then the examiner draws a region of interest and marks the time of contrast arrival before the software analyses the time-intensity data (Fig. 2).8 The resulting amplitude-related parameters from the examined bowel wall were exported in an excel sheet and normalized by dividing the perfusion parameters expressed in arbitrary units with the corresponding parameters from the right iliac artery. The time-related parameters are independent of contrast concentration making normalization unnecessary.
FIGURE 2.
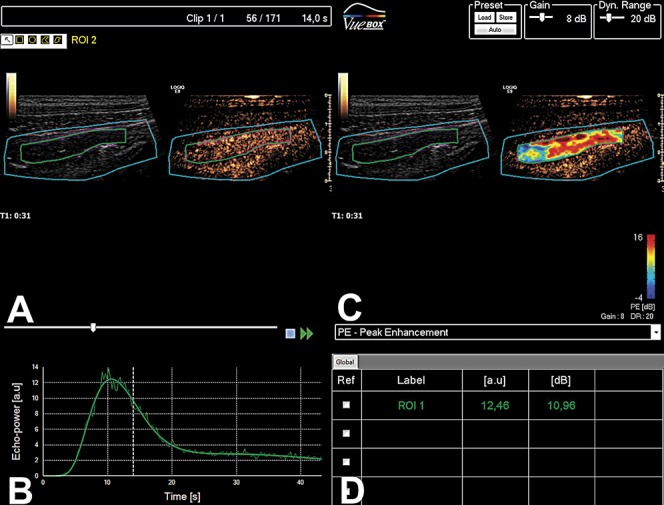
CEUS of the intestine in a patient with CD. A, the ultrasound image is presented as B-mode to the left and in a contrast mode to the right. B, Enhancement with Sonovue linearized to arbitrary units together with the modeled time-intensity curve. C, Ultrasound-image with B-mode to the left and a parametric color map covering the contrast image to the right. D, Table displays the quantitative data obtained from the analysis.
Outcomes
The endpoints were clinical remission or treatment failure during the follow-up period. Clinical remission was defined as CDAI <150 after 12 months of treatment start. Treatment failure was defined as a change in the drug regime >1 month after treatment start from systemic steroids to anti-TNF or from one anti-TNF to another during the follow-up period. Effective treatment was defined as continued use of same anti-TNF or discontinuation of systemic steroids during the study period. If a patient had to change treatment due to drug's side effects, this was not considered a treatment failure. Treatment change was done by a clinician unaware of the perfusion measurements.
Statistics
The data were analyzed using descriptive statistics and presented with median, minimum, and maximum values. Further comparison of continuous data between the groups was performed using the Student's t test or the Mann–Whitney U test. The level of significance was P < 0.05. The data analysis was performed using IBM SPSS Statistics software (version 20 for Windows; IBM Inc., Armonk, NY).
Ethical Considerations
The study was approved by the Regional Ethical Committee for Medical and Health Research in Western Norway (REK). Each patient signed informed consent before participating in the study.
RESULTS
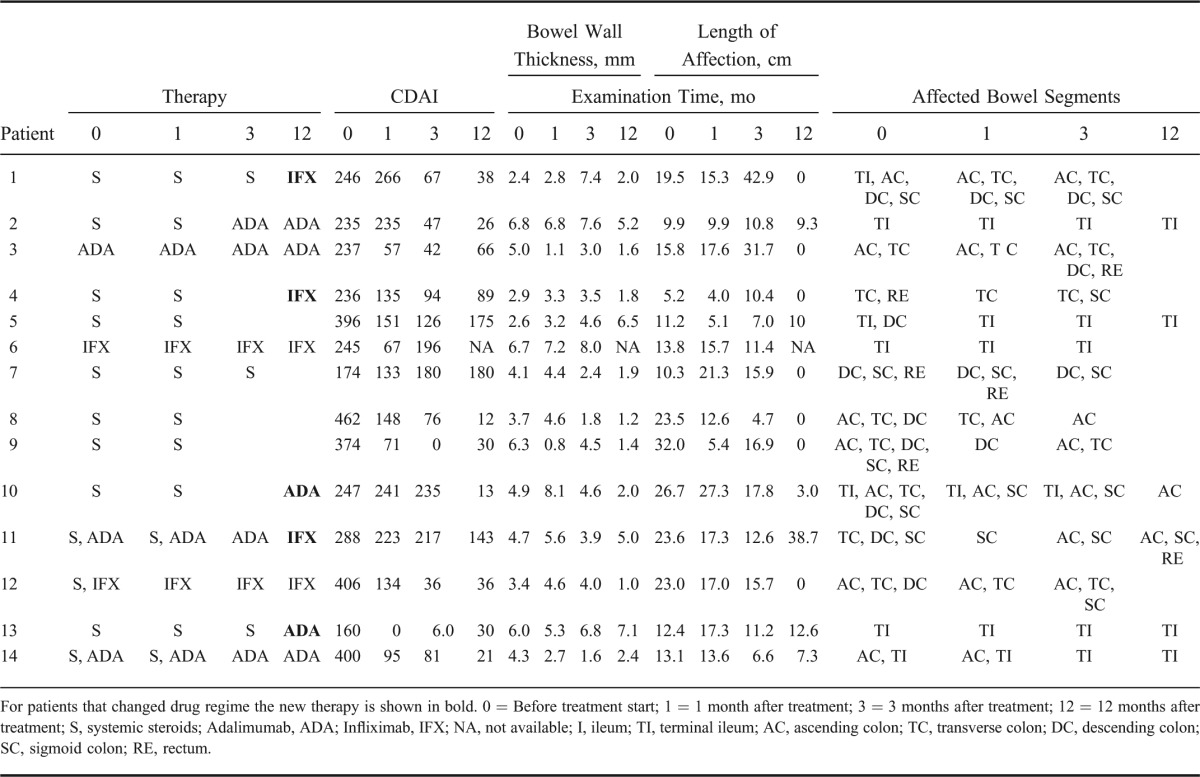
During the study period, 2 patients withdrew from the study, 1 was lost to follow-up, 1 was diagnosed with bowel perforation within 1 month after inclusion, 1 required acute surgery due to bowel obstruction during the first month, and in 1 case, the contrast data were incomplete and could not be analyzed. The remaining 14 patients were 5 women and 9 men with a median age of 33 years (range, 20–50 yr). The Montreal classification for each patient is shown in Table 2. At 12 months, 11 patients were in clinical remission, 2 had still active disease and 1 had surgical resection of the affected area. The treatment failed in 6 of 14 patients during the study period. Because 11 of 14 patients were in remission at the end of the study, a statistical comparison was not done between the groups. In Table 3, an overview of the therapy, clinical, and sonographic features for each patient at each time point in the study is shown.
TABLE 2.
Montreal Classification, Gender, and Outcome for Each Patient with CD Examined in the Study
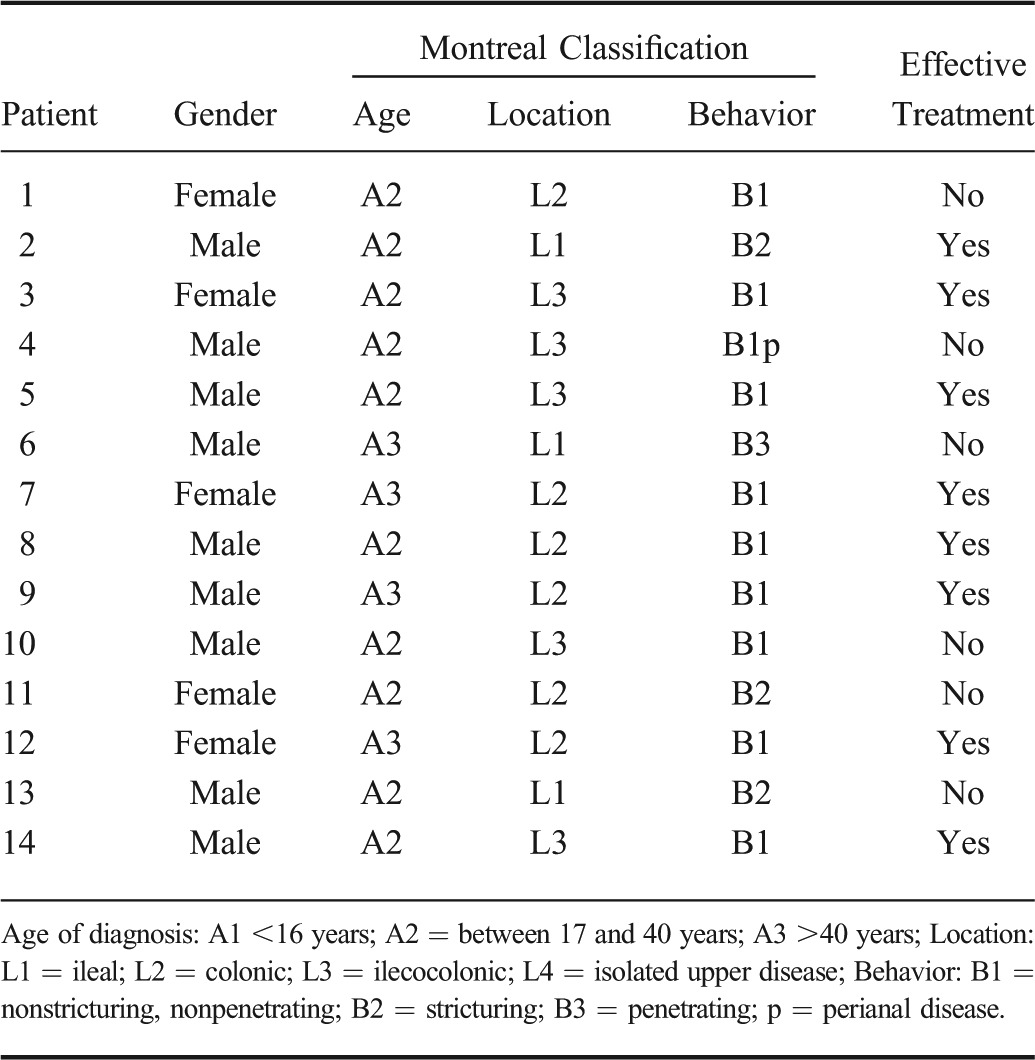
TABLE 3.
Therapy, Clinical, and Sonographic Features for Each Patient with CD at Each Time Point in the Study
There were no significant differences between the effective treatment group and treatment failure group, in the demographical, biochemical, and clinical data for any of the time points during the study. In Table 4, these data are shown for the examination done at the start of the study. Also, there were no significant differences for the ultrasound measurements of the bowel wall thickness and the length of the affected bowel. However, there were significant differences in the bowel wall layers. The proper muscle layer was significantly thicker after 1 month and, the submucosa layer was significantly thicker after 3 months in the group with ineffective treatment (Fig. 3).
TABLE 4.
Demographical, Biochemical, and Clinical Data of Patients with CD Measured at the Initiation of the Treatment
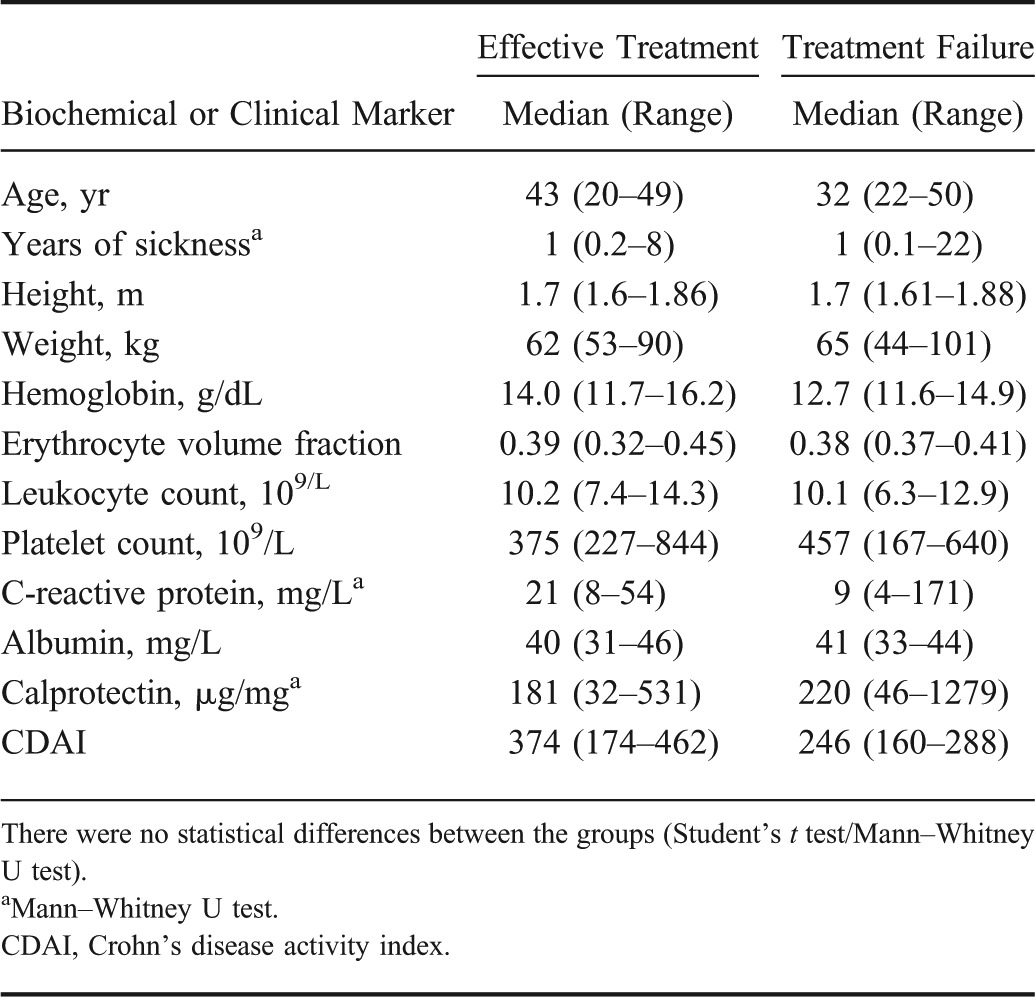
FIGURE 3.
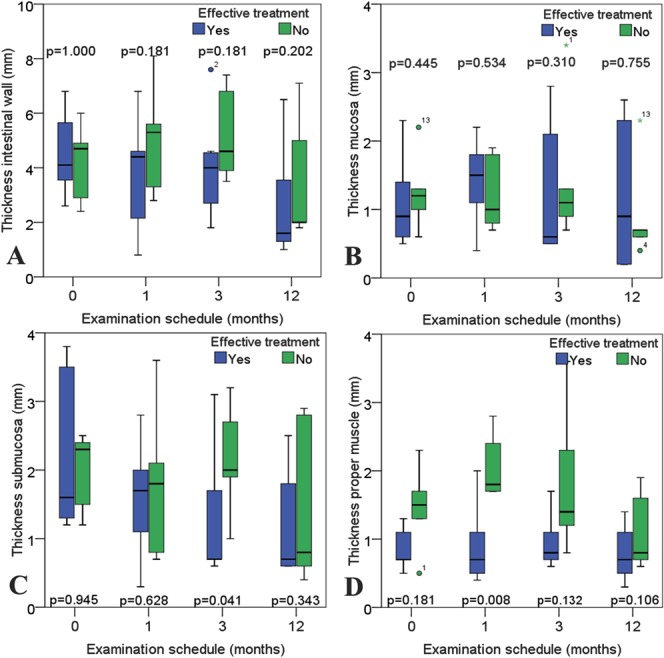
Thickness of the intestinal wall and wall layers during follow-up examinations. The box plots colored in green represents the patients with treatment failure, whereas patients with effective treatment are represented in box plots colored in blue. A, Displays the bowel wall. B–D, Presents the thickness of the wall layers mucosa, submucosa, and proper muscle, respectively.
Finally, there were no significant differences in perfusion parameters at time 0 and at 3 and 12 months. However, 1 month after the initiation of the treatment, there was a significant difference between the 2 groups for the amplitude-based parameters' peak enhancement (P = 0.013), wash-in area under the curve (P = 0.013), wash-in rate (P = 0.020), and wash-out rate (P = 0.008) (Fig. 4). The results for the 2 remaining amplitude-based parameters' wash-out area under the curve (P = 0.142) and wash-in/wash-out area under the curve (P = 0.059) were not significant. There was no significant difference at any point in the time-related variables (Fig. 5) between the groups.
FIGURE 4.
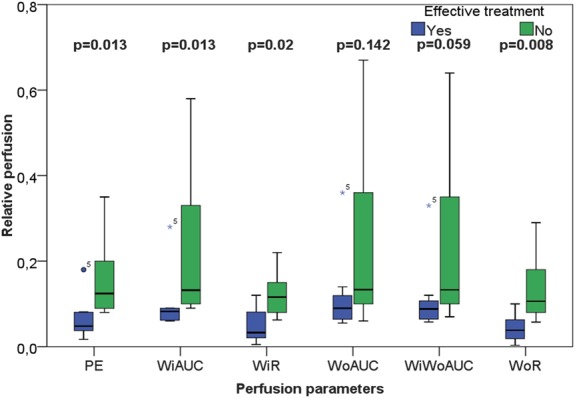
Box-plot representation of the contrast analysis related to signal intensities in patients with active CD 1 month after initiating medical treatment. Group 1 (blue boxes) responded well to the treatment, whereas group 2 (green boxes) had treatment failure. The figure displays significant differences (Mann–Whitney U test) between the groups for the perfusion parameters peak enhancement, wash-in area under the curve, wash-in rate and wash-out rate.
FIGURE 5.
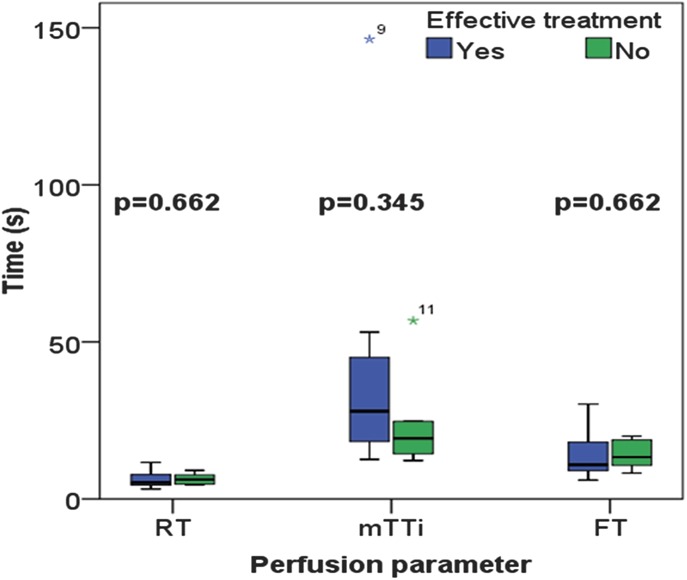
Box-plot representation of the results from the time-related variables such as rise time, fall time, and mean transit time in patients with active CD 1 month after initiating medical treatment. Group 1 (blue boxes) responded well to the treatment, whereas group 2 (green boxes) had treatment failure. There were no significant differences between the groups (Mann–Whitney U test).
DISCUSSION
We found that patients with treatment failure after acute exacerbation of CD had increased relative perfusion and a thickened proper muscle layer compared with those with effective treatment 1 month after the start of treatment. The examination at this time was performed before any change in therapy and could thus predict the treatment outcome. To our knowledge, this principal finding with an early (1 mo) evaluation of treatment effect has not been presented earlier, although Quaia et al24 found a significant difference between responders and nonresponders 3 months after the start of treatment during a follow-up study.
Our study indicates that patients who have an early therapeutic effect have lower local perfusion, which might separate them from patients with poor or no effect. Thus, perfusion evaluated with CEUS may be helpful in follow-up and treatment of patients with CD. Current research implies that angiogenesis correlate with disease activity.9,33 Consequently, quantitative assessments of contrast-enhanced ultrasonograhic sequences seem to provide a deeper understanding of the pathophysiology in IBD.
It has previously been shown that contrast enhancement with CEUS corresponds well with endoscopy34 and CDAI14 and can predict disease relapse in CD.35 The degree of contrast enhancement is however dependent on several other confounding factors, such as contrast method and equipment used, depth of lesion and shadowing from air, or arteries filled with contrast.6 This can partly be solved by scaling the data, but although it relates to microvessel density, it does not describe the dynamic element of perfusion since the transit of blood through the tissue is not recorded. DCE-US includes time-intensity data and could thus tell us more of the pathophysiology.
Quaia et al used a scaled time-intensity analysis and found that there was a significant difference in the area under the curve between treatment responders (fall in CDAI ≥70 points) and nonresponders after 3 months. The study cannot be directly compared with ours due to a different outcome, but the results do partly correspond. There was, however, no difference in peak enhancement, and data on enhancement rate were not shown. This study was performed on video data that are a log-compressed version of the actual ultrasound intensities, which is mathematically incorrect.36 In our study, the linear data were reconstructed from the video, which may be the reason why we found a significant difference for the peak enhancement and wash-in and wash-out rates.
We found that some amplitude-related perfusion parameters 1 month after treatment start were not significantly different, but there seems to be a group effect. As a limited amount of patients were included, it is possible that the nonsignificant results are due to type 2 errors. Regarding the perfusion parameter wash-out area under the curve, it is possible that this was not significantly different between the groups because of another aspect of the study design. In our study, all CEUS recordings lasted 60 seconds, which could be too short for evaluating wash-out of contrast agents. When assessing wash-in/wash-out area under the curve, a similar argument could be used because the parameter is influenced by the wash-out area under the curve (Table 1). Longer time recordings may consequently be necessary in future studies.
The time-related perfusion parameters (rise time, fall time, and mean transit time) were not significantly different. This could be due to possible weaknesses in the study design or in the perfusion modeling. When injecting an intravenous bolus and analyzing contrast intensity over time, the bolus profile is dependent in the arterial input function (AIF). The AIF, however, is dependent on injection speed, distance from injection site to observed area, and interindividual differences in the blood vessel system and blood volume. The bolus injection was manual, but standardized. A mechanical injection using an automated pump could reduce the variability in bolus administration, but cannot correct the patient-specific variability. Recently, Jirik et al37 provided a new pharmacokinetic model combining bolus injection and burst replenishment, which could overcome this problem by providing an AIF estimate.
When comparing the thickness of the bowel wall between those with effective and ineffective primary treatment, a significant difference between the groups was expected. In our pilot study, we could not reveal such a difference (Fig. 3). It is reasonable to assume this is also due to a type 2 error. When analyzing the individual bowel wall layers, however, there was a significant difference between thickness of the proper muscle layer after 1 month and in the submucosa layer after 3 months. In CD, thickening of the proper muscle layer is associated with patients with fibrosis in the GI wall,7 whereas thickening of the submucosa layer is associated with inflammation.7,38 With closer examination of the box plots in Figure 3, one could suspect that the proper muscle layer is thicker in the treatment failure group also before the treatment, although this result is not significant. If these patients already have developed a degree of fibrosis in the GI wall, this may explain why they are less responsive to treatment.
One might argue that measuring the thickness of the proper muscle layer is simpler than estimating perfusion and that this parameter alone seems promising for predicting treatment outcome. Although inflammation is necessary to trigger the process of fibrosis, it seems that it is not necessary for perpetuating it. In fact, once started, the fibrotic process can run without ongoing inflammation.39 It would therefore be reasonable to use markers of both inflammation and fibrosis when evaluating treatment effect in patients. Increased perfusion could indicate ongoing inflammation, whereas thickening of the proper muscle layer could indicate worsening fibrosis.
The major limitation of the study is the small number of included patients. Although the examiner was masked to the patient endpoints, the contrast analysis was performed by the same examiner in all cases. Interobserver agreement should be determined in future studies. Furthermore, all analyses were performed using the same quantification software. In future work, comparison of different perfusion modalities could contribute to increase the reliability of the results. The interindividual differences according to blood flow could not be standardized, which might have influenced the result. Consequently, a study including more patients is required, and future studies should also compare the results according to other outcomes, such as resection, endoscopic remission, and clinical remission.
In conclusion, CEUS enables high-resolution perfusion analysis of the intestinal wall. One month after starting treatment in patients with CD, prognostic information regarding treatment response can be obtained by ultrasound scanning of the bowel.
ACKNOWLEDGMENTS
The authors thank Bracco for providing the quantification software (Vuebox) used in the study.
Footnotes
Supported by Medviz (www.medviz.uib.no), a research cluster of groups at Haukeland University Hospital, University of Bergen and Christian Michelsen Research.
K. Nylund and Odd Helge Gilja have received honoraria from Abbvie. The remaining authors have no conflicts of interest to disclose.
REFERENCES
- 1.Odze R. Diagnostic problems and advances in inflammatory bowel disease. Mod Pathol. 2003;16:347–358 [DOI] [PubMed] [Google Scholar]
- 2.Goetz M, Neurath MF. Imaging techniques in inflammatory bowel disease: recent trends, questions and answers. Gastroenterol Clin Biol. 2009;33(suppl 3):S174–S182 [DOI] [PubMed] [Google Scholar]
- 3.Horsthuis K, Bipat S, Bennink RJ, et al. Inflammatory bowel disease diagnosed with US, MR, scintigraphy, and CT: meta-analysis of prospective studies. Radiology. 2008;247:64–79 [DOI] [PubMed] [Google Scholar]
- 4.Panes J, Bouzas R, Chaparro M, et al. Systematic review: the use of ultrasonography, computed tomography and magnetic resonance imaging for the diagnosis, assessment of activity and abdominal complications of Crohn's disease. Aliment Pharmacol Ther. 2011;34:125–145 [DOI] [PubMed] [Google Scholar]
- 5.Nylund K, Hausken T, Gilja OH. Ultrasound and inflammatory bowel disease. Ultrasound Q. 2010;26:3–15 [DOI] [PubMed] [Google Scholar]
- 6.Dietrich CF, Averkiou MA, Correas JM, et al. An EFSUMB introduction into Dynamic Contrast-Enhanced Ultrasound (DCE-US) for quantification of tumour perfusion. Ultraschall Med. 2012;33:344–351 [DOI] [PubMed] [Google Scholar]
- 7.Nylund K, Jirik R, Mezl M, et al. Quantitative contrast-enhanced ultrasound comparison between inflammatory and fibrotic lesions in patients with Crohn's disease. Ultrasound Med Biol. 2013;39:1197–1206 [DOI] [PubMed] [Google Scholar]
- 8.Tranquart F, Mercier L, Frinking P, et al. Perfusion quantification in contrast-enhanced ultrasound (CEUS)–ready for research projects and routine clinical use. Ultraschall Med. 2012;33(suppl 1):S31–S38 [DOI] [PubMed] [Google Scholar]
- 9.Danese S, Sans M, de la MC, et al. Angiogenesis as a novel component of inflammatory bowel disease pathogenesis. Gastroenterology. 2006;130:2060–2073 [DOI] [PubMed] [Google Scholar]
- 10.Konerding MA, Turhan A, Ravnic DJ, et al. Inflammation-induced intussusceptive angiogenesis in murine colitis. Anat Rec (Hoboken). 2010;293:849–857 [DOI] [PMC free article] [PubMed] [Google Scholar]
- 11.Hatoum OA, Binion DG, Otterson MF, et al. Acquired microvascular dysfunction in inflammatory bowel disease: loss of nitric oxide-mediated vasodilation. Gastroenterology. 2003;125:58–69 [DOI] [PubMed] [Google Scholar]
- 12.Wang Z, Tang J, An L, et al. Contrast-enhanced ultrasonography for assessment of tumor vascularity in hepatocellular carcinoma. J Ultrasound Med. 2007;26:757–762 [DOI] [PubMed] [Google Scholar]
- 13.Ripolles T, Rausell N, Paredes JM, et al. Effectiveness of contrast-enhanced ultrasound for characterisation of intestinal inflammation in Crohn's disease: a comparison with surgical histopathology analysis. J Crohns Colitis. 2013;7:120–128 [DOI] [PubMed] [Google Scholar]
- 14.Migaleddu V, Scanu AM, Quaia E, et al. Contrast-enhanced ultrasonographic evaluation of inflammatory activity in Crohn's disease. Gastroenterology. 2009;137:43–52 [DOI] [PubMed] [Google Scholar]
- 15.Rimola J, Rodriguez S, Garcia-Bosch O, et al. Magnetic resonance for assessment of disease activity and severity in ileocolonic Crohn's disease. Gut. 2009;58:1113–1120 [DOI] [PubMed] [Google Scholar]
- 16.Serra C, Menozzi G, Labate AM, et al. Ultrasound assessment of vascularization of the thickened terminal ileum wall in Crohn's disease patients using a low-mechanical index real-time scanning technique with a second generation ultrasound contrast agent. Eur J Radiol. 2007;62:114–121 [DOI] [PubMed] [Google Scholar]
- 17.Girlich C, Jung EM, Huber E, et al. Comparison between preoperative quantitative assessment of bowel wall vascularization by contrast-enhanced ultrasound and operative macroscopic findings and results of histopathological scoring in Crohn's disease. Ultraschall Med. 2011;32:154–159 [DOI] [PubMed] [Google Scholar]
- 18.Girlich C, Schacherer D, Jung EM, et al. Comparison between a clinical activity index (Harvey-Bradshaw-Index), laboratory inflammation markers and quantitative assessment of bowel wall vascularization by contrast-enhanced ultrasound in Crohn's disease. Eur J Radiol. 2012;81:1105–1109 [DOI] [PubMed] [Google Scholar]
- 19.Rottgen R, Grandke T, Grieser C, et al. Measurement of MRI enhancement kinetics for evaluation of inflammatory activity in Crohn's disease. Clin Imaging. 2010;34:29–35 [DOI] [PubMed] [Google Scholar]
- 20.Oto A, Kayhan A, Williams JT, et al. Active Crohn's disease in the small bowel: evaluation by diffusion weighted imaging and quantitative dynamic contrast enhanced MR imaging. J Magn Reson Imaging. 2011;33:615–624 [DOI] [PubMed] [Google Scholar]
- 21.Di Sabatino A, Fulle I, Ciccocioppo R, et al. Doppler enhancement after intravenous levovist injection in Crohn's disease. Inflamm Bowel Dis. 2002;8:251–257 [DOI] [PubMed] [Google Scholar]
- 22.Moreno N, Ripolles T, Paredes JM, et al. Usefulness of abdominal ultrasonography in the analysis of endoscopic activity in patients with Crohn's disease: changes following treatment with immunomodulators and/or anti-TNF antibodies. J Crohns Colitis. 2014;8:1079–1087 [DOI] [PubMed] [Google Scholar]
- 23.Ordas I, Rimola J, Rodriguez S, et al. Accuracy of magnetic resonance enterography in assessing response to therapy and mucosal healing in patients with Crohn's disease. Gastroenterology. 2014;146:374–382 [DOI] [PubMed] [Google Scholar]
- 24.Quaia E, Cabibbo B, De PL, et al. The value of time-intensity curves obtained after microbubble contrast agent injection to discriminate responders from non-responders to anti-inflammatory medication among patients with Crohn's disease. Eur Radiol. 2013;23:1650–1659 [DOI] [PubMed] [Google Scholar]
- 25.Castiglione F, de Sio I, Cozzolino A, et al. Bowel wall thickness at abdominal ultrasound and the one-year-risk of surgery in patients with Crohn's disease. Am J Gastroenterol. 2004;99:1977–1983 [DOI] [PubMed] [Google Scholar]
- 26.Rispo A, Bucci L, Pesce G, et al. Bowel sonography for the diagnosis and grading of postsurgical recurrence of Crohn's disease. Inflamm Bowel Dis. 2006;12:486–490 [DOI] [PubMed] [Google Scholar]
- 27.Satsangi J, Silverberg MS, Vermeire S, et al. The Montreal classification of inflammatory bowel disease: controversies, consensus, and implications. Gut. 2006;55:749–753 [DOI] [PMC free article] [PubMed] [Google Scholar]
- 28.Nylund K, Hausken T, Odegaard S, et al. Gastrointestinal wall thickness measured with transabdominal ultrasonography and its relationship to demographic factors in healthy subjects. Ultraschall Med. 2012;33:E225–E232 [DOI] [PubMed] [Google Scholar]
- 29.Odegaard S, Nesje LB, Laerum OD, et al. High-frequency ultrasonographic imaging of the gastrointestinal wall. Expert Rev Med Devices. 2012;9:263–273 [DOI] [PubMed] [Google Scholar]
- 30.Kimmey MB, Martin RW, Haggitt RC, et al. Histologic correlates of gastrointestinal ultrasound images. Gastroenterology. 1989;96:433–441 [DOI] [PubMed] [Google Scholar]
- 31.Rognin NG, Frinking P, Costa M, et al. In-vivo perfusion quantification by contrast ultrasound: Validation of the use of linearized video data vs. raw RF data. Ultrasonics Symposium, 2008. IUS 2008. IEEE. 2008:1690–1693
- 32.Lampaskis M, Averkiou M. Investigation of the relationship of nonlinear backscattered ultrasound intensity with microbubble concentration at low MI. Ultrasound Med Biol. 2010;36:306–312 [DOI] [PubMed] [Google Scholar]
- 33.Linares PM, Chaparro M, Gisbert JP. Angiopoietins in inflammation and their implication in the development of inflammatory bowel disease. A review. J Crohns Colitis. 2014;8:183–190 [DOI] [PubMed] [Google Scholar]
- 34.Ripolles T, Martinez MJ, Paredes JM, et al. Crohn disease: correlation of findings at contrast-enhanced US with severity at endoscopy. Radiology. 2009;253:241–248 [DOI] [PubMed] [Google Scholar]
- 35.Paredes JM, Ripolles T, Cortes X, et al. Contrast-enhanced ultrasonography: usefulness in the assessment of postoperative recurrence of Crohn's disease. J Crohns Colitis. 2013;7:192–201 [DOI] [PubMed] [Google Scholar]
- 36.Peronneau P, Lassau N, Leguerney I, et al. Contrast ultrasonography: necessity of linear data processing for the quantification of tumor vascularization. Ultraschall Med. 2010;31:370–378 [DOI] [PubMed] [Google Scholar]
- 37.Jirik R, Nylund K, Gilja O, et al. Ultrasound perfusion analysis combining bolus-tracking and burst-replenishment. IEEE Trans Ultrason Ferroelectr Freq Control. 2013;60:310–319 [DOI] [PubMed] [Google Scholar]
- 38.Ellrichmann M, Wietzke-Braun P, Dhar S, et al. Endoscopic ultrasound of the colon for the differentiation of Crohn's disease and ulcerative colitis in comparison with healthy controls. Aliment Pharmacol Ther. 2014;39:823–833 [DOI] [PubMed] [Google Scholar]
- 39.Latella G, Rogler G, Bamias G, et al. Results of the 4th scientific workshop of the ECCO (I): pathophysiology of intestinal fibrosis in IBD. J Crohns Colitis. 2014;8:1147–1165 [DOI] [PubMed] [Google Scholar]


