Abstract
Identifying clinically relevant subtypes of a cancer using gene expression data is a challenging and important problem in medicine, and is a necessary premise to provide specific and efficient treatments for patients of different subtypes. Matrix factorization provides a solution by finding checker-board patterns in the matrices of gene expression data. In the context of gene expression profiles of cancer patients, these checkerboard patterns correspond to genes that are up- or down-regulated in patients with particular cancer subtypes. Recently, a new matrix factorization framework for biclustering called Maximum Block Improvement (MBI) is proposed; however, it still suffers several problems when applied to cancer gene expression data analysis. In this study, we developed many effective strategies to improve MBI and designed a new program called enhanced MBI (eMBI), which is more effective and efficient to identify cancer subtypes. Our tests on several gene expression profiling datasets of cancer patients consistently indicate that eMBI achieves significant improvements in comparison with MBI, in terms of cancer subtype prediction accuracy, robustness, and running time. In addition, the performance of eMBI is much better than another widely used matrix factorization method called nonnegative matrix factorization (NMF) and the method of hierarchical clustering, which is often the first choice of clinical analysts in practice.
Keywords: matrix factorization, biclustering, microarray analysis, cancer classification, iterative method, consensus clustering
Introduction
Microarray and RNA-seq technologies produce huge amount of gene expression datasets from which we could discover meaningful information for biological processes and many diseases. Gene expression data can be arranged in a matrix whose rows correspond to genes and columns correspond to different conditions (eg, different patients in the context of gene expression profiling of cancer patients). The values in this kind of matrix could represent either normalized gene expression levels (such as Affymetrix GeneChips) or relative gene expression ratios (such as cDNA microarrays).1
Various methods have been developed for clustering genes or conditions that show similar expression patterns.2–5 Traditional clustering technologies only focus on one dimension, and partition either genes (Fig. 1A) or conditions (Fig. 1B) into different groups based on their similarities. Although useful, traditional clustering methods have limitations compared with biclustering methods in their ability to discover similarity of subgroups based on subsets of attributes. Cheng and Church6 first introduced the concept of biclustering, which extends the traditional clustering technologies by simultaneously clustering both genes and conditions (Fig. 1C and D). Thus, some coexpressed genes under some conditions, corresponding to the sub-matrices of the raw matrix (called biclusters), are possible to be identified. Later, many biclustering methods have been developed, such as BIMAX,7 FABIA,8 ISA,9 QUBIC,10 and SAMBA,11 just to name a few.
Figure 1.

Shuffled matrices obtained from different clustering methods, including (A) gene clustering, (B) condition clustering, (C) biclustering that generates overlapping biclusters, and (D) biclustering that reports checkerboard structure.
For the current molecular study of different cancers with large amount of datasets from different platforms, one critical computational challenge is to conduct unsupervised clustering analysis. Especially, gene expression clustering is a key step in performing a cancer molecular study such as cancer class discovery, class prediction, molecular subtyping, and identification of gene expression-based prognostic signatures. Every molecular subtyping study, eg, the study of different cancer subtype of the effort of The Cancer Genome Atlas (TCGA), involves application of a specifically selected clustering approach. Identifying clinically relevant subtypes of a cancer based on gene expression data has many important applications in medicine, and is a necessary premise to provide specific and efficient treatments for patients of different subtypes.12–15 However, most of the existing biclustering methods do not work well in predicting those subtypes from a cancer data because of the following reasons: (i) these methods often iteratively search for the biclusters one by one, and different biclusters may have overlaps (Fig. 1C), which results in an unreasonable fact that one patient could be classified into two different subtypes. (ii) Even though their reported clusters are non-overlapping (some methods have a specific parameter for this requirement), the methods still do not work well because they focus on finding local optimal clusters, instead of finding a global partition of columns. Thus, they usually report an unmeaningful classification such that some patients are not classified into any group.
Matrix factorization provides a solution for this outstanding problem by finding checkerboard patterns in the matrices of gene expression data (Fig. 1D). In cancer gene expression data analysis, these checkerboards correspond to genes that are obviously up- or down-regulated in patients with particular subtypes of tumors. Recently, a new matrix factorization framework for biclustering called maximum block improvement (MBI)16 is proposed, but several problems exist and hinder its practical application in the cancer context.
In this study, we proposed an enhanced MBI (eMBI) method, which is more suitable to the problem of detecting different subtypes of cancer. Test results on several cancer datasets consistently indicate that eMBI has significant improvements in comparison with MBI, in terms of subtype prediction accuracy, robustness, and running time. eMBI is also demonstrated to have significantly better prediction accuracy than hierarchical clustering (HC) and another matrix factorization method called nonnegative matrix factorization (NMF),17 and has important additional abilities, such as identifying potential marker genes.
Methods
We first revisit the framework of MBI and point out the problems that would affect its performance and hinder its practical application, particularly in the context of identifying subtypes of a cancer. Then, we propose solutions to each of those problems and verify their effectiveness on a benchmark dataset. Finally, we give an eMBI method, which is designed specifically for cancer subtype prediction.
Framework of MBI
The MBI method is proposed as a generic algorithm using the concept of tensor in the original paper.16 The MBI method is based on a tensor optimization model. Consider the following formulation for the co-clustering problem for a given tensor dataset :
is a row assignment matrix, j = 1, 2,…, d
where f is a given proximity measure. In Ref. 16, the MBI method is proposed to solve the above model (CC), with encouraging numerical results. The MBI approach can be applied to cocluster gene expression data in 2D matrices (genes versus samples) as well as data in high-dimensional tensor form.
MBI Method Described in Terms of a Matrix
Let A be a matrix with m rows and n columns, where each row corresponds to one gene and each column represents one patient (Fig. 2A). Suppose the optimal biclustering of the matrix could give a checkerboard structure of A such that the rows are partitioned into k1 groups and the columns are divided into k2 groups. Of course, these partitions are unknown before biclustering, but here we assume that they are already known.
Figure 2.
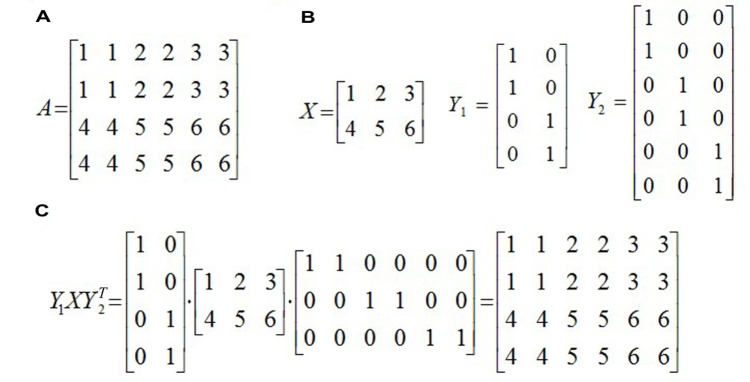
An example of MBI, (A) the raw matrix A, (B) three matrices defined in MBI, and (C) Y1XY2T, a matrix factorization of A.
We first define a k1 × k2 matrix X, the (i, j) entry of X is the centroid of the (i, j)th bicluster, that is, the average of all the numbers in the (i, j)th sub-matrix of A. Take the example in Figure 2 as an example, k1 = 2, k2 = 3, and X is a 2 × 3 matrix as shown in Figure 2b. Intuitively, X is obtained by shrinking each block in the checkerboard structure of A to an entry of X.
Next, an m × k1 0–1 matrix Y1, called an assignment matrix, is defined. Each row of the matrix corresponds to one gene. If the gene belongs to the ith group of genes, then the ith element of this row is 1 and others are set to be 0. Note that each row only has one 1, showing the group to which this gene should be assigned. Hence, the matrix Y1 is named as an assignment matrix. In the example of Figure 2, Y1 is a 4 × 2 matrix, and the first row of Y1 is (1, 0), which indicates that the first gene belongs to the first group of genes. Similarly, an assignment matrix Y2 with size n × k2 is defined for the columns (patients).
Based on the three matrices defined above, we could get a matrix factorization of A, that is, Y1XY2′ (Fig. 2c), where Y2′ (sometimes denoted by Y2T) is the transpose of Y2. Actually, Y1XY2′ may not be exactly equal to A, but it would be a good approximation to A by minimizing the objective function ||A − Y1XY2′||F, or equivalently maximizing −||A − Y1XY2′||F. Once we get Y1 and Y2, we would easily know how to partition genes and patients, and hence all the biclusters (sub-matrices) of the matrix A can be obtained. This is the basic idea of the algorithm MBI.
The input of the algorithm is a 2D matrix A with m rows and n columns and two parameters k1 and k2, where k1 is the number of partitions of m rows (genes) and k2 is the number of partitions of n columns (patients). The final goal is to find k1 × k2 biclusters of the matrix A, that is equivalent to compute Y1 and Y2. The pseudo code of MBI is shown in Figure 3.
Figure 3.
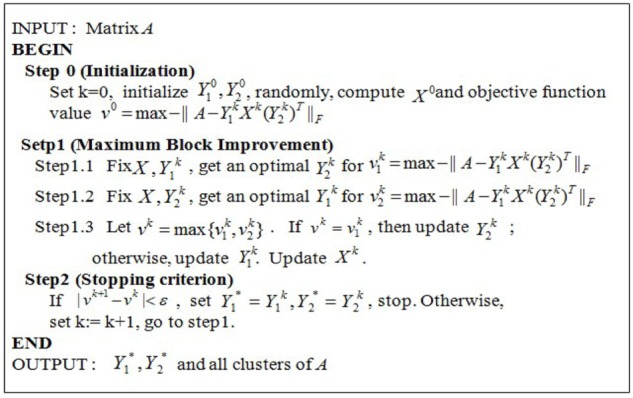
The pseudo code of the algorithm MBI. Input: A gene expression matrix A with m genes/rows and n samples/columns. Two parameters k1 and k2, where k1 and k2 are both positive integers and where k1 is the number of partitions of the m genes and k2 is the number of partitions of the n samples. Output: Two assignment matrices: Y1* as the gene/row assignment matrix, Y2* as the sample/column assignment matrix, and (k1 × k2) co-clusters of the matrix A. Main variables: A nonnegative integer k as the loop counter; A k1 × k2 matrix X with each entry a real number as the artificial central point of one of the k1 × k2 coclusters of the matrix A; A m × k1 matrix Y1 as the row assignment matrix with {0, 1} as the value of each entry; and A n × k2 matrix Y2 as the column assignment matrix with {0, 1} as the value of each entry.
Problems of applying MBI in practice
In this study, we always focus on the problem of identifying different subtypes of a cancer, which is an important application of gene expression data analysis in medicine. MBI addresses this problem by finding checkerboard patterns of the gene expression matrix, but the following problems exist and hinder its power in cancer gene expression data clustering.
The first problem is that the difference of the sizes of Y1 and Y2 results in unequal opportunities of updating of Y1 and Y2 within the iterations of MBI. Actually, the size of Y1 is much larger than that of Y2, because the matrix of cancer gene expression data usually has twenty to thirty thousands of rows (genes), but only tens to, at most, hundreds of columns (patients). When MBI iteratively updates Y1 and Y2 (Fig. 3), Y1 is always selected to be updated because its update will be more effective to minimize the objective function. However, our final goal is to classify cancer patients into different subtypes, so what we really care is that whether Y2 is optimized sufficiently or not. This problem could be greatly alleviated by a gene-filtering procedure, which reduces the size of Y1 and hence provides Y2 more opportunities to be updated.
The second problem is that both Y1 and Y2 are initialized randomly, which would significantly affect their convergence for such an iterative algorithm. We will give a better initialization strategy, which can help MBI not only converge more quickly, but also converge to a better solution with a higher probability.
The third problem is that MBI cannot even guarantee a stable solution; that is, it may report very different results in different runs. To address this problem, a consensus clustering strategy will be introduced to improve the robustness of MBI.
Solutions to the problems of MBI
The solutions to each of the problems mentioned above are described in detail as follows.
Gene filtering
In practice, clinical analysts usually select genes based on their experiences, instead of using all genes for cancer gene expression data analyses, such as cancer subtype prediction.1,18 This step can be done in a computational way, without any knowledge of the genes. With the reduction of the number of genes, the first problem would be solved. Intuitively, the selected genes should have the property of best partitioning the patients into distinct classes, which could be measured by the variances of the gene expression across all patients. One gene with little variance, that is, which has the same or similar expression across all patients, can provide no information for classification. Only genes with large variance can potentially mark different subtypes of cancer and provide possibility to cluster different patients. Therefore, we can only choose the top N genes with biggest variances for downstream analysis. A reasonable value of N is about 20% of the total count of genes.
Better initialization
Iterative algorithms, including MBI, usually cannot guarantee to get a global optimal solution, so how to select an initial value can significantly affect the final result. Instead of initializing randomly, we gave a relative better initialization for Y1 and Y2 using the popular k-means method. Iterating from such an initialization will dramatically reduce the running time, and more importantly, converge to a better solution.
Consensus clustering
For the third problem of MBI without guarantee to get a stable solution, we use a strategy called consensus clustering, which is first proposed by Monti et al.19 and used in many other studies.20–22 The basic idea of consensus clustering is that one can discover clusters based on the consensus over multiple runs of a clustering algorithm with random restart. But, when the matrix is very huge, multiple runs of an algorithm become impossible, so people usually employ a subsampling technology such that each run begins with different subsamples of the original matrix, instead of the whole matrix. Since our gene-filtering procedure could greatly reduce the running time, such a subsampling step is not needed any more. A consensus matrix is defined, with the (i, j) entry records the number of times patient i and j are assigned to the same cluster. Final clustering is determined based on this consensus matrix using an HC method.
Framework of eMBI
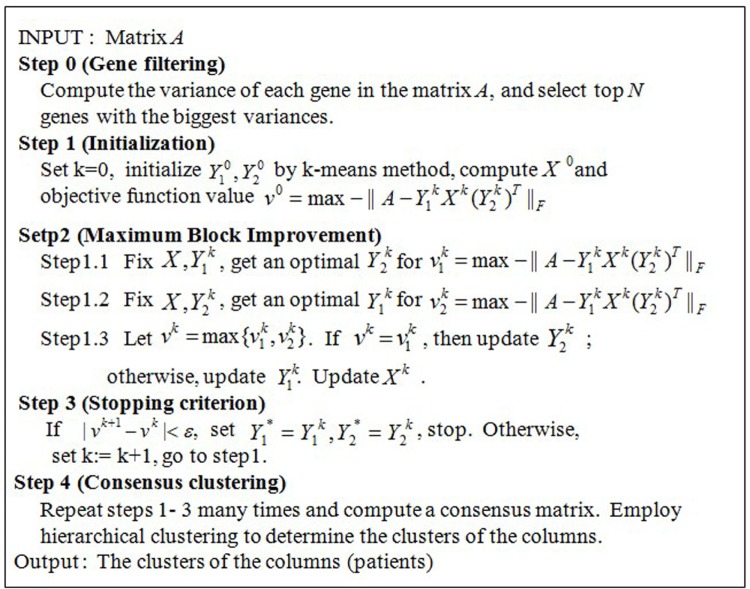
Combining all the improvements mentioned above, we propose an eMBI method, which is designed specifically for cancer subtype prediction. The pseudo code of eMBI is shown in Figure 4.
Figure 4.
The pseudo code of the algorithm eMBI.
Results
We tested our new method, eMBI, on three publicly available datasets, a summary of which is given below.
Data 1: A lung cancer dataset from Ref. 23, 56 samples belonging to four groups: normal subjects (Normal), pulmonary carcinoid tumors (Carcinoid), colon metastases (Colon), and Small cell carcinoma (SmallCell).
Data 2: A colorectal cancer (CRC) dataset from Ref. 24, 62 samples belonging to two dominant CRC subtypes.
Data 3: A non-small-cell lung cancer dataset from Ref. 25, two subtypes of samples: 40 adenocarcinoma (AC) samples and 18 squamous cell carcinoma (SCC) samples.
Interested readers could find more detailed information related to these datasets from the corresponding reference papers and these datasets are downloaded from the websites of the reference papers.
First, the effectiveness of each solution mentioned above is verified on a well-studied benchmark dataset (Data 1). Then, we further evaluate the overall outperformance of eMBI using a CRC dataset (Data 2) in a recent study. Finally, a non-small-cell lung cancer dataset (Data 3) is used to compare eMBI with two other methods: one is a matrix factorization method called NMF17 and the other one is HC, which is often the first choice of clinical analyst in practice.
For the following testing results, when the sample grouping or sample subtype information is available, Accuracy is defined as the ratio between the number of correctly classified patients and the total number of patients.
Effectiveness of each solution
We verify the effectiveness of our solutions to the problems of MBI on a benchmark dataset (Data 1), which consists of 12,625 genes and 56 subjects23 belonging to four groups: normal subjects (Normal), pulmonary carcinoid tumors (Carcinoid), colon metastases (Colon), and small cell carcinoma (SmallCell).
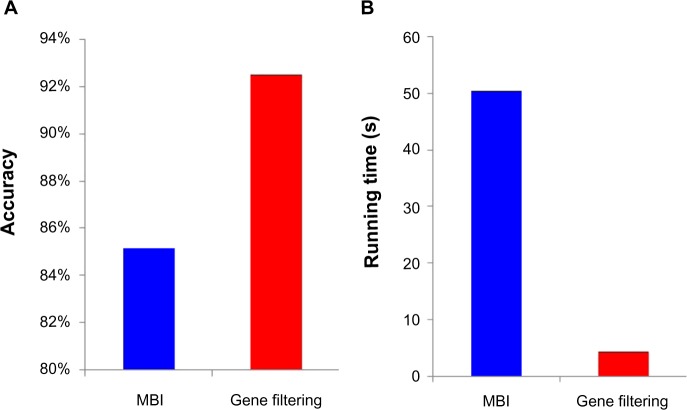
We chose the top 20% genes with biggest variances, and checked the effectiveness of this gene-filtering procedure on Data 1. The testing results based on the average performances of 10 runs are shown in Figure 5. It is obvious that our gene-filtering procedure can dramatically reduce the running time (Fig. 5B), and to our surprise, can even greatly improve the accuracy by ∼8% (Fig. 5A).
Figure 5.
(A) The gene filtering procedure can greatly improve the accuracy, and (B) The gene filtering procedure can dramatically reduce the running time. Effectiveness of our gene-filtering procedure.
Our initialization strategy also works very well in comparison with random initialization (Table 1). In fact, a new initialization using the k-means method not only increases the accuracy of MBI from 85.2 to 98.2%, but also reduces the running time by about 30%. Combined with the gene-filtering procedure, the running time could be dramatically reduced by ∼20 times, while the method still keeps the high subtype prediction accuracy (Table 1).
Table 1.
Comparing the performances of different initialization methods.
| METHODS | ACCURACY | RUNNING TIME (S) |
|---|---|---|
| Random Initialization | 85.2% | 50.51 |
| Initialization with k-Means | 98.2% | 36.26 |
| Gene Filtering+ k-Means | 98.2% | 2.72 |
We also tested the benefits of consensus clustering on Data 1. As we expected, MBI exhibits distinct accuracy in different runs, but consensus clustering shows much more robustness and has higher accuracy (Fig. 6).
Figure 6.
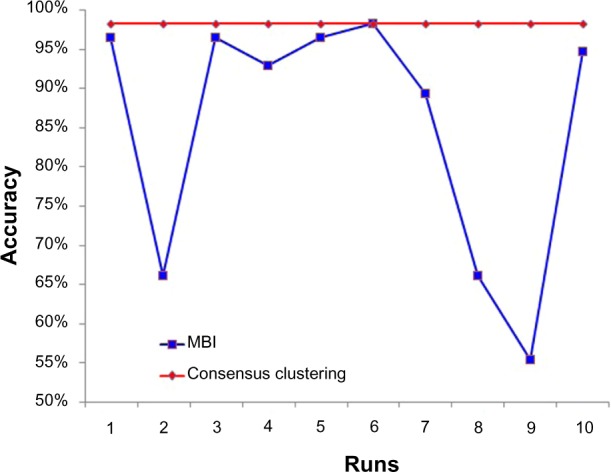
Consensus clustering is robust among 10 runs, while MBI is not.
Overall outperformance of eMBI
We further evaluate the overall outperformance of eMBI using a CRC dataset. The dataset (Data 2) we consider here contains 54,675 genes and 62 samples belonging to two dominant CRC subtypes. According to the study of Schlicker et al,24 these two subtypes can be further divided into five subtypes that exhibit activation of specific signaling pathways.
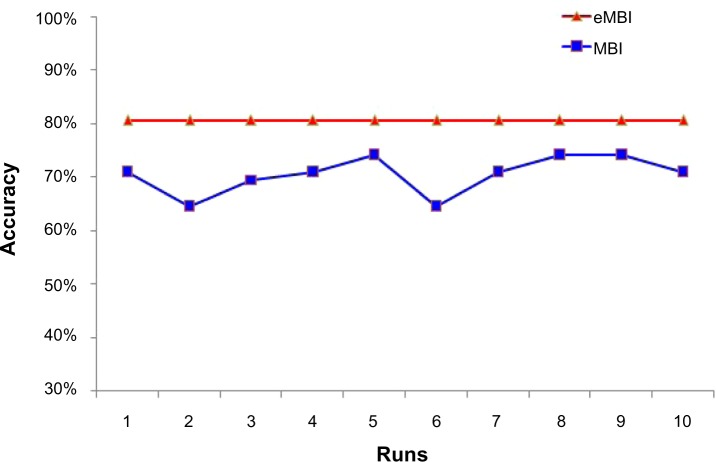
We first detected the two major subtypes using MBI, then our new program eMBI. The comparison results are shown in Table 2, in which the accuracy and running time are both based on average values of 10 different runs. eMBI runs five times faster than MBI (Table 2), and more importantly, eMBI has much higher accuracy. The improvements of eMBI are more significant when we further divide two subtypes into five subtypes (Table 3). To further check the accuracy of each method in each run, we can see that eMBI is very robust, while MBI is not (Fig. 7). Basically, eMBI greatly outperforms MBI in prediction accuracy, robustness, and running time.
Table 2.
Comparing eMBI with MBI on Data 2 (#subtype: 2).
| METHODS | ACCURACY | RUN TIME (S) |
|---|---|---|
| MBI | 70.5% | 5868.7 |
| eMBI | 80.6% | 1013.2 |
Table 3.
Comparing eMBI with MBI on Data 2 (#subtype: 5).
| METHODS | ACCURACY | RUN TIME (S) |
|---|---|---|
| MBI | 46.8% | 29155 |
| eMBI | 66.1% | 6172 |
Figure 7.
eMBI is robust in 10 different runs, while MBI is not.
Comparison eMBI with other methods
To compare eMBI with other methods, we consider another matrix factorization method, NMF, and HC method. A non-small-cell lung cancer dataset (Data 3) in recent study25 is used as our test data. This dataset is composed of two subtypes of samples: 40 AC and 18 SCC samples. The comparison result is shown in Table 4. HC is the fastest method, but it has the worst accuracy. NMF also runs very fast, with a little higher accuracy than HC, while its performance in prediction accuracy is much worse than MBI and eMBI. MBI exhibits a higher accuracy than those of both NMF and HC, but unluckily, it runs too slow. Our eMBI runs about 10 times faster than MBI, and more importantly, it has the highest accuracy, which is the most important measure for the problem of clustering for cancer subtypes.
Table 4.
Comparing different clustering methods on Data 3.
| METHODS | ACCURACY | RUNNING TIME (S) |
|---|---|---|
| eMBI | 87.1% | 3442.7 |
| MBI | 82.3% | 32290.4 |
| NMF | 74.2% | 82.9 |
| HC | 62.9% | 9.15 |
Also note that by simultaneously clustering genes and conditions, eMBI can potentially provide useful information to identify marker genes, which is an important goal in the medicine research field. For example, by checking each gene cluster of eMBI, we can find gene clusters in which genes express differently in different patient groups. One gene cluster containing 92 genes of Data 1 is shown in Figure 8. This gene cluster can significantly classify the four different types of the patient samples and potentially include the candidate marker genes. Although NMF is also a matrix factorization method, it represents the genes with a small number of metagenes, and hence cannot capture marker genes effectively.
Figure 8.
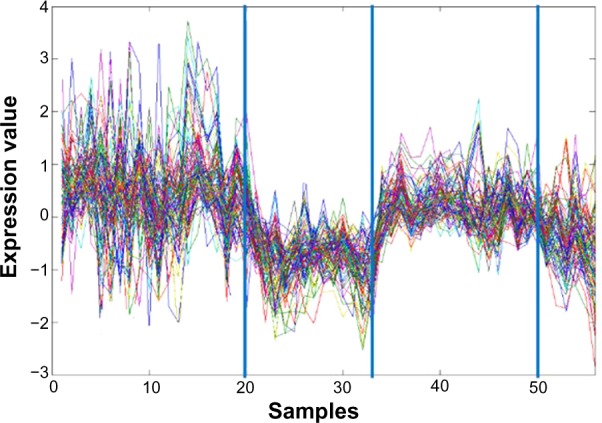
A cluster of genes which can classify four different types of cancer patient samples of Data 1. Here, each curve corresponds to the expression of one gene. The x-axis represents the different number of samples and the y-axis represents the values of the gene expression level. The three blue vertical lines indicate the separation of the samples into four different types.
Conclusions
A challenging and important problem in medicine is to identify clinically relevant subtypes of a cancer using gene expression data. In this study, we develop effective strategies to tailor a recently proposed method MBI for this problem, and implement a new open-source program called eMBI (the MAT-LAB source code version is available at: http://bioinformatics.astate.edu/). Test results on several cancer data consistently indicate that eMBI has greater improvement in comparison with MBI, in the sense of cancer subtype prediction accuracy, robustness, and running time. The HC method, like many other traditional clustering methods, works in this situation, but it is not a good choice because of its low accuracy. Clearly, advanced knowledge of gene expression data clusters can help in clustering cancer patients into clinically relevant subtypes. In the future, we will further improve the prediction accuracy of eMBI, and pay more attention to identification of marker genes. We will develop eMBI to automatically detect those interesting gene clusters and identify effective maker genes, which will benefit cancer gene expression studies and future clinical applications.
Acknowledgments
We would like to thank Qin Ma and Juntao Liu for their helpful suggestions.
Footnotes
Author Contributions
XH conceived and designed the study. ZC and CA implemented and tested the eMBI method. ZC, ZW, and CZ compared eMBI with other methods and prepared the figures and tables. ZC wrote the manuscript. GL, SZ, and XH revised the manuscript. All authors reviewed and approved of the final manuscript.
ACADEMIC EDITOR: JT Efird, Editor in Chief
FUNDING: Authors disclose no funding sources.
COMPETING INTERESTS: Authors disclose no potential conflicts of interest.
This paper was subject to independent, expert peer review by a minimum of two blind peer reviewers. All editorial decisions were made by the independent academic editor. All authors have provided signed confirmation of their compliance with ethical and legal obligations including (but not limited to) use of any copyrighted material, compliance with ICMJE authorship and competing interests disclosure guidelines and, where applicable, compliance with legal and ethical guidelines on human and animal research participants. Provenance: the authors were invited to submit this paper.
REFERENCES
- 1.Kluger Y, Basri R, Chang JT, Gerstein M. Spectral biclustering of microarray data: coclustering genes and conditions. Genome Res. 2003;13(4):703–16. doi: 10.1101/gr.648603. [DOI] [PMC free article] [PubMed] [Google Scholar]
- 2.Eisen MB, Spellman PT, Brown PO, Botstein D. Cluster analysis and display of genome-wide expression patterns. Proc Natl Acad Sci USA. 1998;95(25):14863–8. doi: 10.1073/pnas.95.25.14863. [DOI] [PMC free article] [PubMed] [Google Scholar]
- 3.Alizadeh AA, Eisen MB, Davis RE, et al. Distinct types of diffuse large B-cell lymphoma identified by gene expression profiling. Nature. 2000;403(6769):503–11. doi: 10.1038/35000501. [DOI] [PubMed] [Google Scholar]
- 4.Perou CM, Sørlie T, Eisen MB, et al. Molecular portraits of human breast tumours. Nature. 2000;406(6797):747–52. doi: 10.1038/35021093. [DOI] [PubMed] [Google Scholar]
- 5.Tamayo P, Slonim D, Mesirov J, et al. Interpreting patterns of gene expression with self-organizing maps: methods and application to hematopoietic differentiation. Proc Natl Acad Sci U S A. 1999;96(6):2907–12. doi: 10.1073/pnas.96.6.2907. [DOI] [PMC free article] [PubMed] [Google Scholar]
- 6.Cheng Y, Church GM. Biclustering of expression data. Proc Int Conf Intell Syst Mol Biol. 2000;8:93–103. [PubMed] [Google Scholar]
- 7.Prelić A, Bleuler S, Zimmermann P, et al. A systematic comparison and evaluation of biclustering methods for gene expression data. Bioinformatics. 2006;22(9):1122–9. doi: 10.1093/bioinformatics/btl060. [DOI] [PubMed] [Google Scholar]
- 8.Hochreiter S, Bodenhofer U, Heusel M, et al. FABIA: factor analysis for bicluster acquisition. Bioinformatics. 2010;26(12):1520–7. doi: 10.1093/bioinformatics/btq227. [DOI] [PMC free article] [PubMed] [Google Scholar]
- 9.Ihmels J, Friedlander G, Bergmann S, Sarig O, Ziv Y, Barkai N. Revealing modular organization in the yeast transcriptional network. Nat Genet. 2002;31(4):370–7. doi: 10.1038/ng941. [DOI] [PubMed] [Google Scholar]
- 10.Li G, Ma Q, Tang H, Paterson AH, Xu Y. QUBIC: a qualitative biclustering algorithm for analyses of gene expression data. Nucleic Acids Res. 2009;37(15):e101–e101. doi: 10.1093/nar/gkp491. [DOI] [PMC free article] [PubMed] [Google Scholar]
- 11.Tanay A, Sharan R, Shamir R. Discovering statistically significant biclusters in gene expression data. Bioinformatics. 2002;18(suppl 1):S136–44. doi: 10.1093/bioinformatics/18.suppl_1.s136. [DOI] [PubMed] [Google Scholar]
- 12.Bryant CM, Albertus DL, Kim S, et al. Clinically relevant characterization of lung adenocarcinoma subtypes based on cellular pathways: an international validation study. PLoS One. 2010;5(7):e11712. doi: 10.1371/journal.pone.0011712. [DOI] [PMC free article] [PubMed] [Google Scholar]
- 13.Park Y-Y, Park ES, Kim SB, et al. Development and validation of a prognostic gene-expression signature for lung adenocarcinoma. PLoS One. 2012;7(9):e44225. doi: 10.1371/journal.pone.0044225. [DOI] [PMC free article] [PubMed] [Google Scholar]
- 14.Wilkerson MD, Yin X, Walter V, et al. Differential pathogenesis of lung adenocarcinoma subtypes involving sequence mutations, copy number, chromosomal instability, and methylation. PLoS One. 2012;7(5):e36530. doi: 10.1371/journal.pone.0036530. [DOI] [PMC free article] [PubMed] [Google Scholar]
- 15.Sadanandam A, Lyssiotis CA, Homicsko K, et al. A colorectal cancer classification system that associates cellular phenotype and responses to therapy. Nat Med. 2013;19(5):619–25. doi: 10.1038/nm.3175. [DOI] [PMC free article] [PubMed] [Google Scholar]
- 16.Zhang S, Wang K, Chen B, Huang X. A new framework for co-clustering of gene expression data. In: Loog Marco, Wessels Lodewyk, Reinders Marcel JT, de Ridder Dick., editors. Pattern Recognition in Bioinformatics. New York: Springer; 2011. pp. 1–12. [Google Scholar]
- 17.Brunet J-P, Tamayo P, Golub TR, Mesirov JP. Metagenes and molecular pattern discovery using matrix factorization. Proc Natl Acad Sci U S A. 2004;101(12):4164–9. doi: 10.1073/pnas.0308531101. [DOI] [PMC free article] [PubMed] [Google Scholar]
- 18.Alon U, Barkai N, Notterman DA, et al. Broad patterns of gene expression revealed by clustering analysis of tumor and normal colon tissues probed by oligonucleotide arrays. Proc Natl Acad Sci USA. 1999;96(12):6745–50. doi: 10.1073/pnas.96.12.6745. [DOI] [PMC free article] [PubMed] [Google Scholar]
- 19.Monti S, Tamayo P, Mesirov J, Golub T. Consensus clustering: a resampling-based method for class discovery and visualization of gene expression microarray data. Mach Learn. 2003;52(1–2):91–118. [Google Scholar]
- 20.Filkov V, Skiena S. Integrating microarray data by consensus clustering. Int J Artif Intell Tools. 2004;13(04):863–80. [Google Scholar]
- 21.Yu Z, Wong H-S, Wang H. Graph-based consensus clustering for class discovery from gene expression data. Bioinformatics. 2007;23(21):2888–96. doi: 10.1093/bioinformatics/btm463. [DOI] [PubMed] [Google Scholar]
- 22.Wilkerson MD, Hayes DN. ConsensusClusterPlus: a class discovery tool with confidence assessments and item tracking. Bioinformatics. 2010;26(12):1572–3. doi: 10.1093/bioinformatics/btq170. [DOI] [PMC free article] [PubMed] [Google Scholar]
- 23.Lee M, Shen H, Huang JZ, Marron J. Biclustering via sparse singular value decomposition. Biometrics. 2010;66(4):1087–95. doi: 10.1111/j.1541-0420.2010.01392.x. [DOI] [PubMed] [Google Scholar]
- 24.Schlicker A, Beran G, Chresta CM, et al. Subtypes of primary colorectal tumors correlate with response to targeted treatment in colorectal cell lines. BMC Med Genomics. 2012;5(1):66. doi: 10.1186/1755-8794-5-66. [DOI] [PMC free article] [PubMed] [Google Scholar]
- 25.Kuner R, Muley T, Meister M, et al. Global gene expression analysis reveals specific patterns of cell junctions in non-small cell lung cancer subtypes. Lung Cancer. 2009;63(1):32–8. doi: 10.1016/j.lungcan.2008.03.033. [DOI] [PubMed] [Google Scholar]


