

Abstract
Pain is a primary driver of learning and motivated action. It is also a target of learning, as nociceptive brain responses are shaped by learning processes. We combined an instrumental pain avoidance task with an axiomatic approach to assessing fMRI signals related to prediction errors (PEs), which drive reinforcement-based learning. We found that pain PEs were encoded in the periaqueductal gray (PAG), an important structure for pain control and learning in animal models. Axiomatic tests combined with dynamic causal modeling suggested that ventromedial prefrontal cortex, supported by putamen, provides an expected value-related input to the PAG, which then conveys PE signals to prefrontal regions important for behavioral regulation, including orbitofrontal, anterior mid-cingulate, and dorsomedial prefrontal cortices. Thus, pain-related learning involves distinct neural circuitry, with implications for behavior and pain dynamics.
INTRODUCTION
Both appetitive and aversive primary reinforcers—“pleasure” and “pain”— fundamentally shape learning and decision-making. Neural processes that signal appetitive value, including responses in the mesolimbic dopamine system, drive reward-pursuit responses. Pain and other aversive processes drive avoidance and escape. In spite of its importance, however, pain avoidance is poorly understood, and the nature of the cerebral processes underlying pain's motivational functions is an important frontier1,2.
Much progress in understanding motivational learning systems has come from the application of computational reinforcement learning (RL) models to the analysis of brain circuitry in animals3 and human fMRI data4. Such models posit that learning occurs in proportion to the magnitude of the prediction error (PE)— the discrepancy between the predicted value and experienced reward or punishment—evaluated after each action5. RL models have been used to identify reward PE signals—which reflect ‘better-than-expected’ outcomes—in midbrain dopamine neurons3, ventral striatum (VS) and medial orbitofrontal cortex (mOFC). While fMRI activity in these and other areas correlates with parametric estimates of PEs, work examining such activity more carefully with respect to separate algebraic components of the PE 6–8—or, in a related approach, testing activity against a set of axioms that together comprise the set of conditions that define a PE9—has so far validated only VS activity as satisfying all the criteria for appetitive PEs in humans.
Meanwhile, there has not yet been a similarly systematic decomposition of aversive PE-related activity. An emerging body of literature2,10–13 has identified several candidate regions that may encode aversive PE signals (‘worse-than-expected’ outcomes) in humans, including the amygdala12,14, VS2,15,16, and lateral OFC10,17. However, it remains unclear whether this activity reflects PEs or, rather, related signals such as pain expectancies or aversive responses. In addition, recent animal studies have identified neurons in a different region, the midbrain periaqueductal gray (PAG), with several aversive PE-like properties1, including (a) elevated firing rates to unexpected vs. expected punishment1,18 and (b) habituation as painful shocks become expected1,18.
In this study, using a combination of computational modelling and axiomatic approaches with fMRI data, we sought to identify regions encoding aversive PE signals (‘worse-than-expected’ outcomes) and aversive value signals (pain expectancies). Participants (N = 26) performed a reinforcement-learning task during which they learned to avoid selecting the actions associated with a high probability of receiving pain. On each of 150 trials, participants chose between two options (Fig. 1a), each associated probabilistically with the delivery of painful heat (47.4 ± 1.71°C). Probabilities for each option were governed by two independently varying random walks, so that participants learned to track the changing reinforcement values continuously throughout the task (see Fig. 1b).
Figure 1.
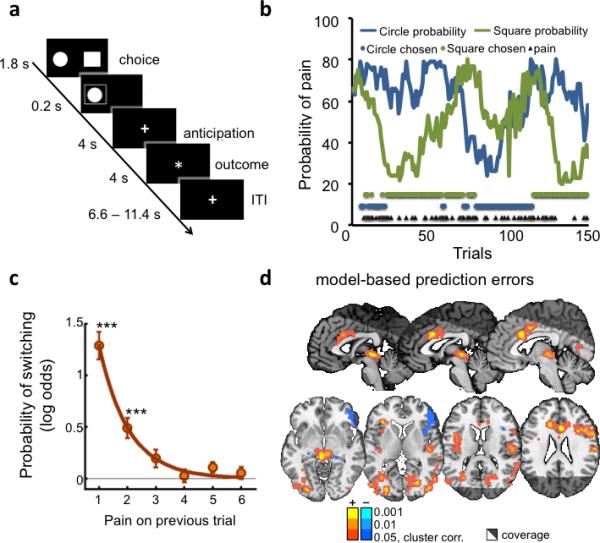
Pain avoidance learning task, behavioral and brain imaging results. (A) One experimental trial. Participants had 1.8 seconds to make their choice, after which their choice was displayed for 0.2 seconds. After an anticipation period of 4 seconds, participants either received a painful stimulation or nothing. The stimulation period was marked by a different fixation point. Trials were separated by a 6.6 – 11.4 seconds inter-trial interval. (B) Data from one participant. The blue and green lines depict the probability of pain associated with each option over the 150 trials (one of four possible pairs of random walks). Blue and green dots represent the selected option, and black triangles represent pain delivery. (C) Logistic regression model results (number or participants = 23). Probability of switching as a function of pain 1 – 6 trials back decays exponentially and is significantly different from zero at one (t(22) = 9.20, p<0.001) and two (t(22) = 4.36, p<0.001) trials back. (D) Activity correlated with reinforcement learning (RL) model-based prediction errors at pain onsets (number or participants = 23), cluster-thresholded (p<0.05, FWE, two-tailed) with cluster-defining thresholds of p <0.001, p<0.01 and p < 0.05.
Our first objective was to identify brain regions that encode aversive PE signals and aversive value signals (pain expectancies), particularly in regions commonly thought to mediate PEs from human studies, including VS, and animal models (PAG). We reasoned that using an axiomatic testing approach could provide a stronger test for identifying aversive PEs and aversive value signals. We therefore considered whether a) PAG and VS correlate with PEs as predicted by a computational RL model, and b) they satisfy the three axiomatic properties that together define aversive PEs(9; see Results and Online methods sections for a detailed description of the axioms).
Secondly, we sought to develop a brain-based model of how PE- and value-encoding regions interact during learning. The computational RL framework specifies dynamic interactions between brain regions encoding reinforcements, expected values (EVs), and PEs, but previous fMRI studies have not investigated the inter-region dynamics (i.e., effective connectivity) implied by RL models. In a strong form of the mapping between model and brain, PE-based value updating may be accomplished by direct connectivity between PE- and value-encoding regions. Here, we used Dynamic Causal Modeling19 to test plausible models of effective connectivity among value-encoding and PE-encoding regions, with the goal of developing an empirically based model of how brain regions interact during pain-driven learning.
RESULTS
Behavioral results
As expected, participants switched options more frequently after receiving pain than no stimulus (40.5±4.2% vs. 6±1.1% of trials, p < .0001). The effects of pain on switching also decayed exponentially with time, as evidenced by the results of logistic regressions assessing the effects of reinforcement history (pain delivered 1 to 6 trials back) on switches (p < 0.05 for 1 to 2 trials back; see Fig. 1c).
We then used a standard computational temporal-difference (TD) learning model to analyze subjects’ choices as a function of pain. The model comprised a learning rate parameter (α), controlling the extent to which past feedback influences future predictions, and a softmax inverse temperature (β) parameter controlling the probability of selecting the most advantageous option. The analysis revealed learning rates (α=0.63±0.26), softmax inverse temperatures (β=4.74±2.74), and model fits (negative log likelihood = 65 ± 21) comparable to those found in similar studies of reinforcement learning20. These results, along with the exponential form of the influences of previous pain (Fig. 1c), suggest that the TD model captures pain avoidance learning in this task.
Aversive prediction error signals
Aversive PE signals should be phasically triggered at the moment when participants learn that punishment will be delivered, and should correlate with computational model-derived PEs. Here, we identified PE-correlated regions by regressing fMRI activity at outcome onset (see Supplementary Fig. 1) on model-derived PEs determined by fitting a TD model to individuals’ choice behaviour (see Methods). Activity correlating with model-based aversive PEs (greater activity for worse-than-expected outcomes) was found in several areas, as shown in Figure 1d. These included the left anterior insula, anterior and midcingulate cortices (ACC and MCC), the right pre- and post- central gyrii, the right dorsolateral prefrontal cortex (dlPFC), and a large cluster in the midbrain encompassing the periaqueductal gray (PAG). Negative correlations with PE (greater activity for better-than-expected outcomes) were found in the entorhinal/parahippocampal cortices, right inferior frontal gyrus, right temporal pole and right lateral thalamus (Fig. 1d and Supplementary Table 1).
In the reward domain, it has been shown that some signals that correlate with PE are better explained as relating to some other quantity, such as reward magnitude, which is intrinsically correlated with PE6,8,9,14. Here, activity that tracked aversive PEs was similar to activity related to Pain vs. No-Stimulus onset (see Fig. 1 and Supplementary Table 1; note that both Pain and No-stimulus trials were indicated by an identical change in the fixation cross to avoid temporal ambiguity). Thus, to ensure that the candidate PE-related fMRI signals truly integrate outcome and expectancy information into an aversive PE signal, we employed an axiomatic approach9(see Online Methods), which specifies a set of three conditions that together define a PE. In the context of our task, these were:
Axiom 1: Activity should be higher for received than avoided pain, unless pain is fully expected.
Axiom 2: Activity should decrease in proportion to expected pain (i.e., expected aversive value), for both Pain and No-Stimulus trials.
Axiom 3: Activity on Pain and No-Stimulus trials should be equivalent if the outcome is completely predicted.
Here, the first two conditions correspond to tests of effects of outcome and expectancy, respectively, the conjunction of which constitute the algebraic definition of PEs (rt – Vt). These tests are analogous to other recent work6,8,14, while the third condition, less often explicitly examined, verifies that the magnitude of these two separate and opposite effects are equivalent, so that fully predicted outcomes do not generate PE signals. Thus, the axioms as applied in our case reflect the requirements specified by the mathematical definition of an aversive PE.
As shown graphically in Figure 2a, brain regions that satisfy all the axioms should show a unique profile of activity as a function of expectancy and pain delivery, whereas those that track only pain expectancy or delivery will show different patterns. Because Axiom 3 depends on support for the null hypothesis, we conducted additional Bayesian analyses of the odds in favour of vs. against the null hypothesis21.
Figure 2.
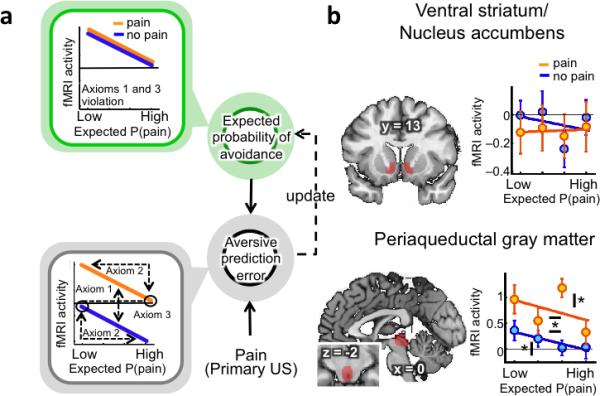
Pain avoidance learning model and axiomatic tests in ventral striatum and periaqueductal gray (PAG) regions of interest (ROI) (A) Regions encoding aversive prediction errors (in gray) should display higher activity for pain vs. No-Stimulus trials (axiom 1), higher activity for low expected probability of pain, regardless of outcome (axiom 2), and no difference in activity between highly predicted pain or No-Stimulus outcomes (axiom 3). Regions encoding the expected probability of avoidance (in green) should only display higher activity for low expected probability of pain, regardless of outcome. Aversive prediction errors result from the integration of pain-related information with prior expectations. This signal is then used to update future predictions. (B) Activity in a priori ventral striatum and PAG matter ROIs per quartile of expected probability of pain (number or participants = 23). Activity in the PAG satisfies all 3 axioms for aversive prediction errors (Axiom #1 (pain > no stimulus): t(22) = 3.67, p <0.05; Axiom # 2 (significance of slope for pain trials, sign permutation test): t(22)=– 2.05, p < 0.05; Axiom # 2 (significance of slope for no stimulus trials, sign permutation test): t(22)=–1.98, p < 0.05; Axiom # 3 (no difference between highly predicted pain or no stimulus outcomes, Bayesian analyses, odds in favor of the null: 5.48). By contrast, activity in the ventral striatum only satisfies axiom # 3 (no difference between highly predicted pain or no stimulus outcomes, Bayesian analyses, odds in favor of the null: 7.07). Asterisks with horizontal bars indicate significant differences between pain and no stimulus outcomes. Asterisks with vertical bars indicate significant slopes (* = p<0.05).
ROI analyses revealed that PAG, but not VS, fulfilled all the axioms for aversive PE signals (Fig. 2b). The PAG responded more strongly to Pain than No-Stimulus trials, holding pain expectancy constant (Axiom #1; t(22) = 3.67, p <0.05). It showed reduced responses to outcomes with greater pain expectancy, for both Pain and No-Stimulus trials (Axiom #2; Pain trials: t(22)=–2.05, p < 0.05; No-Stimulus trials: t(22)=–1.98, p < 0.05), and finally, it showed no difference between fully predicted pain and No-Stimulus trials (Axiom #3; t(22) = 0.13, p = n.s., odds in favor of the null: 5.48). The VS did not show any effect of pain expectancy, violating Axiom #2, and did not respond to Pain vs. No-Stimulus outcomes, violating Axiom #1 (p's > 0.4).
To search for additional regions that might satisfy the axioms for aversive PEs, we conducted a whole-brain conjunction search for three relevant contrasts: a) Pain onset vs. No-Stimulus onset (purple in Fig. 3); b) Expectancy effects— i.e., parametric variation with the degree of model-based expectancy—on pain trials (cyan in Fig. 3); and c) Expectancy effects on No-Stimulus trials (yellow in Fig. 3). Significant results in effect (a) satisfy Axiom 1, and significant results for effects (b) and (c) satisfy Axiom 2. A region of the PAG extending into the tectum (Fig. 3 and Supplementary Table 2) was the only region to show significant results in all three tests (p < .05 cluster-extent corrected). To test Axiom #3, we compared activity within that cluster for highly expected Pain and No-Stimulus outcomes. There was no activity difference between Pain and No-Stimulus trials when outcomes were highly predicted (t(22): 0.56, p > 0.4, odds in favor of the null: 5.13), thereby confirming Axiom #3.
Figure 3.
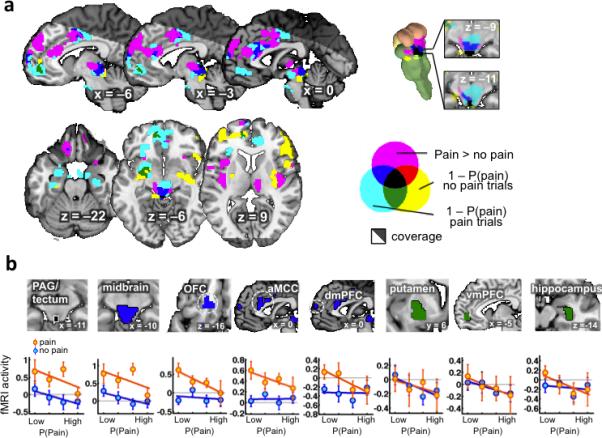
Results from the whole-brain conjunctive search (number or participants = 23). (A) Conjunction analysis of pain > no stimulus effects (axiom #1) and expected avoidance probability (1– pain probability) effects for both pain and no stimulus outcomes (axiom #2). Clusters used for the conjunction analysis were cluster-thresholded (p<0.05, FWE, one-tailed) with a cluster-defining threshold of p <0.05. (B) Profiles of activity within ROIs defined from the conjunction analysis. For pain and no stimulus outcomes, mean responses were extracted by quartiles of model-based probability. OFC = Orbitofrontal cortex, aMCC = anterior midcingulate cortex, dmPFC = dorsomedial prefrontal cortex, vmPFC = ventromedial prefrontal cortex
Studies 2 and 3: Monetary rewards and varying pain levels
In this study, we chose not to include rewarding events, in part because many studies have demonstrated reward-related PEs linked to VS9,22, and in part to avoid the complexity caused when participants directly compare rewarding and punishing events. However, in order to provide additional evidence on whether aversive and appetitive PEs are encoded in different brain circuits, we reanalysed data from a published experiment23 that employed a similar experimental design with monetary rewards (see Study 2 in Supplementary Materials), focusing on the VS and PAG. As expected, in contradistinction to the main study, appetitive PEs to monetary rewards were tracked by activity in the VS. (t(20) = 5.77, p < 0.001), but not the PAG (PAG–appetitive: t(20) = 1.54, p = 0.14; see Supplementary Fig. 2). The signal-to-noise (SNR) ratio in the ventral striatum (171.13 ± 9.68) and PAG (163.20 ± 5.57) were not significantly different (p >0.23). However, we note that the dissociation between aversive and reward PEs depends on null findings in the PAG in Study 2 and other reward learning studies. It is possible that high-resolution and brainstem optimized imaging (e.g.24,25) could yield additional reward-related signals that remain to be discovered. Moreover, differences in field strength (3T vs 1.5T) and other scanning parameters could also have impacted the ability to identify appetitive PE signals in the PAG in this additional study.
Another important issue is whether putative PE-related signals are related to pain intensity, or merely the presence vs. absence of an aversive reinforcer. In Study 3 (n = 50; see Supplementary Materials for details), we sought to replicate aversive PE-related findings in the PAG and test for activation related to noxious stimulus intensity. This study employed three intensities of painful stimulation in the noxious range (46°C, 47°C and 48°C) and two independent manipulations of expectations about pain intensity: (1) a classical conditioning procedure and (2) un-reinforced placebo instructions designed to induce expectations of relief (see Supplementary Fig. 3). Activity corresponding to the axiomatic requirements for prediction errors was analysed in the time window during which the three stimulus intensities were subjectively differentiated (4–10 seconds post-stimulus onset; see Supplementary Fig. 3d).
In accordance with Axiom #1, PAG activity within that time window increased with temperature (p < 0.001). In accordance with Axiom #2, activity was higher during pain for low vs. high pain conditioned cues (F(1,49) = 4.39, p < 0.05), and for the placebo vs. control condition (F(1,49) =16.03, p < 0.001). In both of these conditions, the stimulus was higher than expected based on cues and verbal instructions, respectively. Finally, it was not possible to definitively test Axiom #3 in Study 3 because cues never fully predicted outcomes. Overall, results from this Supplementary experiment replicate and extend the findings of pain-related aversive prediction errors in the PAG, demonstrating sensitivity to the level of painful stimulus intensity and sensitivity to verbal instructions as well as predictive cues.
Expectancies and other learning-related variables
Regions that track expected avoidance value—a contributor to aversive PEs—should show effects of the expected probability of pain but no effects of pain itself (Fig. 2a). In terms of neural effects, this translates into greater activity with low pain expectancy for both Pain and No-Stimulus trials, but no effect of Pain vs. No-Stimulus. We identified clusters in the left putamen, vmPFC, and right hippocampus in which activity fit this profile, consistent with expectancy effects. These regions displayed increased activity when pain was expected to be avoided (low pain expectancy), but didn't respond differentially to pain vs. No-stimulus outcomes (green clusters in Fig. 3a). Post hoc analyses confirmed that no areas showed significant Pain vs. No-Stimulus effects (all p > .10, all Bayes factors in favour of the null >= 6.04; green in Fig. 3b).
The conjunction analyses wen tested can identify regions that do not conform precisely to all elements of the RL model, but may nonetheless be important for guiding behaviour and learning. Several regions identified in the conjunction analysis correlated with PEs only on pain trials (blue in Fig. 3a), including the left OFC, anterior MCC (aMCC), dorsomedial prefrontal cortex (dmPFC) and a larger dorsal midbrain cluster comprising the PAG, tectum, DRN, NCF and red nucleus (RN). Though there are several potential interpretations, we suggest that these areas reflect updating of the value of switching away from the punished option on the next trial, a decision participants only have to make following pain delivery.
Finally, follow-up ROI analyses of response patterns within these regions revealed that the midbrain shows a significant correlation with expected value on No-Stimulus trials (t(22)=–1.82, p<0.05, one-tailed) that did not meet the whole-brain threshold (blue in Fig. 3b). Thus, findings in this larger midbrain cluster are consistent with aversive PE signals, though the dorsal PAG region was the only portion to survive whole-brain correction in all three contrasts. The other three regions showed little evidence for expectancy effects on No-Stimulus trials (Bayes factors in favour of the null all > 2.24), and thus are more likely to reflect avoidance value updating or other motivational processes. Finally, we note that although the current results relate signal in the PAG as whole to aversive PEs, it is possible that high-resolution and brainstem-optimized imaging could reveal a finer-grained distribution of PAG sub-regions with functionally distinct response profiles24,26, including portions that respond only to expectancies. More broadly, our results do not imply that aversive PEs are the only signal represented in the PAG.
The previous analyses examined fMRI activity at pain onset, when PEs are generated. Brain regions that encode expected value should also be active earlier, when decisions are made and the expected value is computed. To identify such regions, we examined activity that parametrically tracked the expected probability of avoidance at the time of decision (see Supplementary Fig. 4 and Supplementary table 3). Positive effects (i.e., greater activity with high avoidance value or low pain expectancy) were observed in the ventromedial prefrontal cortex (vmPFC), and in particular in the medial OFC and perigenual anterior cingulate cortex (pgACC). Conversely, negative activations were observed in the aMCC, lateral frontal pole, parietal operculum, cerebellum and visual cortex.
Network dynamics underlying aversive PE signals
To develop a brain-based model of the learning process, we used Dynamic Causal Modelling (DCM)19 to explore how the 7 regions identified in the previous analysis (Fig. 3b) interact during learning. Based on the principles governing RL models (Fig. 2a), regions that encode aversive PEs (PAG) should receive converging input from those that encode expectancies (vmPFC, putamen, hippocampus) and primary reinforcement (nociceptive) signals. Afferent nociceptive signals in PE-encoding regions should be cancelled out by expectancy-related information when those signals are fully predicted1,18. Regions important for action value and decision-making (aMCC, OFC, and dmPFC) may receive converging PE and primary reinforcement signals.
As is increasingly common with DCMs, we tested a family of similar models to identify the most likely configuration of connections based on the data. This is conceptually analogous to optimizing parameter values (e.g., in linear regression), except that we search over models, identifying the most likely pattern of connections given the data using Bayesian model selection (BMS)27. We defined a model limited to brain correlates of RL model-based effects (PAG, vmPFC, putamen, hippocampus), and then extended the model to include other regions that may encode avoidance value and related properties, testing 72 plausible models in total (see Methods and Supplementary Figs. 7–10). Hence, the final model was jointly constrained by a priori theoretical constraints and the evidence in the data.
In the final, most likely model (Fig. 4), vmPFC projects most directly to PAG among value-encoding regions, and avoidance value is most closely related to the putamen, which transmits value information to vmPFC. Then, PE and expected value signals from the midbrain and putamen are transmitted to OFC and aMCC, with effects on dmPFC mediated by OFC. Noxious input had direct effects on PAG, in keeping with the known anatomy of the ascending spinomesencephalic nociceptive pathway28, and modulatory effects on ascending putamen-to-OFC, putamen-to-aMCC, and midbrain-to-aMCC connections. These modulatory effects are plausible given that the spinothalamic tract and other pathways provide separate channels of ascending nociceptive input that are distinct from spinomesencephalic inputs to the PAG.
Figure 4.
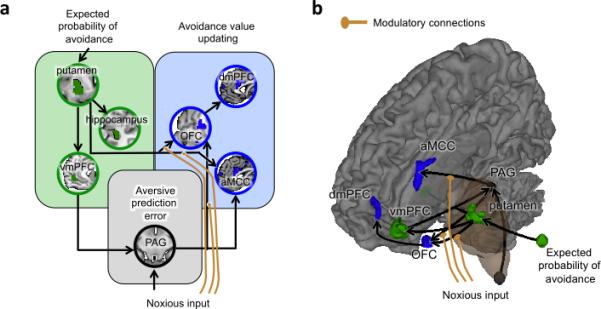
Dynamic causal model (DCM) of aversive prediction errors at outcome onset (number or participants = 23). (A–B) This model was identified as the most likely of all the models tested (see Supplementary Fig. 3–6) by a Bayesian model selection (BMS) process. The regions included in the model were identified by the previous conjunction analysis (Fig. 3) as reflecting 1– expected probability of avoidance regardless of outcome (green), aversive prediction errors (black), or avoidance value updating (blue).
DISCUSSION
Towards a neural systems model for aversive PEs
Pain has obvious motivational functions, both shaping and being shaped by learning, but we still know very little about the basic neural processes underlying its influence on human behavior. Using a combination of computational RL models, axiomatic tests, and DCM models, we identified a candidate system that allows humans to avoid actions associated with pain. In this model, a system of interconnected forebrain regions including the putamen, hippocampus and vmPFC encodes expected value signals. Expectations are then compared with primary nociceptive inputs in the PAG to generate aversive PE signals. These signals shape expectations maintained in medial prefrontal-temporal-striatal systems, and are additionally conveyed to forebrain structures involved in behavioral decisions and choice (aMCC, dmPFC and OFC).
Our data and connectivity models identify the PAG as a primary site for aversive PEs, in contrast to previous neuroimaging findings and theories that a single system drives appetitive and aversive PEs29. The centrality of the PAG for aversive PEs is consistent with both anatomical and neurophysiological evidence in animals. The PAG receives monosynaptic inputs from both nociceptive spinal projection neurons28 and top-down projections from the vmPFC30, positioning it as a potential comparator of ‘bottom up’ aversive sensations with expectations. It also sends monosynaptic, reciprocal projections to the vmPFC—which is essential for value updating in the RL framework and likely for behavioral choice as well31—and to aMCC32, OFC and other areas involved in determining action value and coordinating defensive behavior18,33. The aMCC in particular is critical for pain avoidance18 and is heavily connected to motor and premotor centers (aMCC).
The central role of the PAG in aversive PEs is also consistent with several prominent animal models of aversive learning34. These models suggest that the PAG is critical for integrating expectations with ascending nociceptive information. Though animal studies have not formally tested the axioms that satisfy aversive PEs directly, as we have here, several functional properties of the PAG in animals are consistent with PE signaling1, such as higher firing rates to unexpected vs. expected punishment1,18. PAG neurons respond more strongly to unexpected vs. expected electric shocks18, consistent with our fMRI findings here. These expectancy effects seem to be mediated by inhibition of ascending nociceptive inputs through the release of endogenous opioids in the PAG1, which blocks nociceptive responses when pain is expected. This converging animal evidence suggests that opioidergic modulation of the PAG may be a critical element of aversive PEs.
Overlap in systems for reward and aversive PEs
The nature and degree of overlap between appetitive and aversive learning is currently intensely debated. Some proponents of separable systems for reward and aversion have stressed the close co-existence of neuronal populations signaling appetitive and aversive value in structures including the striatum and ventral tegmental area35. Other arguments in favor of a unitary system come from neuroimaging studies showing that a common set of regions activates (vmPFC, striatum) or deactivates (ACC, insula, dlpfc) parametrically with increasing outcome value across both aversive (monetary losses) and appetitive (monetary gains) domains36,37. However, these findings may be caused by framing of the outcomes as relative gains or losses compared to the alternative, and hence not truly reflect categorical similarities between appetitive and aversive learning systems. That is, losing endowed money may not engage learning systems adapted for primary punishments like pain, and both the primary nature of the reinforcer (primary vs. secondary) and the specific type of reinforcement (thermal pain vs. loss) may be important.
On the other hand, imaging studies employing primary aversive reinforcers such as pain have converged on a set of candidate regions that are potentially specific to aversive learning, including the brainstem, amygdala, OFC, insula and ACC 2,10,12,14,38, but the results across studies have also been mixed. Part of this variability could be due to heterogeneity in the response properties of different neuronal sub-populations39, but also to the fact that latent variables derived from RL models, such as PEs, are by definition correlated with related signals, such as expected values or outcome information. As a result, PE signals within a given voxel can be highly correlated with EVs or outcome information. In the case of our study, regions tracking parametric estimates of aversive PEs strongly overlapped with regions signaling pain onsets (see Supplementary Fig. 5), making them indistinguishable without more fine-grained tests.
Here, the use of axiomatic tests allowed us to dissociate regions tracking aversive PEs from similar, intrinsically correlated signals such as expectancy and nociception or pain. Only the PAG showed consistent evidence for aversive PEs in all axiomatic tests. By contrast, activity in a ventral striatum ROI previously shown to fulfill all axiomatic requirements for an appetitive PE signal9 showed no evidence for aversive PE signals, although it encoded appetitive PEs to monetary rewards in a separate experiment using a similar design. Conversely, activity in the PAG did not correlate with appetitive PEs to monetary rewards, suggesting that there is at least partial segregation between aversive and appetitive systems at the level of PEs. Indeed, the functional neuroanatomy of the PAG strongly indicates it is highly specialized in the treatment of intrinsically aversive stimuli26,40. Among other primary aversive reinforcers, PAG is activated by painful events41, aversive images24,42, and social threats43. By contrast, a recent meta-analysis of over 200 neuroimaging studies found no reliable reward-related signal in the PAG44.
By contrast, vmPFC activity seems to reflect expected positive value in a variety of contexts and paradigms45, including reward learning, economic choice46, pain avoidance11, and extinction/extinction recall47. Our results are consistent with the vmPFC as the most direct representation of value as related to choice and learning (Fig. 3 and Supplementary Fig. 4), and most closely connected to the PAG in the retained DCM model. This is consistent with recent findings that the vmPFC may act as a “hub” or “convergence point” for different types of expected value signals, such as experienced-based expected value signals computed in the putamen and model-based value signals computed in the caudate48. Hence, our results seem to indicate both a convergence between appetitive and aversive systems in value representations in the vmPFC, and a segregation between the two systems when these expected values signals are integrated with ascending aversive unconditioned stimuli (US) inputs in the PAG to generate PE signals.
Online Methods
Participants
Twenty-six healthy, right-handed participants completed the study (Mean age = 26.7 ± 7.6 years, 14 females). The sample consisted of 52% Caucasian, 20% Asian, 16% Hispanic, and 12% African American participants. All participants provided informed consent. The study was approved by the Columbia University Institutional Review Board. Preliminary eligibility was assessed with a general health questionnaire, a pain safety screening form, and an fMRI safety screening form. Participants reported no history of psychiatric, neurological, or pain disorders. Three participants were excluded from the analysis because of their poor performance on task (see section on reinforcement model-based analysis below).
Thermal stimulation
Thermal stimulation was delivered to the volar surface of the left (nondominant) inner forearm using a 16 × 16mm Peltier thermode (Medoc). In order to minimize the effects of peripheral sensitization/habituation, the thermode was moved to a new skin spot after each run. Each stimulus lasted 9s with a 2.5s ramp-up and ramp-down periods and 4s at target temperature. Temperatures were individually calibrated to be at a level 7 on a continuous scale ranging from 0 to 8 (0, no sensation; 1, nonpainful warmth; 2, low pain; 5, moderate pain; 8, maximum tolerable pain), during a practice session performed on a separate day prior to the imaging session. This procedure ensured that participants received the most painful level of the temperature within tolerance limits. The average temperature of the stimulation was 47.4 ± 1.71°C.
Experimental task
The pain avoidance instrumental learning task used in the current study comprised 150 trials (divided in 6 runs of 25 trials), during which subjects had to select the option with the lowest probability of being followed by a painful thermal stimulation. The probabilities associated with each option were independent from one another and varied from trial to trial according to pairs of random walks. Four pairs of random walks were selected based on the criterion that they must cross (reverse) at least one time (see Supplementary Fig. 6); each participant was randomly administered one of the four pairs.
Each trial (see Fig. 1a) started with the presentation of the two options (circle or diamond, randomly displayed to the left or right) for 1800 ms, during which participants had to enter their decision by pressing on the left or right button of the response unit. If participants didn't have time to make their choice (< 1 % of trials), the computer randomly selected a response for them. After a feedback period of 200 ms, and an anticipation period of 4000 ms, the fixation point changed from an asterisk (*) to a cross (+) that stayed on the screen for 9000 ms to mark the period during which participants could receive a painful thermal stimulation. After that stimulation period, the fixation point changed back to an asterisk for a jittered inter-trial interval of 6600, 7800, 9000, 10200 or 11400 ms. On a day prior to the imaging session, participants performed a practice session with a different pair of random walks and options (square and triangle) from the ones they received during the imaging session. During that practice session, they were carefully instructed about all aspects of the experiment, except the actual probabilities of pain that they had to infer. Participants also provided on-line continuous ratings of pain (0, no sensation; 1, nonpainful warmth; 2, low pain; 5, moderate pain; 8, maximum tolerable pain) for the practice, but not imaging, session.
fMRI data acquisition and preprocessing
Data acquisition
Whole-brain fMRI data were acquired on a 1.5T GE Sigma TwinSpeed Excite HD scanner (GE Medical Systems) at the Functional MRI Research Center at Columbia University. Functional images were acquired with a T2*-weighted, two-dimensional gradient echo spiral in/out pulse sequence (Glover and Law, 2001) [repetition time (TR) = 3000 ms; echo time = 30 ms; flip angle = 84°; field of view = 224 mm; 64 × 64 matrix, 3.5 × 3.5 × 2.2 mm voxels, 64 slices]. In order to maximize signal in the vmPFC, slices were tilted by 30° from AC-PC axis, resulting in a loss of coverage in dorso-posterior parietal areas, including S1 in the arm area. We were therefore unable to assess the contribution of S1 in pain avoidance learning. Each run lasted 10 min and 20 s (206 TRs). Stimulus presentation and data acquisition were controlled using E-Prime software (Psychology Software Tools). Responses were made with the right hand via an MRI-compatible response unit (Resonance Technologies). Visual stimuli were presented through goggles positioned upon the scanner head coil (Avotech).
Preprocessing
Prior to preprocessing, global outlier time points (i.e. “spikes” in BOLD signal) were identified by computing both the mean and the standard deviation (across voxels) of values for each image for all slices. Mahalanobis distances for the matrix of slice-wise mean and standard deviation values (concatenated) × functional volumes (time) were computed, and any values with a significant χ2 value (corrected for multiple comparisons based on the more stringent of either false discovery rate or Bonferroni methods) were considered outliers (less than 1% of images were outliers). The output of this procedure was later used as a covariate of noninterest in the first level models.
Functional images were slice-acquisition-timing and motion corrected using SPM8 (Wellcome Trust Centre for Neuroimaging, London, UK). Structural T1-weighted images were coregistered to the first functional image for each subject using an iterative procedure of automated registration using mutual information coregistration in SPM8 and manual adjustment of the automated algorithm's starting point until the automated procedure provided satisfactory alignment. Structural images were normalized to MNI space using SPM8, interpolated to 2×2×2 mm voxels, and smoothed using a 6mm full-width at half maximum Gaussian kernel.
Reinforcement model-based analysis
Participants’ decisions were modeled as a function of previous choices and rewards using a temporal-difference (TD) algorithm. Specifically, the predicted value for options “square” and “circle” (Vsquare or Vcircle) were updated in the direction of the obtained reward using a delta rule with learning rate α whenever that option was chosen [Vchosen option(t +1) = Vchosen option(t ) + α•(r(t) – Vchosen option(t ) )], where r(t) is the reward (pain = –1; no stimulus = 0) obtained at trial t. The probability of choosing option i over j at trial t was determined by a softmax distribution, where the inverse temperature parameter β controls the strength of the competition between the two options [p(choice t = “square” | Vsquare(t), Vcircle(t)) = exp(β•Vsquare (t))/(( exp(β•Vsquare(t)) + ( exp(β•Vcircle(t)))]. Model fits were estimated by negative log likelihoods (smaller values indicate better fit).
The TD model could not be fitted or gave aberrant α or β values (α = 1 or 0; β = 0) for three subjects. This was caused by complete reliance on a win-stay loose-shift strategy (1 subject), frequent switches in choice following absence of pain, which was caused by use of an irrelevant strategy (1 subject), or numerous missing responses (20% missing; 1 subject). These 3 subjects were excluded from further analyses because their choices revealed that they were not behaving in accordance with the experience-based, incremental, type of learning under study5. The average α and β values for the remaining participants were then used to estimate their trial-by-trial expected values (Vsquare (t) and Vcircle(t)) and prediction errors (r(t) – Vchosen option(t ) ). Note that the TD model does not make any assumption about participants’ conscious expectations. Rather, expected values estimates reflect latent variables that are necessary for learning to avoid pain, but the conscious or unconscious nature of this learning process remains unspecified.
Logistic regression model
Participants’ choices were also analyzed with a logistic regression model predicting the chances of switching choices as a function of pain delivered over the 6 previous trials.
fMRI data analyses
model-based PE analysis
Statistical analyses were conducted using the general linear model framework implemented in SPM8. In a first model, Boxcar regressors, convolved with the canonical hemodynamic response function, modeled periods of decision (onset of decision period to response; mean reaction time = 732 ± 251 ms), anticipation (4 s), outcome onset (1 s) and outcome period (8 s). The decision to use the first second of the stimulation as representing the onset of the stimulation was based on continuous pain ratings obtained in the first pre-scan session suggesting that this is the moment when subjects begin to feel the thermal stimulation (see Supplementary Fig. 1). Outcome (pain = 1, no stimulus = –1) and aversive PE estimates were added as parametric modulators on all regressors (SPM orthogonalization option turned off). The inter-trial interval was used as an implicit baseline. The 6 runs were concatenated for each subject. A high-pass filter of 180 seconds was used. Other regressors of non-interest (nuisance variables) included a) “dummy” regressors coding for each run (intercept for each run); b) linear drift across time within each run; c) the 6 estimated head movement parameters (x, y, z, roll, pitch, and yaw), their mean-zeroed squares, their derivatives, and squared derivative for each run (total 24 columns); d) indicator vectors for outlier time points identified based on their multivariate distance from the other images in the sample (see above). Results were cluster-corrected (p<0.05, FWE, two-tailed) with cluster-defining thresholds of p <0.001, p<0.01 and p<0.05 using AFNI's alphasim.
ROI axiomatic response profile analysis
In a second set of analyses aiming to characterize the profiles of activation across outcomes and expected probability of pain, trials within each type of outcome were binned into quartiles of expected probability of pain, resulting in 8 types of outcomes (2 outcomes (pain or no stimulus) * 4 quartiles (from least to highest expected probability of pain)). Mean activity was then extracted for each of the 8 regressors within either a priori PAG and VS. ROIs, or ROIs defined by the conjunction analysis (see below). The PAG a priori ROI was constructed by aligning three overlapping 6-mm spheres along the central aqueduct ([0 –24 –4; 0 –26 –6; 0 –29 –8]), and closely matched the findings of a recent meta-analysis on pain-processing in the PAG (Linnman, Moulton, Barmettler, Becerra, & Borsook, 2012a). The VS ROI was based on Rutledge et al. (2010)9 nucleus accumbens ROI and was comprised of three 5 mm spheres for each hemisphere ([8 13 –3; 12 13 –8; 9 13 –7; –8 13 –3; –12 13 –8; –9 13 –7 ]).
In order to test whether or not activity profiles the PAG and VS ROIs integrate outcome information with prior expectations into an aversive PE signal, we employed an axiomatic approach initially developed to test necessary and sufficient activity for a broad class of PE models Because our objective was to identify regions that encode aversive PEs, we specialized these axioms to the case of an aversive prediction error and a learned, continuously graded punishment expectancy by making particular assumptions about the sign and monotonicity of effects. This approach reduces the quite general axioms to more familiar algebraic tests, notably separate tests for magnitude and expectation effects, which correspond to the two algebraic components of PEs (PE = magnitude – expectation; see also 6,8 for a similar approach). Moreover, in addition to the reward and expectancy components tested in those studies, we also test a third axiom, which specifies that expectation and magnitude effects are properly registered to one another, resulting in identical response amplitudes when outcomes are fully predicted. Finally, one difference between our axiomatic approach and the one previously used by Rutledge et al.9 is that we define reward expectancy as estimated from the fit of learning model to choice behavior. This is because in our task, participants’ expectations were not explicitly instructed but were instead derived from their reinforcement history and therefore had to be computationally estimated before being used to test the axioms for PEs.
The three axiomatic tests used to identify aversive PE signals are described below. They are derived from the more general axioms of Caplin and Dean49 by introducing specific, plausible assumptions about the aversive case— namely, that higher pain is always more aversive than lower pain (monotonicity in pain intensity) and that high vs. low expectancies are similarly monotonic. With these assumptions, Axiom #1 (consistent prize ordering: the outcome effect) stipulates that activity for pain outcomes should be higher then no stimulus outcomes. This axiom was tested by a simple t-test of the difference between averaged values for the 4 pain and 4 no pain quartiles. Axiom #2 (consistent lottery ordering: the expectancy effect) stipulates that activity should decrease with increasing expected probability of pain. This axiom was tested by separately testing the slopes of regressions lines passing through the 4 quartiles for pain and no pain trials, using a non-parametric multi-level sign permutation test (1000 bootstrap samples). Finally, Axiom #3 (no surprise equivalence: that the expectancy and outcome effects have the correct relationship to one another) stipulates that completely predicted outcomes should generate equivalent responses. This axiom was tested by a simple t-test comparing activity for the highest quartile of expected pain for pain trials, and lowest quartile of expected pain for no pain trials. We note that pain adaptation processes such as sensitization and habituation can cause pain itself to behave like PEs in some respects; for example, both pain and aversive PEs may decrease across trials and vary inversely with the intensity of prior pain50, causing a stronger partial overlap between aversive PE signals and pain itself. However, this effect explains only some of the effects tested in Axiom #2 (those on pain trials). It does not account for the effects tested under Axiom #1 or Axiom #3, or effects on no-pain trials tested under Axiom #2. In addition, it does not account for experimental effects such as effects of placebo instructions, tested in Study 3. Thus, the axiomatic tests provide a strong test of aversive PE-related signal properties.
Conjunction analysis
In order to specifically test for the expected probability of pain within pain and no stimulus trials (axiom #2), we modeled separately pain and no stimulus trials and included expected probability of pain as parametric modulators for pain and no stimulus trials. We then looked at the conjunction between the 3 relevant contrast maps (pain > no stimulus, expected probability of pain within pain trials, expected probability of pain within no stimulus trials), which were cluster-corrected (p<0.05, FWE, one-tailed) with a cluster-defining threshold of p<0.05 using AFNI's alphasim.
Dynamic causal models
In order to explore how the 7 different regions identified in the previous analysis (aversive PE: midbrain; pain-specific PE: aMCC, OFC, dmPFC; expected value: vmPFC, putamen, hippocampus) interacted to generate aversive PE signals, we compared several probable dynamic causal models (DCM) with a Bayesian model selection (BMS) procedure27. Based on the principles governing RL models (Fig. 2a), regions that encode aversive PEs (PAG) should receive converging input from those that encode expectancies (vmPFC, putamen, hippocampus) and primary reinforcement (nociceptive) signals. Regions important for action value and decision-making (aMCC, OFC, and dmPFC) may receive converging PE and primary reinforcement signals.
Because of the large number of possible models, we began by defining a model limited to brain correlates of RL model-based effects (PAG, vmPFC, putamen, hippocampus). We constrained this model by making two assumptions: 1) primary nociceptive afferents directly project to PAG28, and 2) expected avoidance value is conveyed to the PAG through one or more of the three expected value structures (green in Fig. 3). We used Bayesian model selection (BMS) to evaluate 32 plausible models, which varied systematically in their projections to the midbrain and connections among expected value-related regions (see Supplementary Fig. 7), and tested the most likely model against 7 other close variants27 (see Supplementary Fig. 8). Overall, the most likely configuration given our data is shown in Figure 4 (black and green portions only). In this model, vmPFC projects most directly to PAG, and avoidance value is most closely related to the putamen, which transmits value information to vmPFC. Though this procedure cannot definitively isolate causal relationships among regions, this model provides a plausible working model considering the direct anatomical projections from vmPFC to PAG30.
We then extended the model to include other regions that may encode avoidance value and related properties. Based on existent animal models of fear conditioning1,18, we posited that these regions receive the PE signals generated in PAG. Moreover, based on known anatomical projections of the PAG, we constrained the space of possible models by assuming that PE signals could be directly conveyed to the OFC and aMCC32, and indirectly to the dmPFC through either aMCC or OFC. However, as the sources of expected value signals to these regions are relatively less informed by the existent literature, we allowed these regions to be functionally connected to any of the three regions encoding expected value signals (i.e., vmPFC, putamen and hippocampus). Within these constraints, we evaluated 27 models that systematically varied connections among avoidance updating-related regions (blue) and relationships with expected value-related regions (green; see Supplementary Fig. 9), and 16 additional models closely related to the best-fitting model and including modulatory nociceptive inputs (see Supplementary Fig. 10). The best model overall is shown in Figure 4, and included a) direct connections from both putamen and midbrain to OFC and aMCC, with dmPFC effects mediated by OFC, and b) modulatory effects of noxious input to putamen → OFC, putamen → aMCC, and midbrain → aMCC connections.
Study 2 – Comparison with reward prediction errors
Participants
Twenty-one participants (mean age, 19.3 years; range, 18–28; ten females) took part in the study. Informed consent was obtained in a manner approved by the New York University Committee on Activities Involving Human Subjects.
Monetary reward task
In the experimental task (Supplementary Fig. 2ab; see also23), on each of 300 trials, participants chose one of four presented face stimuli and then received monetary feedback. Participants then received binary reward feedback, a $0.25 ‘win’ outcome represented by an image of a quarter-dollar and a $0.00 ‘miss’ outcome represented by a phase-scrambled image of a quarter-dollar. Participants were instructed that each face option was associated with a different probability of reward, that these probabilities could change slowly, and that their goal was to attempt to find the most rewarding option at a given time in order to earn the most money. Across the 300 trials in the experiment, the reward probabilities diffused gradually according to Gaussian random walks, so as to encourage continual learning. Unbeknownst to the participants, the faces were grouped into equivalent pairs.
Imaging procedure
Whole-brain imaging was conducted on a 3.0-T Siemens Allegra head-only MRI system at NYU's Center for Brain Imaging, using a Nova Medical NM-011 head coil. Functional images were collected using a gradient echo T2*-weighted echoplanar (EPI) sequence with BOLD contrast (TR = 2000 ms, TE = 15 ms, flip angle = 82, 3 · 3 · 3 mm voxel size; 33 contiguous oblique-axial slices), tilted on a per-participant basis approximately 23 degree off of the AC–PC axis to optimize sensitivity to signal in the orbitofrontal cortex and the medial temporal lobe. The task was scanned in four blocks each of 310 volumes (10 min 20 s). The task was scanned in four blocks each of 310 volumes (10 min20 s).
Behavioral analysis
Participants’ choices were analyzed with a similar temporal-difference (TD) model to the one used for the analysis of pain-related aversive PEs, with the exception that an additional parameter accounted for the generalization of learned values from one face of a pair to the other.
Imaging analyses and results
Preprocessing and data analysis was performed using Statistical Parametric Mapping software (SPM5; Wellcome Department of Imaging Neuroscience, Institute of Neurology, London, UK). After realignment and normalization, images were resampled to 2-mm cubic voxels, smoothed with an 8-mm FWHM Gaussian kernel, and filtered with a 128-s high-pass filter. In order to identify the structures encoding appetitive prediction errors, activity at outcome delivery was correlated with the trial-by-trial reward PE estimates derived from the computational TD model. Finally, we extracted the mean activity related to these appetitive PEs in the periaqueductal gray (PAG) and ventral striatum (VS) regions of interest (ROIs) used in previous analyses (see Fig. 2), and compared it to pain-related aversive PE signals (see Supplementary Fig. 1) extracted from the same ROIs.
Study 3 – Comparison of different pain levels
Participants
Fifty healthy participants completed the study (mean age = 25.1, range = 18–52 years; 27 females). All participants gave informed consent and the experiment was approved by the institutional review board of the University of Colorado Boulder.
Thermal stimulation
Thermal stimulation was delivered to the volar surface of the left inner forearm using a 16×16 mm Peltier thermode (Medoc). Each stimulus lasted 11 seconds with 1.75 s ramp-up and ramp-down periods and 7.5 s at target temperature. Stimulation temperatures were 46, 47 and 48°C, and in between stimuli the thermode maintained a baseline temperature of 32°C.
Experimental task
This pain-learning task consisted of 6 runs of 8 trials each, and alternated between placebo and control runs (in counterbalanced order). In the placebo runs, the thermode was placed on a skin site that had been pretreated with a placebo analgesic cream. In the control runs, the thermode was placed on a site that had not been pretreated. During both the placebo and control runs, participants were presented with two visual cues (geometric shapes). One cue was always followed by a 46°C (low pain) or a 47°C (medium pain) thermal stimulus, and the other cue by a 47°C (medium pain) or a 48°C (high pain) thermal stimulus, in 50% of the trials each (see Supplementary Fig. 3a). Participants were not informed about these contingencies.
Each trial started with the presentation of the two cues randomly displayed at the left and right side of the screen for 4 s, during which participants selected the cue that they thought was predictive of the least pain, by means of a left or right button press. One to 3 s later the computer selected a cue, alternating between the high and the low cue. The computer's selection was shown for 3 seconds, and was immediately followed by a thermal stimulation. Note that the stimulation temperature was contingent on the computer's—not the participant's —cue selection. Nine to 13 s after the thermal stimulation, a pain-rating scale was presented for 6 s, and participants rated their experienced pain using a trackball. The rating period was followed by a 9–13 s inter-trial interval. During the stimulation, post-stimulation and inter-trial intervals, a fixation cross was presented at the center of the screen.
Imaging procedure
Whole-brain fMRI data were acquired on a Siemens 3T Trio scanner at the Center for Innovation and Creativity (CINC) in Boulder. Functional images were acquired with an echo-planar imaging sequence (TR = 1300 ms, TE = 25 ms, field of view = 220 mm, 3.4×3.4×3.0 mm voxels, 26 slices). Each run lasted 394 s (303 TRs).
Imaging analyses and results
The preprocessing procedure was identical to the one used in the main experiment (see online methods). Boxcar regressors, convolved with the canonical hemodynamic response function, were constructed to model: i) the periods in which visual stimuli other than the fixation cross were presented (i.e., the cues and the rating-scale); ii) participants’ cue-selection times; and iii) participants’ pain-rating times. Because the onset of the stimulation is non-informative of the pain level participants received, we used continuous pain ratings for three levels of thermal stimulations of identical durations (11s; 46.5°C, 47.5°C, 48.5°C) to identify the time at which the different temperatures could be clearly distinguished. We identified the period between 4 and 10 seconds as the one conveying information about the pain level received, and therefore modelled thermal stimuli as three successive time-windows: iv) onset (0–4s), v) middle (4–10s) and offset (10–11s) (see Supplementary Fig. 3d).
We then extracted mean activity in the PAG ROI (see Fig. 2 and Supplementary Fig. 3c) during this middle pain-informative window for the three different levels of temperature, the two different levels of predictive cues, and the placebo vs. control condition. In order to test if the PAG also encoded aversive PEs in an intensity-dependent manner, we adapted study 1 axioms by making the additional assumption that more intense noxious stimulus intensities should be more aversive (i.e., monotonicity of aversiveness with stimulus intensity).
In order to test for axiom #2, we looked more specifically at activity in response to the medium temperature, which could be preceded by either low or high predictive cues. Axiom # 2 requires that aversive PEs should be higher when less pain is predicted. In the current experiment, this should translate into higher activity for low vs. high cues. Moreover, if PEs are also sensitive to explicit predictions about pain, PEs should be higher during the placebo vs. control condition (see Supplementary Fig. 3b).
Finally, axiom # 3 stipulates that there shouldn't be any difference in signal strength between fully expected outcomes of different intensities. Unfortunately, this axiom cannot be fully tested here because the outcome is never fully predicted by the cue (50%–50%), and the non-linear relationship between temperature and pain makes it difficult to precisely estimate expectations. Minimally, there should be a partial overlap between low and high cue lines allowing for certain temperature levels to be associated with equivalent prediction error signals, which again entails that responses to the medium temperature should be higher for low vs. high cues.
Supplementary Material
Acknowledgments
This work was supported by a grant from the National Institute on Drug Abuse (NIDA) to T.D.W., D.S. and N.D., and by Canadian Institute of Health Research (CIHR) and Fonds de Recherche en Santé du Québec (FRSQ) fellowships to M.R. We would also like to thank Damon Abraham and Asa Pingree for help with data collection, and Anjali Krishnan, Liane Schmidt and Lauren Atlas for help with data analyses.
Footnotes
Author Contributions
M.R., N.D., D.S., and T.D.W. designed the study. M.R. performed the study. M.R., N.D. and T.D.W. analysed the data, and M.R., N.D., D.S., and T.D.W. wrote the paper. E.W., N.D. and D.S. designed study 2, E.W. performed study 2, and E.W., N.D., D.S. and M.R. analysed the data. M.J. and T.D.W. designed study 3, M.J. performed the study, and M.J., T.D.W. and M.R. analysed the data.
REFERENCES
- 1.McNally GP, Johansen JP, Blair HT. Placing prediction into the fear circuit. Trends Neurosci. 2011;34:283–92. doi: 10.1016/j.tins.2011.03.005. [DOI] [PMC free article] [PubMed] [Google Scholar]
- 2.Seymour B, et al. Nature. 2004;Temporal difference models describe higher-order learning in humans.429:664–667. doi: 10.1038/nature02581. [DOI] [PubMed] [Google Scholar]
- 3.Hollerman JR, Schultz W. Dopamine neurons report an error in the temporal prediction of reward during learning. Nat. Neurosci. 1998;1:304–9. doi: 10.1038/1124. [DOI] [PubMed] [Google Scholar]
- 4.O'Doherty JP, Hampton A, Kim H. Model-based fMRI and its application to reward learning and decision making. Ann. N. Y. Acad. Sci. 2007;1104:35–53. doi: 10.1196/annals.1390.022. [DOI] [PubMed] [Google Scholar]
- 5.Daw ND. In: Decis. Making, Affect. Learn. Delgado MR, Phelps EA, Robbins TW, editors. Oxford University Press; 2011. pp. 3–38. [Google Scholar]
- 6.Behrens TEJ, Hunt LT, Woolrich MW, Rushworth MFS. Associative learning of social value. Nature. 2008;456:245–9. doi: 10.1038/nature07538. [DOI] [PMC free article] [PubMed] [Google Scholar]
- 7.Li J, Daw ND. Signals in human striatum are appropriate for policy update rather than value prediction. J. Neurosci. 2011;31:5504–11. doi: 10.1523/JNEUROSCI.6316-10.2011. [DOI] [PMC free article] [PubMed] [Google Scholar]
- 8.Niv Y, Edlund JA, Dayan P, O'Doherty JP. Neural prediction errors reveal a risk-sensitive reinforcement-learning process in the human brain. J. Neurosci. 2012;32:551–62. doi: 10.1523/JNEUROSCI.5498-10.2012. [DOI] [PMC free article] [PubMed] [Google Scholar]
- 9.Rutledge RB, Dean M, Caplin A, Glimcher PW. Testing the reward prediction error hypothesis with an axiomatic model. J. Neurosci. 2010;30:13525–36. doi: 10.1523/JNEUROSCI.1747-10.2010. [DOI] [PMC free article] [PubMed] [Google Scholar]
- 10.Seymour B, et al. Opponent appetitive-aversive neural processes underlie predictive learning of pain relief. Nat. Neurosci. 2005;8:1234–40. doi: 10.1038/nn1527. [DOI] [PubMed] [Google Scholar]
- 11.Seymour B, Daw ND, Roiser JP, Dayan P, Dolan R. Serotonin selectively modulates reward value in human decision-making. J. Neurosci. 2012;32:5833–42. doi: 10.1523/JNEUROSCI.0053-12.2012. [DOI] [PMC free article] [PubMed] [Google Scholar]
- 12.Yacubian J, et al. Dissociable systems for gain- and loss-related value predictions and errors of prediction in the human brain. J. Neurosci. 2006;26:9530–7. doi: 10.1523/JNEUROSCI.2915-06.2006. [DOI] [PMC free article] [PubMed] [Google Scholar]
- 13.Ploghaus A, et al. Learning about pain: the neural substrate of the prediction error for aversive events. Proc. Natl. Acad. Sci. U. S. A. 2000;97:9281–6. doi: 10.1073/pnas.160266497. [DOI] [PMC free article] [PubMed] [Google Scholar]
- 14.Li J, Schiller D, Schoenbaum G, Phelps EA, Daw ND. Differential roles of human striatum and amygdala in associative learning. Nat. Neurosci. 2011;14:1250–2. doi: 10.1038/nn.2904. [DOI] [PMC free article] [PubMed] [Google Scholar]
- 15.Schiller D, Levy I, Niv Y, LeDoux JE, Phelps EA. From fear to safety and back: reversal of fear in the human brain. J. Neurosci. 2008;28:11517–25. doi: 10.1523/JNEUROSCI.2265-08.2008. [DOI] [PMC free article] [PubMed] [Google Scholar]
- 16.Delgado MR, Li J, Schiller D, Phelps EA. The role of the striatum in aversive learning and aversive prediction errors. Philos. Trans. R. Soc. Lond. B. Biol. Sci. 2008;363:3787–800. doi: 10.1098/rstb.2008.0161. [DOI] [PMC free article] [PubMed] [Google Scholar]
- 17.Hindi Attar C, Finckh B, Büchel C. The influence of serotonin on fear learning. PLoS One. 2012;7:e42397. doi: 10.1371/journal.pone.0042397. [DOI] [PMC free article] [PubMed] [Google Scholar]
- 18.Johansen JP, Tarpley JW, LeDoux JE, Blair HT. Neural substrates for expectation-modulated fear learning in the amygdala and periaqueductal gray. Nat. Neurosci. 2010;13:979–86. doi: 10.1038/nn.2594. [DOI] [PMC free article] [PubMed] [Google Scholar]
- 19.Stephan KE, et al. Dynamic causal models of neural system dynamics:current state and future extensions. J. Biosci. 2007;32:129–44. doi: 10.1007/s12038-007-0012-5. [DOI] [PMC free article] [PubMed] [Google Scholar]
- 20.Schönberg T, Daw ND, Joel D, O'Doherty JP. Reinforcement learning signals in the human striatum distinguish learners from nonlearners during reward-based decision making. J. Neurosci. 2007;27:12860–7. doi: 10.1523/JNEUROSCI.2496-07.2007. [DOI] [PMC free article] [PubMed] [Google Scholar]
- 21.Gallistel CR. The importance of proving the null. Psychol. Rev. 2009;116:439–53. doi: 10.1037/a0015251. [DOI] [PMC free article] [PubMed] [Google Scholar]
- 22.Garrison J, Erdeniz B, Done J. Prediction error in reinforcement learning: a meta-analysis of neuroimaging studies. Neurosci. Biobehav. Rev. 2013;37:1297–310. doi: 10.1016/j.neubiorev.2013.03.023. [DOI] [PubMed] [Google Scholar]
- 23.Wimmer GE, Daw ND, Shohamy D. Generalization of value in reinforcement learning by humans. Eur. J. Neurosci. 2012;35:1092–104. doi: 10.1111/j.1460-9568.2012.08017.x. [DOI] [PMC free article] [PubMed] [Google Scholar]
- 24.Satpute AB, et al. Identification of discrete functional subregions of the human periaqueductal gray. Proc. Natl. Acad. Sci. U. S. A. 2013;110:17101–6. doi: 10.1073/pnas.1306095110. [DOI] [PMC free article] [PubMed] [Google Scholar]
- 25.Beissner F, Baudrexel S. Investigating the human brainstem with structural and functional MRI. Front. Hum. Neurosci. 2014;8:116. doi: 10.3389/fnhum.2014.00116. [DOI] [PMC free article] [PubMed] [Google Scholar]
- 26.Keay KA, Bandler R. Parallel circuits mediating distinct emotional coping reactions to different types of stress. Neurosci. Biobehav. Rev. 2001;25:669–78. doi: 10.1016/s0149-7634(01)00049-5. [DOI] [PubMed] [Google Scholar]
- 27.Schmidt L, Lebreton M, Cléry-Melin M-L, Daunizeau J, Pessiglione M. Neural mechanisms underlying motivation of mental versus physical effort. PLoS Biol. 2012;10:e1001266. doi: 10.1371/journal.pbio.1001266. [DOI] [PMC free article] [PubMed] [Google Scholar]
- 28.Millan MJ. The induction of pain: an integrative review. Prog. Neurobiol. 1999;57:1–164. doi: 10.1016/s0301-0082(98)00048-3. [DOI] [PubMed] [Google Scholar]
- 29.Brooks AM, Berns GS. Aversive stimuli and loss in the mesocorticolimbic dopamine system. Trends Cogn. Sci. 2013;17:281–286. doi: 10.1016/j.tics.2013.04.001. [DOI] [PubMed] [Google Scholar]
- 30.Price JL. Definition of the orbital cortex in relation to specific connections with limbic and visceral structures and other cortical regions. Ann. N. Y. Acad. Sci. 2007;1121:54–71. doi: 10.1196/annals.1401.008. [DOI] [PubMed] [Google Scholar]
- 31.Rangel A, Hare T. Neural computations associated with goal-directed choice. Curr. Opin. Neurobiol. 2010;20:262–70. doi: 10.1016/j.conb.2010.03.001. [DOI] [PubMed] [Google Scholar]
- 32.Herrero MT, Insausti R, Gonzalo LM. Cortically projecting cells in the periaqueductal gray matter of the rat. A retrograde fluorescent tracer study Cortical injections. 1991;543:201–212. doi: 10.1016/0006-8993(91)90029-u. [DOI] [PubMed] [Google Scholar]
- 33.Shackman AJ, et al. The integration of negative affect, pain and cognitive control in the cingulate cortex. Nat. Rev. Neurosci. 2011;12:154–67. doi: 10.1038/nrn2994. [DOI] [PMC free article] [PubMed] [Google Scholar]
- 34.Krasne FB, Fanselow MS, Zelikowsky M. Design of a neurally plausible model of fear learning. Front. Behav. Neurosci. 2011;5:41. doi: 10.3389/fnbeh.2011.00041. [DOI] [PMC free article] [PubMed] [Google Scholar]
- 35.Reynolds SM, Berridge KC. Emotional environments retune the valence of appetitive versus fearful functions in nucleus accumbens. Nat. Neurosci. 2008;11:423–5. doi: 10.1038/nn2061. [DOI] [PMC free article] [PubMed] [Google Scholar]
- 36.Tom SM, Fox CR, Trepel C, Poldrack RA. The neural basis of loss aversion in decision-making under risk. Science. 2007;315:515–8. doi: 10.1126/science.1134239. [DOI] [PubMed] [Google Scholar]
- 37.Kim H, Shimojo S, O'Doherty JP. Is avoiding an aversive outcome rewarding? Neural substrates of avoidance learning in the human brain. PLoS Biol. 2006;4:e233. doi: 10.1371/journal.pbio.0040233. [DOI] [PMC free article] [PubMed] [Google Scholar]
- 38.Boll S, Gamer M, Gluth S, Finsterbusch J, Büchel C. Eur. J. Neurosci. 1–10: 2012. Separate amygdala subregions signal surprise and predictiveness during associative fear learning in humans. [DOI] [PubMed] [Google Scholar]
- 39.Paton JJ, Belova MA, Morrison SE, Salzman CD. The primate amygdala represents the positive and negative value of visual stimuli during learning. Nature. 2006;439:865–70. doi: 10.1038/nature04490. [DOI] [PMC free article] [PubMed] [Google Scholar]
- 40.Linnman C, Moulton EA, Barmettler G, Becerra L, Borsook D. Neuroimaging of the periaqueductal gray: state of the field. Neuroimage. 2012;60:505–22. doi: 10.1016/j.neuroimage.2011.11.095. [DOI] [PMC free article] [PubMed] [Google Scholar]
- 41.Buhle JT, et al. Cognitive Reappraisal of Emotion: A Meta-Analysis of Human Neuroimaging Studies. Cereb. Cortex. 2013:1–10. doi: 10.1093/cercor/bht154. doi:10.1093/cercor/bht154. [DOI] [PMC free article] [PubMed] [Google Scholar]
- 42.Buhle JT, et al. Common representation of pain and negative emotion in the midbrain periaqueductal gray. Soc. Cogn. Affect. Neurosci. 2012 doi: 10.1093/scan/nss038. doi:10.1093/scan/nss038. [DOI] [PMC free article] [PubMed] [Google Scholar]
- 43.Wager TD, et al. Brain mediators of cardiovascular responses to social threat, part II: Prefrontal subcortical pathways and relationship with anxiety. Neuroimage. 2009;47:836–51. doi: 10.1016/j.neuroimage.2009.05.044. [DOI] [PMC free article] [PubMed] [Google Scholar]
- 44.Bartra O, McGuire JT, Kable JW. The valuation system: a coordinate-based meta-analysis of BOLD fMRI experiments examining neural correlates of subjective value. Neuroimage. 2013;76:412–27. doi: 10.1016/j.neuroimage.2013.02.063. [DOI] [PMC free article] [PubMed] [Google Scholar]
- 45.Roy M, Shohamy D, Wager TD. Ventromedial prefrontal-subcortical systems and the generation of affective meaning. Trends Cogn. Sci. 2012;16:147–156. doi: 10.1016/j.tics.2012.01.005. [DOI] [PMC free article] [PubMed] [Google Scholar]
- 46.Chib VS, Rangel A, Shimojo S, O'Doherty JP. Evidence for a common representation of decision values for dissimilar goods in human ventromedial prefrontal cortex. J. Neurosci. 2009;29:12315–20. doi: 10.1523/JNEUROSCI.2575-09.2009. [DOI] [PMC free article] [PubMed] [Google Scholar]
- 47.Milad MR, et al. Recall of fear extinction in humans activates the ventromedial prefrontal cortex and hippocampus in concert. Biol. Psychiatry. 2007;62:446–54. doi: 10.1016/j.biopsych.2006.10.011. [DOI] [PubMed] [Google Scholar]
- 48.Wunderlich K, Dayan P, Dolan RJ. Mapping value based planning and extensively trained choice in the human brain. Nat. Neurosci. 2012;15:786–91. doi: 10.1038/nn.3068. [DOI] [PMC free article] [PubMed] [Google Scholar]
- 49.Caplin A, Dean M. Axiomatic methods, dopamine and reward prediction error. Curr. Opin. Neurobiol. 2008;18:197–202. doi: 10.1016/j.conb.2008.07.007. [DOI] [PubMed] [Google Scholar]
- 50.Jepma M, Jones M, Wager TD. The dynamics of pain: evidence for simultaneous site-specific habituation and site-nonspecific sensitization in thermal pain. J. Pain. 2014;15:734–46. doi: 10.1016/j.jpain.2014.02.010. [DOI] [PMC free article] [PubMed] [Google Scholar]
Associated Data
This section collects any data citations, data availability statements, or supplementary materials included in this article.