

Abstract
Glucose transport in humans is a vital process which is tightly regulated by the endocrine system. Specifically, the insulin hormone triggers a cascade of intracellular signals in target cells mediating the uptake of glucose. Insulin signaling triggers cellular relocalization of the glucose transporter protein GLUT4 to the cell surface, which is primarily responsible for regulated glucose import. Pathology associated with the disruption of this pathway can lead to metabolic disorders, such as type II diabetes mellitus, characterized by the failure of cells to appropriately uptake glucose from the blood. We describe a novel simulation tool of the insulin intracellular response, incorporating the latest findings regarding As160 and GEF interactions. The simulation tool differs from previous computational approaches which employ algebraic or differential equations; instead, the tool incorporates statistical variations of kinetic constants and initial molecular concentrations which more accurately mimic the intracellular environment. Using this approach, we successfully recapitulate observed in vitro insulin responses, plus the effects of Wortmannin-like inhibition of the pathway. The developed tool provides insight into transient changes in molecule concentrations throughout the insulin signaling pathway, and may be employed to identify or evaluate potentially critical components of this pathway, including those associated with insulin resistance. In the future, this highly tractable platform may be useful for simulating other complex cell signaling pathways.
Keywords: insulin, metabolism, computational modeling, GLUT4, queuing theory
Introduction
Insulin is known to be essential for regulating glucose levels intracellularly and in the blood, as well as contributing to other carbohydrate and lipid metabolism in mammals (Banting, 1937). The insulin molecule is a small peptide hormone manufactured in the beta cells of the pancreas (Gallenberger et al., 2012). Interruption of insulin signaling can result in high blood glucose (hyperglycemia), which is associated with both life-long health complications and acute life-threatening disease. Among these are mild insulin resistance, diabetes mellitus, and metabolic syndrome (Beale, 2012). Unfortunately, the underlying etiologies of these diseases are poorly understood. Understanding and simulating the cellular response to insulin could lead to the development of new treatments.
Many early processes in the insulin signaling pathway are clearly understood, with downstream processes being the focus of the most recent studies. The key feature of insulin signaling is the process whereby the cell translocates glucose transporters (GLUT4) from intracellular endosomes to the cell surface, where they function via facilitated diffusion to import glucose from the extracellular fluid (James et al., 1988). For this to take place, insulin signaling activates intracellular pathways which facilitate GLUT4 translocation, in addition to ancillary cellular functions not directly related to glucose uptake (Leto & Saltiel, 2012). Thus, previous computational models, as well as the proposed simulation approach described herein, annotate only the molecular interactions shown or anticipated to relate to glucose uptake. Moreover, eventual recycling of insulin receptors and GLUT4 is an added dimension of downstream regulation that is not addressed in this current approach.
Figure 1 provides a simplified overview of the insulin signaling pathway. In Figure 1A, following insulin release into the bloodstream, insulin is detected by target cells via binding to the insulin receptor. Once insulin and the receptor have engaged, the insulin receptor undergoes autophosphorylation. The signal is propagated as activated insulin receptors phosphorylate downstream substrates. Insulin receptor substrates then activate phosphoinositide 3-kinase (PI3K) which converts membrane lipids to phosphatidylinositol (3,4,5)-triphosphate. Accumulation of phosphatidylinositol (3,4,5)-triphosphates are necessary to Akt and phosphoinositide-dependent kinase (PDK) interaction, which results in the double phosphorylation of Akt. Figure 1B shows the effector functions of insulin signaling following Akt activation. Double phosphorylated Akt is able to turn off GTPase activating proteins (GAPs), one of which is the Akt substrate of a 160 kDa size (As160). An unstimulated cell contains active GAPs that are able to prevent GLUT4 vesicle translocation through the prevention of accumulating RabGTP in GLUT4 endosomes. The inactivation of GAPs such as the As160 through the insulin stimulated PI3K/Akt cascade results in the accumulation of RabGTP's and ultimately GLUT4 translocation.
Figure 1.

Cartoon representation of the insulin dependent GLUT4 translocation from insulin binding to its receptor to GLUT4-containing vesicles translocating to the outer cell membrane. This figure summarizes the signal amplification pathway from insulin receptor binding to the ultimate product of GLUT4 vesicle translocation. Details such as subunit composition (e.g., the insulin receptor tetramer), phosphorylation sites or mechanism, and relative concentrations are not shown to provide simplicity. A: Insulin binding triggers a series of phosphorylation events which propagates the insulin signal. B: Downstream Akt activation leads to GLUT4 translocation to the cell surface. The representation highlights the recently described role of the GAP As160 in regulating Rab dependent vesicular translocation. A complete description is available in the text, and abbreviations are found in the glossary. Image designed by Avery Mazor, © 2014.
Traditionally, signaling pathways have been modeled using sets of differential equations describing changes in molecular concentrations at rest and in response to upstream signals (Chou and Voit, 2009). This approach, albeit useful, fails to readily incorporate random variations of the kinetic constants (e.g., due to local temperature variations) and local molecule concentrations (e.g., due to Brownian motion). To incorporate such random variation, which more accurately mimics the intracellular environment, the proposed simulation platform mimics transitions of molecules involved in insulin signaling pathway independently inside each considered cell as shown in Figure 2. Distinct from the traditional approach, this “queuing theory” approach has been successfully used to accurately and rapidly model packet transfer in data-dense telecommunication networks (Giambene, 2005). Such an approach was recently reported to accurately delineate non-viral gene delivery intracellularly (Wysocki et al., 2012).
Figure 2.

Block model of the insulin signal transduction pathway. Schematic of the computational model of insulin mediated GLUT4 translocation. Each block represents one intermediate in the signal transduction pathway from insulin recognition to GLUT4 vesicle translocation. Arrows between blocks are representative of a metabolic reaction between those two intermediates. The rate of most metabolic reactions have been determined experimentally by others. Labels on arrows refer to the enzyme kinetics attributed to that reaction. The equations that correspond to these enzyme kinetics can be found in Table II. Component abbreviations can be found in the glossary. This figure additionally illustrates the relative level of understanding for kinetic parameters involved in different parts of this pathway.
To confirm that the simulation accurately models cellular responses, we compare our data to published results largely derived from human adipocyte studies. The simulation yielded time-dependent changes in GLUT4 present at the cell surface consistent with published observations for various insulin concentrations (Martin et al., 2006). Moreover, the platform accurately simulated abnormal cellular conditions, such as inhibition of phosphoinositide 3-kinase (Clarke et al., 1994; Hara et al., 1994). Furthermore, the simulator was employed to independently demonstrate the critical role of the PTEN protein in insulin response. Whereas previous models often mimicked known insulin responses, the proposed simulation offers additional advantages. First, individual component concentrations and kinetic constants can be derived if unknown or not well established (see Fig. 2, shaded area). Second, the model is able to mimic a configurable cell population number. Finally, the developed platform is extremely rapid: simulating responses within 100 cells for 1 min required less than 10 compute minutes. Such rapid calculation can therefore be used to extensively explore variations of concentrations or kinetics resulting in promotion of or interference with the insulin pathway. Such an approach may help identify additional key steps in the insulin pathway. Ultimately, this “queuing theory” approach may be more broadly employable to additional signaling pathways. As a first step, further validation of the simulation could verify that cells other than adipocytes respond to insulin in a similar fashion.
Materials and Methods
Kinetic constants and molecular concentration values were obtained via a Pubmed search for publications within the last 50 years. Particularly useful were previous reports which included multiple compiled, derived, or observed values (Faratian et al., 2009; Hatakeyama et al., 2003; Kozka et al., 1995; Sedaghat et al., 2002; Shin et al., 2005; Stephan et al., 2009). Values that were not available in the literature were estimated (below). Error values associated with constants were used in the stochastic model when provided by sources. To simplify the branching effect of downstream components of Akt in the insulin mediated signal cascade, we use As160 to refer to multiple family members of Rab GAPs involved in GLUT4 translocation. Thus, the derived kinetics for GAP effector functions are associated with the family of downstream Akt effectors as a whole rather than the primary target of As160. This is due to previous studies that have shown that, while As160 may be the primary target of Akt in the insulin mediated pathway, it is not the only one (Eguez et al., 2005).
During simulations, each simulated cell was calculated independently; that is, concentrations of each molecule in the signaling chain (Fig. 2) is stochastic, and bound by the provided error values. Implementation of the queuing theory approach causes that the actual concentrations of given molecule types in the cell are simulated as separate storages (queues) for each cell. The probability of a movement happening at any time instant from one queue to the next is determined by the relevant reaction speed. Movements between storages happen at a particular time instant if a number randomly drawn from the interval [0,1] at that time instant is smaller than the reaction speed governing the movement. After simulations have been performed for every considered cell, the results are averaged over the cell population. This queuing approach is therefore distinct from molecular dynamic simulations and stochastic chemical kinetics. The current approach is most similar to modeling information packets trafficking through a computer network using queuing theory which utilizes the given service rates of particular nodes rather than by solving Maxwell's equations for the individual links. Although differential equations are excellent tool to model continuous time analog processes, discrete processes are better modeled using difference equations that for random scenarios are well represented by the queues, where the input to the queue is described by one difference equation and the output by another difference equation. Connecting those queues into a network thus models a set of difference equations, where the lengths of the queues provide instantaneous solutions. Such a queuing network can be easily used to model scenarios where the arrival/service rates change dynamically depending on the lengths of some queues in the system or where changes happen randomly.
Most of the kinetic constants used for the simulation are given in the literature with quite wide margins, up to ±80%. Therefore, in the developed platform, the randomization of their values was adopted through the following formula:
| (1) |
where k(i) is the value of the constant at the ith time instant, k is the average value of the constant, m is the margin for the constant, such that
| (2) |
and x(i) are Gaussian distributed random variable with a zero mean and a variance equal to 1 drawn at every consecutive time instant. A similar approach was taken in randomization of initial concentrations; however, the concentrations were randomized only once per cell, at the beginning of simulations, that is for i = 0. For constants/concentrations that have no margins available in literature, a ±20% range was adopted, although the model is readily adjustable to different ranges. Moreover, the simulation prohibits the very unlikely event of kinetic constants being negative values, making it zero instead. Although Gaussian distributions were assumed in the model, any other (e.g., uniform) distribution can be used if desired.
In order to estimate values of kinetic constants V45, V46, (Fig. 2) and to approximate suitable ranges for the kinetic constants needed to calculate V39 and the steady state number of free RabGTP molecules in a cell, the final stages of the process have been computationally imputed. A constant number of GLUT4 molecules localized at the cell surface in the absence of insulin was assumed, as shown by Kozka et al. (1995) to be 18,000–20,000 per cell. Published rates of GLUT4 vesicle translocation without insulin is 58,000 GLUT4 transferred to the plasma membrane per minute (Kozka et al., 1995), and 10 RabGTP molecules are required to move one vesicle containing 20 GLUT4 molecules (Carvalho et al., 2004; Kessler et al., 2000). Based on these values, and assuming that the formats of V45 and V46 are:
| (3) |
| (4) |
where RabGTP, Glut4Membrane, and As160 are the number of molecules of free RabGTP molecules in the cell, the number of Glut4 molecules at the cell membrane, and the number of As160 molecules in a cell, at a given time instant, respectively, one can calculate the estimates for k45 and k46 (see Tables I and II). Because less is known about the interactions between As160-RabGTPase and SNARE engagement of the GLUT4 vesicle, it is still possible that a yet unobserved rate-limiting step may occur in this gap; however, this is unlikely as our simulation accurately models multiple previous studies (Figs. 3 and 4).
Table I.
Glossary of terms, including definitions for symbols and abbreviations.
| I = insulin |
| IR = insulin receptor |
| IR-I = single bound insulin to insulin receptor |
| pIR-I = phosphorylated single bound insulin to insulin receptor |
| |pIR-I| = internalized phosphorylated single bound insulin to insulin receptor |
| pIR-II = double bound insulin to insulin receptor |
| |pIR-II| = internalized phosphorylated double bound insulin to insulin receptor |
| IRS1/3 = insulin receptor substrates 1 through 3 |
| pIRS1/3 = phosphorylated insulin receptor substrates 1 through 3 |
| PI3K = phosphatidylinositol 3-kinase |
| pIRS1/3-PI3K = phosphorylated insulin receptor substrates 1 through 3, phosphatidylinositol 3-kinase, complex |
| PI3K* = activated phosphatidylinositol 3-kinase |
| pIRS1/3-PI3K* = phosphorylated insulin receptor substrates 1 through 3, activated phosphatidylinositol 3-kinase, complex |
| PI = phosphatidylinositol |
| PI3K*-PI = activated phosphatidylinositol 3-kinase, phosphatidylinositol, complex |
| PIP3 = phosphatidylinositol (3,4,5)-triphosphate |
| PI3K*-PIP3 = activated phosphatidylinositol 3-kinase, phosphatidylinositol (3,4,5)-triphosphate, complex |
| PTEN = phosphatase and tensin homolog |
| PTEN-PI = phosphatase and tensin homolog, phosphatidylinositol, complex |
| PTEN-PIP3 = phosphatase and tensin homolog, phosphatidylinositol (3,4,5)-triphosphate, complex |
| pPTEN = phosphorylated phosphatase and tensin homolog |
| PTEN-PTEN = phosphatase and tensin homolog, phosphatase and tensin homolog, complex |
| pPTEN-PTEN = phosphorylated phosphatase and tensin homolog, phosphatase and tensin homolog, complex |
| Akt = protein kinase B |
| Akt-PIP3 = protein kinase B, phosphatidylinositol (3,4,5)-triphosphate, complex |
| pAkt-PIP3 = phosphorylated protein kinase B, phosphatidylinositol (3,4,5)-triphosphate, complex |
| PDK = phosphoinositide dependent protein kinase |
| ppAkt-PIP3 = double phosphorylated protein kinase B, phosphatidylinositol (3,4,5)-triphosphate, complex |
| PP2A = protein phosphatase 2 |
| PP2A-Akt-PIP3 = protein phosphatase 2, protein kinase B, phosphatidylinositol (3,4,5)-triphosphate, complex |
| PP2A-pAkt-PIP3 = protein phosphatase 2, phosphorylated protein kinase B, phosphatidylinositol (3,4,5)-triphosphate, complex |
| PP2A-ppAkt-PIP3 = protein phosphatase 2, double phosphorylated protein kinase B, phosphatidylinositol (3,4,5)-triphosphate, complex |
| ppAkt = double phosphorylated protein kinase B |
| PP2A-Akt = protein phosphatase 2, protein kinase B, complex |
| PP2A-pAkt = protein phosphatase 2, phosphorylated protein kinase B, complex |
| PP2A-ppAkt protein phosphatase 2, double phosphorylated protein kinase B, complex |
| As160 = Akt substrate of 160 kDa |
| pAs160 = phosphorylated Akt substrate of 160 kDa |
| PP2A-pAs160 = protein phosphatase 2, phosphorylated Akt substrate of 160 kDa, complex |
| PP2A-As160 = protein phosphatase 2, Akt substrate of 160 kDa, complex |
| RabGTP = Rab G-protein in active guanosine triphosphate bound form |
| RabGTP-As160 = Rab G-protein in active guanosine triphosphate bound form, Akt substrate of 160 kDa, complex |
| RabGDP = Rab G-protein in inactive guanosine diphosphate bound form |
| GEF = guanine exchange factor |
| RabGDP-GEF = Rab G-protein in inactive guanosine diphosphate bound form, guanine exchange factor, complex |
| GLUT4 = glucose transporter type 4 |
| GAP = GTPase activating protein |
Table II.
Kinetic constants and reaction equations used within the simulation.
| Reaction equation | Kinetic constants | ± | Source | |
|---|---|---|---|---|
| V0 = k0*[I]*[IR] – k – 0*[IR-I] | k 0 | 0.06 | a | |
| k – 0 | 0.2 | |||
| V1 = k1*[IR-I] | k 1 | 2,500 | a | |
| V2 = k2*[pIR-I] | k 2 | 0.2 | a | |
| V3 = k3*[pIR-I] – k – 3*[|pIR-I|] | k 3 | 0.0021 | a | |
| k – 3 | 0.00021 | |||
| V4 = k4*[I]*[pIR-I] – k – 4*[pIR-II] | k 4 | 0.06 | a | |
| k – 4 | 20 | |||
| V5 = k5*[pIR-II] – k – 5*[|pIR-II|] | k 5 | 0.0021 | a | |
| k – 5 | 0.00021 | |||
| V6 = k6*{[IRS1/3]([pIR-I] + [pIR-II])}/[IR] – k – 7*[pIRS1/3] | k 6 | 4.16 | a | |
| k – 6 | 1.4 | |||
| V7 = k7*([pIRS1/3]*[PI3K] - kd,7*[pIRS1/3 – PI3K]) | k 7 | 3 | 1 | a,b |
| k d,7 | 1 | |||
| V8 = k8*[pIRS1/3-PI3K] – k – 8*[pIRS1/3-PI3K*] | k 8 | 300 | 30 | a,b |
| k – 8 | 0 | |||
| V9 = k9*[pIRS1/3-PI3K*] - k – 9*[pIRS1/3*PI3K*] | k 9 | 13,500 | b,c | |
| k – 9 | 0 | |||
| V10 = k10*[PI3K*] | V 10 | 900 | 130 | b,c |
| V11 = k11*([PI]*[PI3K*] – kd,11*[PI3K*-PI]) | k 11 | 0.03 | 0.006 | b,c |
| k d,11 | 140 | |||
| V12 = k12*[PI3K*-PI] | k 12 | 30 | b,c | |
| V13 = k13*[PI3K*-PIP3] | k 13 | 30 | c | |
| V14 = k14*([PIP3]*[PTEN] – kd,14*[PTEN-PIP3]) | k 14 | 8,000 | b,c | |
| k d,14 | 0.01 | 0.004 | ||
| V15 = k15*[PTEN-PIP3] | k 15 | 15 | 5 | c |
| V16 = k16*[PTEN-PI] | k 16 | 3.6 | 1 | c |
| V17 = Vmax,17*[PTEN]/(km,17 + [PTEN]) | V max,17 | 150 | 50 | c |
| k m,17 | 2 | |||
| V18 = k18*([PTEN]*[pPTEN] – kd,18*[pPTEN-PTEN]) | k 18 | 1 | 0.4 | c |
| k d,18 | 2.2 | |||
| V19 = kcat,19*[pPTEN-PTEN] | k cat,19 | 150 | c | |
| V20 = k20*[PTEN-PTEN] | k 20 | 150 | c | |
| V21 = k21*([PIP3]*[Akt] – kd,21*[Akt-PIP3]) | k 21 | 15,000 | b,c | |
| k d,21 | 20 | 6 | ||
| V22 = Vmax,22*[Akt-PIP3]/(km,22 + [Akt-PIP3]) | V max,22 | 15,000 | 5,000 | b,c |
| k m,22 | 0.1 | 0.035 | ||
| V23 = Vmax,23*[pAkt-PIP3]/(km,23 + [pAkt-PIP3]) | V max,23 | 15,000 | 5,000 | |
| k m,23 | 0.1 | 0.035 | b,c | |
| V24 = k24*([ppAkt-PIP3]*[PP2A] – kd,24*[PP2A-ppAkt-PIP3]) | k 24 | 3 | c | |
| k d,24 | 0.1 | |||
| V25 = kcat,25*[PP2A-ppAkt-PIP3] | k 25 | 45 | 20 | c |
| V26 = k26*[pAkt-PIP3 ]*[PP2A] | k 26 | 3 | c | |
| V27 = k27*[PP2A-pAkt-PIP3] | k 27 | 0.3 | c | |
| V28 = kcat,28*[PP2A-pAkt-PIP3] | k 28 | 45 | 20 | c |
| V29 = k29*[PP2A-Akt-PIP3] | k 29 | 30 | c | |
| V30 = k30*[ppAkt-PIP3] | k 30 | 30 | d | |
| V31 = k31*([ppAkt]*[PP2A] – kd,31*[PP2A-ppAkt]) | k 31 | 3 | d | |
| k d,31 | 0.1 | |||
| V32 = kcat,32*[PP2A-ppAkt] | k 32 | 45 | 20 | d |
| V33 = kcat,33*[PP2A-pAkt] | k 33 | 45 | 20 | d |
| V34 = k34*[PP2A-Akt] | k 34 | 30 | d | |
| V35 = Vmax,35*[As160]/(km,35 + [As160]) | V max,35 | 0.00003288 | e | |
| k m,35 | 24,810 | |||
| V36 = k36*([pAs160]*[PP2A] – kd,36*[PP2A-pAs160]) | k 36 | 3 | d | |
| k d,36 | 0.1 | |||
| V37 = kcat,25*[PP2A-pAs160] | k 37 | 45 | 20 | d |
| V38 = k29*[PP2A-As160] | k 38 | 30 | d | |
| V39 = (koff,As160 + kcat,As160)/(kM,As160/D)*[RabGTP]*[As160] | k off,As160 | 600 | f | |
| k cat,As160 | 324 | |||
| k M,As160 | 230 | 3 | ||
| D | 250 | |||
| V40 = koff,GEF*[RabGTP-As160] | k off,GEF | 600 | f | |
| V41 = kcat,GEF*[RabGTP-As160] | k cat,GEF | 234 | f | |
| V42 = (koff,GEF + kcat,GEF)/(kM,GEF/D)*[RabGDP]*[GEF] | k off,GEF | 600 | f | |
| k cat,GEF | 234 | |||
| k M,GEF | 3,860 | 3 | ||
| D | 250 | |||
| V43 = koff,GEF*[RabGDP-GEF] | k off,GEF | 600 | f | |
| V44 = kcat,GEF*[RabGDP-GEF] | k cat,GEF | 234 | f | |
| V45 = k45*RabGTP | k 45 | 0.0059 | d,g | |
| V46 = k46*Glut4_Membrane*As160 | k 46 | 1.30E–07 | d,g | |
ki = nM–1 min–1; kd,i, km,I, kM,As160, and kM,GEF = nM; V = nM/min; koff,As160, kcat,As160, koff,GEF, and kcat,GEF = min–1; D = no units.
Estimated from data in footnote c.
Figure 3.
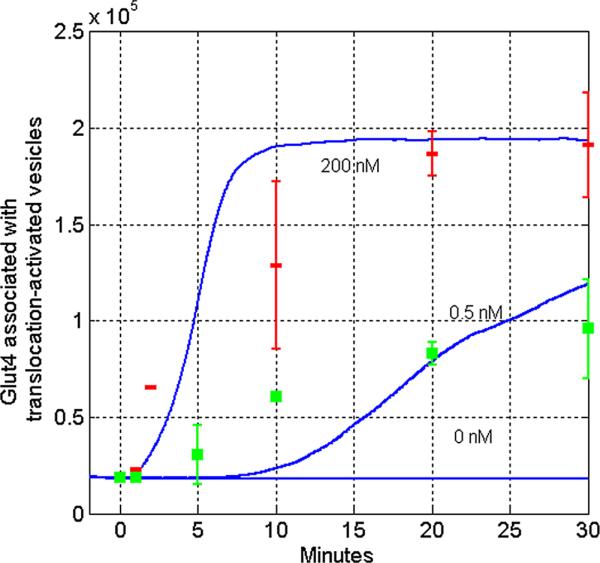
Comparison of in silico and in vitro models of insulin dependent GLUT4 translocation. Simulated GLUT4 concentrations were plotted as averaged over 100 cell following insulin stimulation in vitro. Simulations of insulin dosed at 200 nM, 0.5 nM, and 0 nMare plotted in full lines. The cell membrane is loaded with approximately 10 × more GLUT4 molecules as compared to the unstimulated cell. Data points will error bars represent experimentally determined GLUT4 levels following both 200 nM (represented by thin rectangles) and 0.5 nM (represented by squares) doses of insulin, previously collected by others and replotted here for comparison (Martin et al., 2006). A series of Z-tests were performed to determine the significance in the differences between the in vitro and in silico models. Five of six time points from simulated and measured in vitro experiments are within one standard deviation (|Z| < 1.0). For one time point, the difference between GLUT4 translocation the in silico model and the in vitro experiment was greater than one standard deviation (|Z| = 1.41).
Figure 4.

Modeling Insulin pathway alterations. A: The effects of phosphoinositide 3-kinase inhibitor, wortmannin, on GLUT4 translocation. This figure illustrates the effects of reducing the PI3K substrate concentration, PI, from its steady state level (300 nM) to lower levels (3 and 1 nM), which is comparable to the GLUT4-translocation inhibition by the fungal metabolite, wortmannin, as a PI3K inhibitor. B: The effect of GAP activity on GLUT4 translocation. By varying effective concentrations of GAP available compared to the initial concentration (100%), the model demonstrates acceleration or delay in the translocation of GLUT4 to the cell surface. C: The effects of PTEN concentration on GLUT4 translocation. Previous observations demonstrate that PTEN levels significantly effect GLUT4 translocation, even by small changes in PTEN concentration. Modeled results confirm that PTEN effective concentration changes (increasing from 30 nM, nominally the physiological level) negatively impact GLUT4 translocation. 10 Biotechnology
For the simulated pathway to stay stable in the absence of insulin, the number of RabGTP molecules reacting with As160 (reaction speed V39) needs to be equal to the number of RabGDP-GEF molecules being recycled back into RabGTP and GEF molecules, respectively. Based on this assumption, the relationship
| (5) |
must hold without insulin applied. Solving these equations for the unknown kinetic constants resulted in the about 18,200 GLUT4 at the cell surface in the absence of insulin after 5 minutes (Fig. 3).
Except for Figure 5, all simulation-derived figures were averaged responses from 100 cells. The simulation platform was implemented in MATLAB software and all the results were obtained using 1 ms time increments, although the simulation allows the choice of any user-selected time increment.
Figure 5.
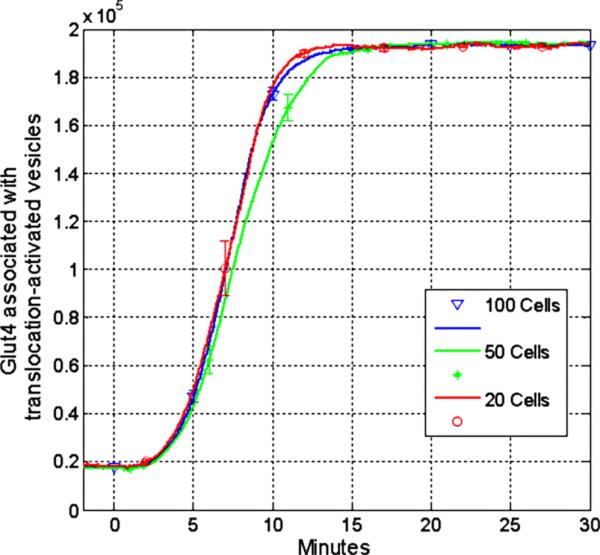
Utilizing various cell numbers in the computational model. To evaluate the effects of stochastic-based modeling on averages calculated per cell, 50, 100 (used in all other figures), and 500 cells were plotted using standard physiological induction concentrations. Virtually no differences were detected between the models utilizing different cell numbers over time.
Results
Simulating Insulin-Dependent GLUT4 Translocation
It was first important to confirm that experimentally determined enzyme kinetics would be mimicked by the simulation model. As increased GLUT4 concentrations on the plasma membrane leads to productive influx of glucose, an effective measure of the outcome of cellular activation by insulin signaling is the quantitation of GLUT4 vesicles activated for translocation to the surface. As shown in Figure 3, the pathway achieves dynamic equilibrium in pre-insulin (0 nM insulin) in vitro conditions by preventing increased GLUT4 transport to the cell surface. Due to the inherent stochastic nature of the approach used, a non-trivial amount of cells were simulated for each plot (typically, 100 cells) and the average concentrations per cell were graphed. Adding validity, when extracellular insulin concentrations are varied, the simulation mimics the response and timing of previously studied in vitro conditions of glucose transport (Fig. 3). Differences between experimental and simulated curves were analyzed by a series of Z-tests. For five of six data points where mean and standard deviation of in vitro GLUT4 translocation has been reported as a function of time and concentration of insulin, the in silico model was able to recapitulate the results within one standard deviation (|Z| < 1.0). For all six data points, our in silico model was able to recapitulate results within two standard deviations (|Z| < 2.0).
Recent studies have shown that GLUT4 translocation is effected by Rab-GAP/GEF interactions downstream of a PI3K/PDK/Akt signal cascade (Eguez et al., 2005; Larance et al., 2005; Sano et al., 2003). As demonstrated in in vitro studies, As160, a GAP, plays a pivotal role in regulating GLUT4 translocation (Sharma et al., 2010). During pre-insulin conditions, As160 actively dephosphorylates Rab-GTP (present on the GLUT4 intracellular vesicles) to Rab-GDP (Fig. 1). The resultant lack of Rab-GTP prevents Rab-GTP-dependent GLUT4 vesicle translocation to the cell surface. Upon phosphorylation of As160 post insulin binding at the insulin receptor, the phosphatase activity of As160 against Rab-GTP is inhibited (Sano et al., 2003). The absence of As160 activity permits guanosine exchange factor (GEF) activity to increase the amount of Rab-GTP present on the GLUT4 vesicle (Eguez et al., 2005). Increased amounts of Rab-GTP on the surface of GLUT4 containing vesicles catalyze intracellular vesicle translocation, membrane fusion, and incorporation of the vesicle into the cell membrane, thereby depositing GLUT4. Upon deposition, the GLUT4 molecules are active in importing glucose from the surrounding fluid.
Accurately Simulating Pathway Modulation on GLUT4 Translocation
Beyond the ability to accurately simulate steady state or insulin activation, a third approach to evaluate the simulation was a comparison of predicted and observed insulin mediated GLUT4 translocation generated under disrupted conditions. Wortmannin, a fungal metabolite, functions by inhibiting PI3K activity and is highly effective at interrupting metabolic pathways that require PI3K dependent signal transduction (Okada et al., 1994). It has been demonstrated in vitro that inhibition of PI3K activity results in complete cessation of insulin stimulated GLUT4 translocation (Hara et al., 1994; James et al., 2004; Sharma et al., 1998). To mimic the effects of wortmannin inhibition, the pathway was simulated by substituting the steady state concentration of PI3K's substrate, PI, with multiple concentrations below this steady state value. Simulating near complete inhibition of PI3K by reducing PI levels yielded strong inhibition of insulin dependent GLUT4 translocation (Fig. 4A), in concordance with previous studies describing application of wortmannin (Clarke et al., 1994; James et al., 2004).
As the role of As160 in GLUT4 translocation was only recently described, the effect of varying concentrations of As160 which deviated from the standard-state values was analyzed to investigate its role. GAP activity targeted at GLUT4 containing vesicles prevents translocation of GLUT4 to the cell membrane, effectively inhibiting insulin dependent glucose uptake (Sharma et al., 2010). As shown in Figure 4B, variation in the effective concentration of As160 (which could be induced by an inhibitor or enhancer) has little effect on the cells ability to reach a maximal level of GLUT4 on the cell membrane in response to insulin after 15 min. However, simulated changes in As160 effective concentrations demonstrate a delay in GLUT4 translocation by a population of cells in response to insulin. It is also possible that GEF activity is further stimulated beyond increases caused by As160 inactivation; however, this is not established in vitro, but can be effectively simulated.
Previously, phosphatase and tensin homolog (PTEN) has been shown to be a key target in the control of diabetes (Butler et al., 2002). Experimentation with our simulation platform highlighted this component as a key regulator in the insulin mediated GLUT4 translocation pathway. Figure 4C demonstrates how small increases in PTEN cause major changes in the cellular response to insulin stimulation.
One feature of signaling cascades, including the insulin signal cascade, is that on a per cell basis, once an activation threshold for signaling has been reached, the signal cascade proceeds in a robust and rapid form. To accurately mimic the effects of tissues, the presented results are the averages as computed from 100 cells. Figure 5 demonstrates that there is no significant difference among the curves obtained while averaging over 50, 100, or 500 cells for the simulated scenarios.
Discussion
When studying disease it is important to understand the underlying processes involved. We sought to simulate the insulin mediated GLUT4 translocation pathway with three novel characteristics: (1) the pathway is the most complete representation of the required components to date, especially those beyond As160; (2) the simulation platform incorporates stochastic variations among individual cells and realistically mimics local molecule availability in the signaling pathway, and (3) the response of hundreds of cells can be simulated in near real-time. Previous models of insulin signaling have not included the effector function of GLUT4 translocation, nor have they taken a simulation approach, but rather a mathematical modeling approach.
Importantly, this novel simulation approach has recapitulated findings and observations of in vitro studies. In the absence of insulin stimulation, results from simulation show essentially no insulin mediated GLUT4 glucose influx, which is consistent with steady state values determined in in vitro experiments (Fig. 3). For comparison to previously published in vitro data which controlled the amount of insulin exposed to cells, we simulated the same effective insulin concentration and observed the results (Martin et al., 2006). Again, the simulation results accurately mimics results found in laboratory conditions, wherein very low doses of insulin eventually lead to GLUT4 activation across exposed cells. The simulation also predicts that increasing insulin dosage does not change the amount of GLUT4 on each cell's surface in an arithmetic fashion; rather, the signal cascade occurs when a given cell achieves an activation threshold. Consequently, low levels of insulin dosage delays the average time it takes for an individual cell to receive and react to the required signal. This concept is supported by previous findings that show insulin stimulates GLUT4 activity in a quantal manner rather than a dose dependent increase in exocytosis and/or decrease in endocytosis rates (Coster et al., 2004; Stockli et al., 2011). Conversely, delivering a dose 200-fold beyond physiologically normal activation levels does not significantly increase the rate of GLUT4 translocation.
Following the validation of our simulation platform's ability to function in maintaining a non-activated steady-state, and responding appropriately to insulin signals, we looked at its ability to replicate in vitro experimental data resulting from disruption of the metabolic pathway. First, we considered the inhibition of PI3K, known to be essential in transducing the insulin signal. This was accomplished by adjusting the simulated level of PI, available to PI3K (the target of the fungal metabolite wortmannin, which potently inhibits its function). By lowering the effective concentration of PI3K substrate, we were able to generate results that mimic wortmannin inhibition of PI3K: GLUT4 translocation being slowed or ultimately limited. Studies of PI3K suggest that time course and signal amplitude contribute to the specificity of the insulin signal (Tengholm and Meyer, 2002); once these pathways are further deduced, the simulation can be readily modified to incorporate such understanding.
Separately, GAP availability was simulated to more fully understand the effects of these recently described processes. Uniquely, simulation results indicate that twofold overabun-dance of GAP activity delays maximum GLUT4 translocation to the cell surface by only 5 min, and the reverse is true for a twofold decrease in GAP activity. Lastly, we looked at the effects of modulating PTEN. While several regulatory molecules elements are known to have effects on the insulin pathway, only relatively small changes in PTEN activity have the ability to completely shut down the insulin response. This correlates to recent studies which implicate over-expression of PTEN as a strong negative regulator of the insulin signal (Hiraku et al., 2001; Leslie and Downes, 2002). Additional studies have shown that PTEN knockdown stimulates GLUT4 translocation to the cell membrane in an insulin dependent manner (Liu et al., 2009). Interestingly, it has been reported that, although cellular amounts of PTEN are independent of insulin resistance factors (i.e., obesity) in muscle cells, insulin sensitization factors (i.e., regular exercise) can yield a decrease in the amount of PTEN present in muscle cells in both obese and healthy organisms, pointing to a possible mechanism by which regular exercise mitigates the effects of insulin resistance factors (Pons et al., 2013). The simulation results indicate that relatively small increases (less than twofold) are necessary to generate near zero response to insulin stimulation. The ability to demonstrate the role of PTEN regulation on the insulin pathway suggests that the extensible platform can accurately be used to simulate additional regulatory proteins as they are discovered or hypothesized.
Conclusions
We have developed a metabolic simulation platform of insulin signaling utilizing a novel stochastic theory approach which recapitulates experimental data. Moreover, the developed platform has allowed us to validate previously published concentration estimates, as well as derive concentrations for understudied components of the pathway. This was accomplished by producing simulation results that agree with the well-established time courses between insulin binding to its receptor and GLUT4 translocation. One caveat to comparing our simulation results to the studies described herein is that much of the in vitro data is from the study of 3T3-L1 adipocytes. It is possible that GLUT4 regulation varies in muscle or adipose tissues. Despite this, the extensibility and the ease of incorporating additional data into our platform allows for the study of these differences as they become known. This report can serve as a roadmap for additional experimental evaluations of under-documented kinetics and concentrations. Moreover, the simulation platform produced average functions at near real-time rates: the time required to simulate one minute of a single cell response varied between 4.19 and 4.37 s. This suggests that the approach described here can be expanded without significant decrease in usable performance. Lastly, the simulation was built in MATLAB, and is entirely extensible, capable of including additional components, or simulating completely new cellular pathways. In the future, it is anticipated that additional components will be identified for the pathway which, when varied, potently affect the outcome of insulin signaling. This approach would be useful to identify proteins for which molecular inhibitors or activators would be effective in reducing dysregulation of the pathway.
Table III.
A description of the initial concentration, units, and the equations forming the basis of the modeling.
| Label | Initial conc. | “ ± ” | Units | Differential equations d[pathway component]/dt |
|---|---|---|---|---|
| I | 1,200 | — | nM | –V0 – V4 |
| IR | 0.0009 | — | nM | V2 – V0 |
| IR-I | — | — | — | V0 – V1 |
| pIR-I | — | — | — | V1 – V2 – V3 – V4 |
| |pIR-I| | — | — | — | V 3 |
| pIR-II | — | — | — | V4 – V5 – V6 |
| |pIR-II| | — | — | — | V 5 |
| IRS1/3 | 60 | 40 | nM | V9 – V6 |
| pIRS1/3 | — | — | — | V6 – V7 |
| PI3K | 200 | 70 | nM | V10 – V7 |
| pIRS1/3-PI3K | — | — | — | V7 – V8 |
| pIRS1/3-PI3K* | — | — | — | V8 – V9 |
| PI3K* | — | — | — | V9 + V13 – V10 – V11 |
| PI3K*-PI | — | — | — | V11 – V12 |
| PI3K*-PIP3 | — | — | — | V12 – V13 |
| PIP3 | — | — | — | V13 + V30 – V14 – V21 |
| PI | 300 | 30 | nM | V16 – V11 |
| PTEN-PIP3 | — | — | — | V14 – V15 |
| PTEN-PI | — | — | — | V15 – V16 |
| PTEN | 50 | 5 | nM | V16 + V20 + V20 – V14 – V17 – V18 |
| pPTEN-PTEN | — | — | — | V18 – V19 |
| PTEN-PTEN | — | — | — | V19 – V20 |
| pPTEN | — | — | — | V17 – V18 |
| Akt | 100 | 3 | nM | V34 – V21 |
| Akt-PIP3 | — | — | — | V21 + V29 – V22 |
| pAkt-PIP3 | — | — | — | V22 + V27 – V23 – V26 |
| PP2A-Akt-PIP3 | — | — | — | V28 – V29 |
| PP2A-pAkt-PIP3 | — | — | — | V26 – V27 – V28 |
| PP2A-ppAkt-PIP3 | — | — | — | V24 – V25 |
| PP2A | 10 | 2.5 | nM | V27 + V29 + V34 + V38 – V24 – V26 – V31 – V36 |
| PP2A-Akt | — | — | — | V33 – V34 |
| PP2A-pAkt | — | — | — | V32 – V33 |
| PP2A-ppAkt | — | — | — | V31 – V32 |
| ppAkt | — | — | — | V30 + V35 – V31 – V35 |
| ppAkt-PIP3 | — | — | — | V23 – V24 – V30 |
| PDK | — | — | — | — a |
| As160 | 108 | — | nM | V38 + V40 + V41 – V35 – V39 |
| pAs160 | 12 | — | nM | V35 – V36 |
| PP2A-pAs160 | — | — | — | V36 – V37 |
| PP2A-As160 | — | — | — | V37 – V38 |
| RabGTP | 0.0965 | — | nM | V40 + V44 – V39 |
| RabGDP | 0.8685 | — | nM | V41 + V43 – V42 |
| RabGTP-As160 | — | — | — | V39 – V40 – V41 |
| GEF | 0.51 | — | nM | V43 + V44 – V42 |
| RabGDP-GEF | — | — | — | V42 – V43 – V44 |
The molecular interactions required for GLUT4 translocation are independent of PDK concentrations.
Acknowledgments
We thank Dr. Frederick Hamel for helpful review of the manuscript. Additional support was provided by the BRTP and FUSE programs of the University of Nebraska at Omaha.
Contract grant sponsor: National Center for Research Resources
Contract grant number: 5P20RR016469 Contract grant sponsor: National Institute for General Medical Science (NIGMS)
Contract grant number: 8P20GM103427
Footnotes
The authors declared that they have no conflicts of interest.
References
- Banting F. Early work on insulin. Science. 1937;85:594–596. doi: 10.1126/science.85.2217.594. [DOI] [PubMed] [Google Scholar]
- Beale E. Insulin signaling and insulin resistance. J Investig Med. 2012;61:11–14. doi: 10.231/JIM.0b013e3182746f95. [DOI] [PMC free article] [PubMed] [Google Scholar]
- Butler M, McKay RA, Popoff IJ, Gaarde WA, Witchell D, Murray SF, et al. Specific inhibition of PTEN expression reverses hyperglycemia in diabetic mice. Diabetes. 2002;51:1028–1034. doi: 10.2337/diabetes.51.4.1028. [DOI] [PubMed] [Google Scholar]
- Carvalho E, Schellhorn SE, Zabolotny JM, Martin S, Tozzo E, Peroni OD, et al. GLUT4 overexpression or deficiency in adipocytes of transgenic mice alters the composition of GLUT4 vesicles and the subcellular localization of GLUT4 and insulin-responsive aminopeptidase. J Biol Chem. 2004;279:21598–21606. doi: 10.1074/jbc.M312269200. [DOI] [PubMed] [Google Scholar]
- Chou I-C, Voit EO. Recent developments in parameter estimation and structure identification of biochemical and genomic systems. Math Biosci. 2009;219:57–83. doi: 10.1016/j.mbs.2009.03.002. [DOI] [PMC free article] [PubMed] [Google Scholar]
- Clarke J, Young P, Yonezawa K, Kasuga M, Holman G. Inhibition of the translocation of GLUT1 and GLUT4 in 3T3-L1 cells by the phosphatidylinositol 3-kinase inhibitor, wortmannin. Biochem J. 1994;300:631–635. doi: 10.1042/bj3000631. [DOI] [PMC free article] [PubMed] [Google Scholar]
- Coster AC, Roland G, David JE. Insulin stimulates the entry of GLUT4 into the endosomal recycling pathway by a quantal mechanism. Traffic. 2004;10:763–771. doi: 10.1111/j.1600-0854.2004.00218.x. [DOI] [PubMed] [Google Scholar]
- Eguez L, Lee A, Chavez JA, Miinea CP, Kane S, Lienhard GE. Full intracellular retention of GLUT4 requires AS160 Rab GTPase activating protein. Cell Metab. 2005;2:263–272. doi: 10.1016/j.cmet.2005.09.005. [DOI] [PubMed] [Google Scholar]
- Faratian D, Goltsov A, Lebedeva G. Systems biology reveals new strategies for personalizing cancer medicine and confirms the role of PTEN in resistance to trastuzumab. Cancer Res. 2009;69:6713–6720. doi: 10.1158/0008-5472.CAN-09-0777. [DOI] [PubMed] [Google Scholar]
- Gallenberger M, Zu Castell W, Hense B, Kutler C. Dynamics of glucose and insulin concentration connected to the b-cell cycle: Model development and analysis. Theor Biol Med Model. 2012;9:46. doi: 10.1186/1742-4682-9-46. [DOI] [PMC free article] [PubMed] [Google Scholar]
- Giambene G. Queuing theory and telecommunications: Networks and applications. Springer; New York: 2005. [Google Scholar]
- Hara K, Yonezawa K, Sakaue H, Ando A, Kotani K, Kitamura T, et al. 1-Phosphatidylinositol 3-kinase activity is required for insulin-stimulated glucose transport but not for RAS activation in CHO cells. Proc Natl Acad Sci. 1994;91:7415–7419. doi: 10.1073/pnas.91.16.7415. [DOI] [PMC free article] [PubMed] [Google Scholar]
- Hatakeyama M, Kimura S, Naka T, Kawasaki T, Yumoto N, Ichikawa M, et al. A computational model on the modulation of mitogen-activated protein kinase (MAPK) and Akt pathways in heregulin-induced Erb signalling. J Biochem. 2003;373:451–463. doi: 10.1042/BJ20021824. [DOI] [PMC free article] [PubMed] [Google Scholar]
- Hiraku O, Hideki K, Makoto F, Motonobu A, Kouichi I, Yashushi F, et al. Regulation of phosphoinositide metabolism, Akt phosphorylation, and glucose transport by PTEN (phosphatase and tensin homolog deleted on chromosome 10) in 3T3-L1 adipocytes. Mol Endocrinol. 2001;15:1411–1422. doi: 10.1210/mend.15.8.0684. [DOI] [PubMed] [Google Scholar]
- James DE, Brown R, Navarro J, Pilch PF. Insulin-regulatable tissues express a unique insulin-sensitive glucose transport protein. Nature. 1988;333:183–185. doi: 10.1038/333183a0. [DOI] [PubMed] [Google Scholar]
- James DJ, Salaun C, Brandie FM, Connel JM, Chamberlain LH. Neomycin prevents the wortmannin inhibition of insulin-stimulated Glut4 translocation and glucose transport in 3T3-L1 adipocytes. J Biol Chem. 2004;279:20567–20570. doi: 10.1074/jbc.C400096200. [DOI] [PubMed] [Google Scholar]
- Kessler A, Tomas E, Immler D, Meyer H, Zorzano A, Eckel J. Rab11 is associated with GLUT4-containing vesicles and redistributes in response to insulin. Mol Cardiol. 2000;43:1518–1527. doi: 10.1007/s001250051563. [DOI] [PubMed] [Google Scholar]
- Kozka I, Clark A, Reckless J, Cushman S, Gould G, Holman G. The effects of insulin on the level and activity of the GLUT4 present in human adipose cells. Diabetologia. 1995;38:661–666. doi: 10.1007/BF00401836. [DOI] [PubMed] [Google Scholar]
- Larance M, Ramm G, Stockli J, Van Dam E, Winata S, Wasinger V, et al. Characterization of the role of the Rab GTPase-activating protein AS160 in insulin-regulated GLUT4 trafficking. J Biol Chem. 2005;280:37803–37813. doi: 10.1074/jbc.M503897200. [DOI] [PubMed] [Google Scholar]
- Leslie NR, Downes PC. PTEN: The down side of PI 3-kinase signalling. Cell Signal. 2002;14:285–295. doi: 10.1016/s0898-6568(01)00234-0. [DOI] [PubMed] [Google Scholar]
- Leto D, Saltiel A. Regulation of glucose transport by insulin: Traffic control of GLUT4. Nat Rev Mol Cell Biol. 2012;13:383–396. doi: 10.1038/nrm3351. [DOI] [PubMed] [Google Scholar]
- Liu F, Dallas-Yang Q, Castriota G, Fischer P, Santini F, Ferrer M, et al. Development of a novel GLUT4 translocation assay for identifying potential novel therapeutic targets for insulin sensitization. Biochemistry. 2009;418:413–420. doi: 10.1042/BJ20082051. [DOI] [PubMed] [Google Scholar]
- Martin O, Lee A, McGraw T. GLUT4 distribution between the plasma memebrane and the intracellular compartments is maintained by an insulin-modulated bipartite dynamic mechanism. J Biol Chem. 2006;281:484–490. doi: 10.1074/jbc.M505944200. [DOI] [PubMed] [Google Scholar]
- Okada T, Sakuma L, Fukui Y, Hazeki O, Ui M. Blockage of chemotactic peptide-induced stimulation of neutrophils by wortmannin as a result of selective inhibition of phosphatidylinositol 3-kinase. J Biol Chem. 1994;269:3563–3567. [PubMed] [Google Scholar]
- Pons S, Martin V, Portal L, Zini R, Morin D, Berdeaux A, et al. Regular treadmill exercise restores cardioprotective signaling pathways in obese mice independently from improvement in associated co-morbidities. Mol Cell Cardiol. 2013;54:82–89. doi: 10.1016/j.yjmcc.2012.11.010. [DOI] [PubMed] [Google Scholar]
- Sano H, Kane S, Sano E, Miinea CP, Asara JM, Lane WS, et al. Insulin-stimulated phosphorylation of a Rab GTPase-activating protein regulates GLUT4 translocation. J Biol Chem. 2003;278:14599–14602. doi: 10.1074/jbc.C300063200. [DOI] [PubMed] [Google Scholar]
- Sedaghat A, Sherman A, Quon M. A mathematical model of metabolic insulin signaling pathways. Am J Physiol Endocrinol Metab. 2002;283:E1084–E1101. doi: 10.1152/ajpendo.00571.2001. [DOI] [PubMed] [Google Scholar]
- Sharma N, Arias EB, Cartee GD. Rapid reversal of insulin-stimulated AS160 phosphorylation in rat skeletal muscle after insulin exposure. Physiol Res. 2010;59:71–78. doi: 10.33549/physiolres.931707. [DOI] [PMC free article] [PubMed] [Google Scholar]
- Sharma PM, Egawa K, Huang Y, Martin JL, Huvar I, Boss GR, et al. Inhibition of phosphatidylinositol 3-kinase activity by adenovirus-mediated gene transfer and its effect on insulin action. J Biol Chem. 1998;273:18528–18537. doi: 10.1074/jbc.273.29.18528. [DOI] [PubMed] [Google Scholar]
- Shin I, Jennifer E, Swati B. Proapoptotic activity of cell-permeable anti-Akt single-chain antibodies. Cancer Res. 2005;65:2815–2824. doi: 10.1158/0008-5472.CAN-04-2898. [DOI] [PubMed] [Google Scholar]
- Stephan L, Christine S, Hanspeter H. Kinetic mechanisms for overexpression insensitivity and oncogene cooperation. FEBS Lett. 2009;583:93–96. doi: 10.1016/j.febslet.2008.11.027. [DOI] [PubMed] [Google Scholar]
- Stockli J, Fazakerley D, James D. GLUT4 exocytosis. Cell Sci. 2011;124:4147–4159. doi: 10.1242/jcs.097063. [DOI] [PMC free article] [PubMed] [Google Scholar]
- Tengholm A, Meyer T. A PI3-kinase signaling code for insulin-triggered insertion of glucose transporters into the plasma membrane. Curr Biol. 2002;12:1871–1876. doi: 10.1016/s0960-9822(02)01223-x. [DOI] [PubMed] [Google Scholar]
- Wysocki BJ, Martin TM, Wysocki TA, Pannier AK. Modeling nonviral gene delivery as a macro-to-nano communication system. Nano Commun Netw. 2012;4:14–22. [Google Scholar]