

Abstract
This article discusses dried blood spot (DBS) sampling in therapeutic drug monitoring (TDM). The most important advantages of DBS sampling in TDM are the minimally invasive procedure of a finger prick (home sampling), the small volume (children), and the stability of the analyte. Many assays in DBS have been reported in the literature over the previous 5 years. These assays and their analytical techniques are reviewed here. Factors that may influence the accuracy and reproducibility of DBS methods are also discussed. Important issues are the correlation with plasma/serum concentrations and the influence of hematocrit on spot size and recovery. The different substrate materials are considered. DBS sampling can be a valid alternative to conventional venous sampling. However, patient correlation studies are indispensable to prove this. Promising developments are dried plasma spots using membrane and hematocrit correction using the potassium concentration.
Key Points
| Hematocrit has influence on spot size, recovery, and blood-to-plasma ratio |
| Strategies to cope with the hematocrit influence include avoiding the effect, minimizing the effect, or measuring hematocrit by means of the determination of potassium |
| More attention is needed on the clinical validation of dried blood spot methods |
Introduction
Assays of drugs for therapeutic drug monitoring (TDM) are usually performed in serum or plasma, obtained by venous blood sampling. However, there is growing interest in dried blood spot (DBS) sampling in TDM. Compared with conventional venous blood sampling, DBS sampling is a convenient and simple sampling method with better patient comfort. In DBS sampling, capillary blood is obtained from a finger prick with an automatic lancet. With clear instructions and after adequate training, patients should be able to do this finger prick themselves. After disinfection, the patient pricks his/her finger with a lancet, preferable with an autoretracting (1.8–2.4 mm) needle. The first blood drop is discarded because it contains more tissue fluid. The next drop is collected to fill a premarked circle on a filter paper; one drop in one circle. The DBS is allowed to dry at room temperature and then is packed for transportation to the laboratory. In the laboratory, the homogeneity of the blood spot is assessed. A disc is punched out from the blood spot. This disc represents a fixed volume of absorbed blood, depending upon the disc diameter. After extraction, the analyte is measured with an analytical technique. Several methods were published over the previous 2 years about drug quantification in DBS for antiepileptic drugs [1, 2], immunosuppressants [3–6], antiretrovirals [7–9], cardiovascular therapy [10], psychoactive drugs [11, 12], and antibiotics [13–16]. In 2009, Edelbroek et al. [17] published a review about DBS in Therapeutic Drug Monitoring. This article discusses the progress that has been made since then.
DBS sampling has a number of advantages and disadvantages over conventional venous sampling.
The advantages are as follows:
Easy and minimally invasive sampling. The patients can perform the finger prick at home, and no phlebotomist is necessary. This makes it more convenient to do abbreviated area under the concentration-time curve measurements because there is no need for the patient to wait in the hospital.
Only a small volume is required. One of the original projected advantages of using DBS technology is the easy implementation for small sample volume collection from finger and heel pricks in young children and neonates.
Most analytes are more stable in DBS than in frozen samples [18–21].
Convenient storage and transport. DBS specimens can be shipped or transported with no reasonable expectations of exposure to blood or other infectious material by handlers and can be sent via normal postal systems without special mailing cartons [22].
Debate is ongoing as to whether blood is a more representative matrix than plasma or serum. The fact is that bioanalysis of most drugs, with the exception of immunosuppresants, is carried out in plasma or serum and reference values are based on these matrices. Additional validation is required to translate capillary blood-to-plasma concentrations.
The disadvantages are as follows:
Only small volumes are available and therefore a sensitive analysis technique is required and usually only one assay per spot can be performed.
Risk of contamination. If the same person does the finger prick and the dosing, the risk of contaminating the filter paper with the drug is possible.
There is no spare sample.
Despite adequate training of the patient, the sampling is not always successful
Extensive validation is required. The impact of variations of hematocrit (Hct) values on the spot size and homogeneity should be understood as well as their impact on assay performance. The influence of the spotted blood volume and spot homogeneity should be studied. Any change in filter paper type and/or manufacturer requires a partial validation [23].
Capillary concentration can be different from venous concentration because the material in DBS consists of blood cells, plasma, and interstitial fluid.
Translation of Dried Blood Spot to Plasma Drug Concentration
The relationship of drug distribution between plasma and the cellular parts of the blood is important in TDM, especially when comparing drug concentration in DBS with reference plasma concentrations. The historical perspective for the predominant use of plasma in TDM originates from early analytical challenges of working with whole blood: accurate aliquoting, extraction of the analytes. The distribution of a drug in blood at equilibrium can be described with these equations (Eqs. 1–3) [24]:
| 1 |
| 2 |
| 3 |
where C p, C u, and C b are total plasma concentration, unbound concentration, and total blood concentration, respectively, f u is the unbound fraction and ρ the erythrocyte-to-plasma concentration ratio. Thus, total plasma concentration is directly proportional to Cu when the f u is constant. The C b /C p ratio depends on Hct, unbound fraction in plasma, and the erythrocyte-to-plasma concentration ratio.
Emmons and Rowland conclude that when variability in f u and ρ is low, then either plasma or DBS can be used. When the blood-to-plasma ratio is close to 0.55, then variability in f u (and to a lesser extent Hct) becomes a concern, and an understanding of the inter- and intra-individual variation in plasma protein binding is required. However, when the blood-to-plasma ratio is much larger, especially two or greater, then variability in ρ becomes the dominant concern when using DBS [24]. In practice, it is always necessary to do a clinical validation to translate DBS to plasma concentration.
Hematocrit Effect
Recently, De Kesel et al. [25] published an extensive review about the effect of Hct on the qualitative analysis of DBS. The Hct is the volume percentage of red blood cells in blood and has considerable effect on blood viscosity. It can have a direct influence on the accuracy and precision of the analysis of drugs in bioanalytical assays using DBS.
This effect is a result of a complex phenomenon. Variations in Hct will cause different spreading of the blood in the DBS paper. This is illustrated in Fig. 1. The Hct effect is dependent on the chemical and physical properties of the drug in combination with DBS paper properties [26, 27]. A relatively low Hct will result in a negatively biased, target analyte concentration. Ingels et al. [26] reported a 15 % deviation at Hct = 0.35 and +10% at Hct = 0.55 compared with the gamma-hydroxybutyric acid concentration at the normalized Hct of 0.44.
Fig. 1.
Appearance of dried blood spots at different blood Hct levels. Hct = 0.18 (a); Hct = 0.35 (b); Hct = 0.50 (c). Aliquots of 50 µL blood were applied to the paper and allowed to dry for 4 h under ambient conditions in the laboratory. The different Hct levels were prepared by mixing washed red blood cells and serum. The preprinted circles are 13 mm in diameter. Hct hematocrit
The recovery rate of a drug can vary with varying Hct: high recovery at low Hct and low recovery at high Hct [28]. Koster et al. [6] proved the effect of the concentration and Hct on the recovery of sirolimus and everolimus.
Depending on differences in physical properties, the drug might undergo a non-homogeneous distribution within the DBS sample [28, 29]. Nonhomogeneous distribution of the drug as a result of chromatography on the paper is also observed with high blood loading volumes [30]. Furthermore, the Hct has influence on the blood-to-plasma ratio as illustrated in Eq. 3.
Hematocrit is currently identified as the single most important parameter influencing the spread of blood on DBS cards, which could impact the validity of the results generated by DBS methods, affecting the spot formation, spot size, drying time, homogeneity, and, ultimately, the robustness and reproducibility of the assays [23]. It is therefore remarkable that 10 out of 24 studies in Table 1 did not assess the influence of Hct.
Table 1.
Overview of drugs for which TDM using the DBS method has been reported in the literature 2009–2014
| Drug | LLOQ-ULOQ | Paper | Analytical technique | Patient | Hct influence | Correction for Hct | Additional DBS validation | Short-term stability | Long-term stability | Clinical validation | References |
|---|---|---|---|---|---|---|---|---|---|---|---|
| ACE inhibitor | |||||||||||
| Ramipril | 0.5–100 µg/L | 903 | LC-TOF-MS | Direct | n.d. | – | BV | n.d. | 12 weeks at RT | Limited | [10] |
| Analgetic | |||||||||||
| Acetaminophen | 27.4–20,000 µg/L | 903 | LC-MS/MS | Direct | n.d. | – | n.d. | 24 h at RT | 1 month at −80 °C | Yes | [73] |
| Acetaminophen | 50–5,000 µg/L | Ahl226, DMPK-A, DMPK-B, Agilent DMS | LC-MS/MS | Direct | n.d. | – | BV | Yes | n.d. | Yes | [47] |
| Acetaminophen glucuronide | |||||||||||
| Acetaminophen sulfate | |||||||||||
| Angiotensin II receptor antagonist | |||||||||||
| Losartan | 1–200 µg/L | 903 | LC-MS/MS | Volumetric | Yes | Standard Hct for calibration standards | BV | 30 days at 4 °C | n.d. | No | [74] |
| Losartan carboxylic acid | 5–1,000 µg/L | ||||||||||
| Antibiotic | |||||||||||
| Ertapenem | 0.5–100 mg/L | 903 | UPLC-MS/MS | Volumetric | Yes | Unclear, not clearly described | No results provided | 1 month at –20 °C | n.d. | No | [14] |
| Linezolid | 1–100 mg/L | 903 | LC-MS/MS | Direct | Yes | 100/(100 Hct) | n.d. | 30 days at 37 °C | n.d. | Yes | [75] |
| Metronidazole | 1–50 mg/L | 903 | HPLC-DAD | Direct | n.d. | – | n.d. | 28 days at RT | n.d. | No | [68] |
| Moxifloxacin | 0.05–60 mg/L | 31ETCHR, 903, W3 | LC-MS/MS | Volumetric | Yes | Vstd/(Vstd + b(HCT – 35 )) | BV | 4 weeks at RT | n.d. | Yes | [15] |
| Vstd = 19.98 | 2 weeks at 50 °C and high humidity | ||||||||||
| B = 0.1398 | |||||||||||
| Rifaximin | 0.1–10 µg/L | No type | LC-MS/MS | Volumetric | n.d. | – | n.d. | 30 days at RT | n.d. | No | [76] |
| Anticonvulsant | |||||||||||
| Phenobarbital | 2–50 mg/L | 903 | HPLC-DAD | Volumetric | No | – | BV | 3 days at 40 °C | 6 weeks at RT | n.d. | [1] |
| Carbamazepine | 1–20 mg/L | ||||||||||
| Carba-epoxide | 0.5–10 mg/L | ||||||||||
| Levetiracetam | 2–50 mg/L | ||||||||||
| Lamotrigine | 1–20 mg/L | ||||||||||
| Topiramate | 10–2,000 µg/L | DMPK-C | LC-MS/MS | Volumetric | No | – | BV | n.d. | 194 days at RT stable | No | [2] |
| Rufinamide | 0.48–47.60 mg/L | 903 | LC-MS/MS | Direct | Yes | 100/(100 Hct) | n.d. | 30 days at RT | n.d. | Yes | [77] |
| Phenobarbital | 1–100 mg/L | 903 | LC-MS/MS | Volumetric | Yes | 100/(100 Hct) | n.d. | 1 month at RT | n.d. | Yes | [78] |
| Antidepressant | |||||||||||
| Venlafaxine | 20–1,000 µg/L | DMPK-C | LC-MS/MS | Volumetric | No | – | BV PL | n.d. | n.d. | Limited (1) | [12] |
| DM-venlafaxine | |||||||||||
| Fluoxetine | 1–500 µg/L | 903 | GC-NICI-MS/MS | Volumetric | n.d. | – | n.d. | 30 days at 40 °C | n.d. | No | [79] |
| Norfluoxetine | |||||||||||
| Reboxetine | 20–500 µg/L | ||||||||||
| Paroxetine | |||||||||||
| Antimalarial | |||||||||||
| Mefloquine | 5–2,000 nM | 903 | LC-MS/MS | Direct | n.d. | – | n.d. | Stable for 4 h at RT | n.d. | No | [50] |
| Mefloquine carboxy | 13–2,600 nM | ||||||||||
| Antimycotic | |||||||||||
| Voriconazole | 0.1–10 mg/L | DMPK-C | LC-MS/MS | Direct | Yes | Standard Hct for calibration standards | BV | 12 days a 80 °C | n.d. | Yes | [80] |
| Fluconazole | 0.5–100 mg/L | ||||||||||
| Posaconazol | 0.1–10 mg/L | ||||||||||
| Posaconazol | 5–5,000 µg/L | Ahl-226; | LC-MS/MS | Volumetric | Yes | No (0.25–0.41) | BV, PL | 13 days at RT | n.d. | n.d. | [48] |
| DMPK-C | |||||||||||
| Antiretroviral | |||||||||||
| Efavirenz | 0.31–20 mg/L | 903 | HPLC-DAD | Volumetric | No | – | n.d. | 1 month at 45 °C | 1 year at −20 °C | Yes | [7] |
| Ribavarine | 0.05–10.0 mg/L | 903 | LC-MS/MS | Volumetric | Yes | Standard Hct for calibration standards | BV PL | n.d. | > 2 months | Limited (1) | [81] |
| Tenofovir | 2.5–1,000 µg/L | 903 | LC-MS/MS | Volumetric | Yes | Standard Hct for calibration standards | SH BV | Not in DBS | 18 months at RT | Yes | [9] |
| Emtricitabine | 2.5–5,000 µg/L | 11 months at −20 °C and −80 °C | |||||||||
| Lopinavir | 0.25–50 µmol/L | PK DBS | LC-MALDI-MS | Volumetric | n.d. | – | n.d. | 24 h at 4 °C | n.d. | Yes | [82] |
| Ritonavir | 20 days at −20 °C | ||||||||||
| Diuretic | |||||||||||
| Canrenone | 25–1,000 µg/L | 903 | LC-MS/MS | Direct | n.d. | – | n.d. | 1 month at −20 °C | n.d. | No | [83] |
| Histamine H2-receptor antagonist | |||||||||||
| Ranitidine | 10–500 µg/L | 903 | LC-MS/MS | Volumetric | n.d. | – | n.d. | 1 month at RT | 2 months at RT and −20 °C | No | [84] |
| Immunosuppressant | |||||||||||
| Cyclosporine | 25–1,440 µg/L | 903 | LC-MS/MS | Direct | Yes | Standard Hct for calibration standards | n.d. | 17 days at RT | n.d. | Yes | [85, 86] |
| Mycophenolic acid | 0.74–23.4 mg/L | 903 | HPLC-DAD | Direct | Yes | Standard Hct for calibration standards | n.d. | 26 days at 4 °C | n.d. | Yes | [67, 69] |
| Cyclosporine | 30–1,000 µg/L | 903 | LC-MS/MS | Volumetric | No | – | BV PL | 5 days at 60 °C | n.d. | Yes | [87] |
| Tacrolimus | 1.2–40 µg/L | 5 days at 60 °C | |||||||||
| Sirolimus | 1.2–40 µg/L | 5 days at 37 °C | |||||||||
| Tacrolimus | 1–80 µg/L | 903 | LC-MS/MS | Volumetric | Yes | Standard Hct for calibration standards | BV PL | 24 h at 50 °C | 35 days at −20 °C | Limited (1) | [4] |
| 10 days at RT | |||||||||||
| Tacrolimus | 1.00–50.0 µg/L | 31ETCHR | LC-MS/MS | Volumetric | Yes | Two standard Hct for calibration standards | BV | 28 days at 37 °C | n.d. | Limited (1) | [6] |
| Sirolimus | DMPK-C | 7 days at 37 °C | |||||||||
| Everolimus | 13 days at 22 °C | ||||||||||
| 2 days at 37 °C | |||||||||||
| Cyclosporine | 20.0–2,000 µg/L | 28 days at 37 °C | |||||||||
| Tacrolimus | 1–50 µg/L | DMPK-A | LC-MS/MS | Direct | n.d. | – | n.d. | 4 weeks at RT | n.d. | Yes | [3] |
| Oncolytic | |||||||||||
| Busulfan | 50–2,000 µg/L | 903 | LC-MS/MS | Volumetric | Yes | No correction as the influence is stable | n.d. | <24 h at RT | n.d. | Yes | [88] |
| 24 h at 4 °C | |||||||||||
| 1 month at −20 °C | |||||||||||
| Paclitaxel | 0.2–20 µg/L | DMPK | LC-MS/MS | Volumetric | n.d. | – | n.d. | 30 days at 4 °C | 45 days at 4 °C | No | [71] |
| Imatinib | 50–5,000 µg/L | Agilent DMS | LC/MS/MS | Volumetric | No | – | n.d. | 28 days at 40 °C | n.d. | Yes | [89] |
| Nilotinib | 50–5,000 µg/L | 28 days at 40 °C | |||||||||
| Dasatinib | 2.5–250 µg/L | 28 days at 25 °C | |||||||||
| Statin | |||||||||||
| Simvastatin | 1–100 µg/L | 903 | LC-TOF-MS | Direct | n.d. | – | BV | n.d. | 12 weeks at RT | Limited | [10] |
| β-Agonist | |||||||||||
| Salmeterol | 1.00–500 µg/L | W41 | HPLC-FLU | Volumetric | n.d. | – | n.d. | n.d. | n.d. | No | [90] |
| β-Blocker | |||||||||||
| Bisoprolol | 0.1–100 µg/L | 903 | LC-TOF-MS | Direct | n.d. | – | BV | n.d. | 12 weeks at RT | Limited | [10] |
| Atenolol | 25–1,500 µg/L | Agilent DMS; | LC-TOF-MS | Volumetric | n.d. | – | BV | n.d. | 10 weeks at RT | No | [46] |
| 903, | |||||||||||
| Ahl226 | |||||||||||
| Propranolol | 2.5–200 µg/L | 903 | LC-MS/MS | Volumetric | Probably | 100/(100 Hct) | n.d. | 1 month at RT | n.d. | Yes | [91] |
903: Whatman 903, Ahl-226: Ahlstrom Ahl-226, DMPK-C: Whatman FTA DMBK-C, 31ETCHR: Whatman 31 ET CHR, W3: Whatman No3, Agilent DMS: Agilent Bond Elut DMS
BV blood volume, DBS dried blood spot, DM Desmethylvenlafaxine, FLU fluorescence spectrometry, GC-NICI-MS-MS gas chromatography-negative-ion chemical ionization mass spectrometry, Hct hematocrit, HPLC-DAD high-performance liquid chromatography-diode array detector, Limited (1) spots from venous blood, LLOQ Lower limit of quantification, LC-TOF-MS liquid chromatography-time-of-flight-mass spectrometry, LC-MS/MS liquid chromatography-tandem mass spectrometry, MALDI-MS matrix assisted laser desorption/ionization time-of-flight mass spectrometry, n.d. not done, PL punch location TDM therapeutic drug monitoring, RT room temperature, SH spot homogeneity, ULOQ Upper limit of quantification, UPLC ultra-performance liquid chromatography
– not available
Strategies to cope with the Hct influence can be divided into avoiding the effect and minimizing the Hct effect.
Avoiding the Hematocrit Effect
The Hct effect can be avoided by analyzing the entire DBS. This eliminates the variation from spreading and nonhomogeneity [31]. However, this makes accurate volumetric application the most critical parameter and it will be difficult to train people not accustomed to the laboratory technique.
Youhnovski et al. presented a modification of the traditional DBS, named pre-cut dried blood spot (PCDBS). Paper discs are cut from the filter paper and mounted with double-sided adhesive tape. The paper discs are spotted with blood. In contrast to the classical DBS technique, the PCDBS procedure demonstrates no variation in response, within ± 3 %, independently of the Hct level or the type of card used. For quantification of naproxen by liquid chromatography/electrospray ionization tandem mass spectrometry (LC/ESI-MS/MS), the PCDBS technique was demonstrated to be as precise (coefficient of variation ≤3.1 %) and accurate (between 95.4 and 104.4 %) as the classical DBS procedure [32]. Additionally, the use of PCDBS can also eliminate sample carryover from the mechanical punching of conventional DBS samples [33].
Li et al. described the concept of perforated dried blood spots (PDBS). PDBS discs were prepared from regular filter paper, with a diameter of 6.35 mm with a single-hole paper puncher. These discs are spotted with an accurate amount of blood sample (5–10 μL), dried, and then stored. Upon sample analysis, PDBS samples are pushed by single-use pipette tips into 96-well plates [34].
Meesters et al. presented the dried matrix on paper discs (DMPD). The precut paper discs were placed in a plastic cartridge. The sample is loaded with a pipette or a capillary tube. DMPD eliminated the Hct effect and demonstrated better accuracy and precision than regular DBS with partial punching. Observed accuracy and precision were 6.0 and 2.3% for DMPD, respectively, and −10.4 and 17.1%, for DBS, respectively [35]. However, all these three developments require volumetric application on DBS. There are currently no tools available that allow a non-experienced patient to accurately deposit a fixed volume of blood onto a paper card. This makes these methods less attractive when aiming at patient self-sampling.
Dried plasma spots (DPS) can be generated by collecting plasma samples on filter cards. This sampling strategy requires a longer procedure for sample collection because of the centrifugation step that is necessary to obtain plasma. Drug quantification in DPS has been described for antibiotics [36, 37], antiretrovirals [38], and for gabapentin [39]. Barfield and Wheller [40] described the analytical validation of DPS. Because of the centrifugation step, patient self-sampling is impossible.
Li et al. recently presented a two-layered polymeric membrane for the formation of separated DPS from whole blood. Molecular filtration of red blood cells from applied microsamples of whole blood was accomplished with a two-layer polymeric membrane substrate. The lower membrane surface containing the separated plasma spot was physically separated from the upper membrane and dried, followed by semi-automated direct elution of the sample to an online solid-phase extraction cartridge followed by liquid chromatography coupled to tandem mass spectrometry (LC/MS/MS). They applied this method on the quantitative determination of guanfacine. The described work demonstrates proof of principle using membrane sample preparation techniques to form DPS samples from whole blood for subsequent bioanalysis [41]. The same principle is used by Kim et al. [42] for the quantification of 25-hydroxy vitamin D in plasma obtained by a finger prick. This approach has the potential to eliminate the Hct as well capillary blood-to-plasma issues.
Minimizing the Hematocrit Effect
The most frequently used method for correction of the Hct is the standardization of the Hct in the calibration standards close to the expected Hct of the samples. This is the most practical and easiest method for correction; calibration standards are custom prepared and it is therefore easy to control the Hct. However, sometimes the bias is too large and a different method for correction has to be used [6, 53, 54, 60, 67, 70].
Measuring Hematocrit in Dried Blood Spot
Recently, a new method has been proposed for the assessment of Hct in DBS [43].
It is not possible to measure the hematocrit directly in DBS and therefore a marker has to be used. Potassium is mainly present intracellularly, the concentration is about 35 times higher than the extracellular concentration. Because of this difference and the fact that erythrocytes are the predominant cells in blood, potassium corresponds well with the erythrocyte fraction and therefore with the Hct. In addition, potassium is a stable component. Furthermore, the inter-individual variation is small and it has a narrow normal plasma concentration range of 3.6–4.8 mmol/L.
The use of potassium as a marker to calculate the Hct was studied by Capiau et al. From 111 patients, samples were collected in EDTA and lithium heparin tubes to determine the agreement between the Hct in DBS samples and EDTA whole blood. The Hct in EDTA whole blood was determined on a Sysmex XE-5000 hematology analyzer as the reference assay. The lithium heparin whole blood was used to prepare spots and was analyzed according to the reported assay. The statistical tests showed that the agreement is high and that potassium is suitable to predict the Hct in unknown samples.
It should be noted that the experiment was not performed in capillary blood. The use of anticoagulants, such as heparin, influences the blood viscosity [44] and therefore it should be tested in capillary blood. Furthermore, the implementation of the potassium measurement and the consecutive correction of the analytical results have not been tested. In our laboratory, we have performed a similar test to calculate the Hct, with comparable results. More importantly, the use of potassium to calculate the Hct and the following Hct correction was tested for analysis of creatinine in DBS samples. The results seem to be promising and the correction enhanced the accuracy significantly. These data are currently under submission. To conclude, the measurement of potassium to calculate the Hct seems promising and is possibly a tool to correct for the Hct influence. More research has to be performed to investigate the implementation of the correction and its use in routine analysis.
Filter Paper
The most used filter papers are Whatman 903, Ahlstrom 226, Whatman FTA DMPK-C, Whatman 31 ET CHR, Whatman 3, and Agilent Bond Elut DMS (Table 1). Whatman 903 and Ahlstrom 226 are US Food and Drug Administration registered for blood collection as class II medical devices. DMPK cards are developed for microvolume sampling (10–20 µL) in drug metabolism and pharmacokinetics studies. DMPK-A and DMPK-B cards lyse cells and denature protein on contact. DMPK-C cards are not impregnated with chemicals that potentially interfere with bioanalysis [45].
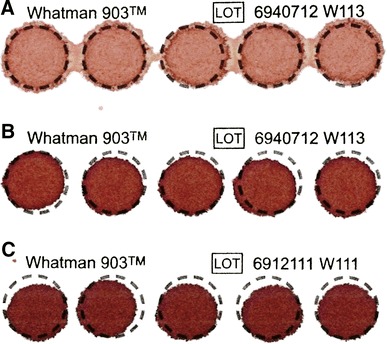
During method development, some laboratories screen different card types and solvent mixtures. This approach allows for the selection of the best combination to facilitate further method optimization [45]. Sometimes, analytical results with more than one paper are reported [6, 15, 46–48]. Luckwell et al. [49] investigated within and between lot variations for four cellulose paper types: Whatman FTA DMPK-A, -B, and -C, and 903. The substrates were tested to demonstrate manufacturing reproducibility (thickness, weight, chemical coating concentration) and its effect on the size of the DBS produced, and the quantitative data derived from the bioanalysis of human DBS samples containing six compounds of varying physicochemical properties. Within and between lot variations in paper thickness, mass, and chemical coating concentration were within acceptable manufacturing limits. No variation in the spot size or bioanalytical data was observed. Bioanalytical results obtained for DBS samples containing a number of analytes spanning a range of chemical space are not affected by the lot used or by the location within a lot [49].
Novel substrate material that minimizes the effect of Hct on spot size and recovery are under investigation.
Recent developments in the filter papers are the non-cellulose ‘papers’. The Agilent Bond Elut DMS card is an example of this type of material. This non-cellulose material is less influenced by the Hct and should perform better with LC-MS/MS analysis because of the lack of cellulose. From the 36 articles mentioned in Table 1, only three [46, 47, 50] tested this paper, and from those three only one actually used this material [50]. The other two articles mentioned poor precision obtained with the non-cellulose material. Although not published, our laboratory also tested the material and we found the material to be fragile and the saturation inconsistent, similar to the findings of Lawson et al. [46]. More recently, another type of material was tested for DBS sampling: alginate and chitosan foam by Eibak et al. [51]. This article describes the synthesis of foam-like material on which the blood can be spotted. The authors compared this with DMPK and Agilent Bond Elut DMS using four drugs. The recovery was higher and the drug extraction was easier to perform compared with the DMPK and DMS papers. However, the influence of the Hct was not tested and the drug extraction was not optimized for the DMPK and DMS papers. Although the sample preparation seems to be less laborious, more investigation with this material is needed.
Internal Standards
Normal application of the internal standard (IS) is additional in the extraction solvent. Although this is the easiest manner of application, it is not the right procedure to apply an IS. As Abu-Rabie et al. described [52], there are several options to apply the IS, (1) addition to the extraction solvent, (2) treatment of the paper before use, (3) addition of the IS to the sample before spotting, and (4) application of the IS on the spot after spotting. In daily practice, options 2 and 3 are not very suitable. Treated paper requires distinct marking in the case of multiple DBS studies or analysis, furthermore sufficient data should be available regarding the stability of the IS when applied to the paper. Addition of the IS before spotting negates one of the biggest advantages of DBS sampling, namely that patients can perform DBS sampling at home. Because of these disadvantages, the IS was applied after spotting on the paper rather than as an addition to the extraction solvent. The chosen technique was spraying with Touchspray, a device developed by The Technology Partnership. The spraying of the IS was well researched on different types of paper (DMPK-A, DMPK-B, and Ahlstrom 226) and after solving problems with spray volume it was found to be equally accurate and precise as addition of the IS to the extraction solvent. This result was also found by Zimmer et al. [53]. Although a different way of spraying was used, the accuracy and precision of the spraying were high. Some optimization can be performed for both methods as the authors state themselves, but already it seems to be a good alternative for IS use. However, it is not clear what improvement is made in reference to the addition of the IS via the extraction solvent. As Abu-Rabie et al. showed, the accuracy and precision were good but no obvious improvement is presented. The article of Zimmer et al. did not compare with a reference method.
Addition of the IS in the extraction solvent is not how an IS should be used, but different methods of application in DBS sampling have some major disadvantages. The most promising alternative method of application is spraying the IS, but more research and optimization is required.
Automation
Although DBS sampling has several advantages for patients, sample handling is significantly increased for laboratories. Typical sample pretreatment of DBS samples involves punching, extraction, centrifugation, aliquot transfer, drying, and dissolution in an appropriate solvent. Furthermore, the duration of the extraction can be quite long. Naturally, varieties on this procedure are possible, but especially compared with protein precipitation of plasma, it is more laborious. It is therefore not surprising that several methods for automation have been proposed. Roughly three categories of automation can be distinguished, on-line desorption of a DBS sample, paper spray analysis of DBS samples, and fully automated extraction of DBS samples. On-line desorption involves the clamping of a DBS card or punched-out disk and the consecutive extraction with mobile phase or dedicated extraction solvents [54–56]. This method can be augmented with the addition of on-line SPE for sample cleanup. In the presented methods of Déglon and Thomas, good accuracy and precision was obtained, furthermore it is partly automated. The disadvantage of the presented method is the need for manual punching and the large diameter. It is our experience that in daily use it is difficult to obtain regular-shaped spots with the same sample volume. The large diameter makes it difficult to punch out a part of the DBS sample and when using the complete DBS it is necessary to determine the spotted volume.
Extraction of drugs from DBS cards with paper spray is the ionization of drugs directly from paper substrates. Briefly, a piece of paper is placed in front of the MS entrance and wetted with appropriate solvents. After wetting, an electric potential is applied to the paper that ionizes the drugs and migrates the drugs to the entrance of the MS detector [57–59]. One of the greatest advantages of this method is the speed of analysis; in mere minutes, drugs are extracted and analyzed. Additionally, low volumes of organic solvent are needed and no analytical column is required. The disadvantage of this method is the need to cut paper into triangular shapes, as similar to the on-line desorption method it is necessary to determine the spotted blood volume before analysis. The third category is full automation of the DBS analysis. Barcode-marked DBS samples are placed in a robot that performs all steps automatically. Methods are reported with on-line desorption [60] and a nano-electrospray platform [61]. The automated on-line desorption method showed better analyte response and required little organic solvent. However, some issues were mentioned regarding leakage and extraction recovery. The nano-electrospray method required little organic solvent and the analysis time was short. However, at the lower concentrations, the precision and accuracy increased rapidly.
Development of automated DBS analysis is likely to increase quickly; sample preparation of DBS samples is often more laborious than for plasma or blood. Automation can reduce analysis time, the use of organic solvents, and sample preparation time. However, the costs of robotic sample handlers can be quite high and more research has to be done. The majority of the reported methods are only tested in a controlled laboratory environment, with perfectly shaped DBS samples and known blood volumes. In daily routine analysis, more deviation in shape, volume, and Hct is expected; robotic sample handlers should be able to control these deviations.
Validation
Analysis of blood or plasma samples is daily practice and consequently the validation of the analytical methods. The analysis of DBS samples is, compared with blood and plasma samples, relatively new and less information was available on method validation. During the previous few years, this information has grown and this resulted in a guideline released by the European Bioanalysis Forum (EBF) [23] In short, testing the influence of hemolysis, anticoagulants, homogeneity of the sample, carry over, extraction recovery, multiple punches from a spot, stability, and good blood spotting practices (GBSP) is recommended. As can be seen in Table 1, several of the proposed validation parameters are tested regularly. The influence of HCT was validated in 39 % of the cited articles and the blood volume in 45 %. The punch location was tested by 13 % of the research groups and only one validated the spot homogeneity. The term GBSP is a direct analog to the GxP guidelines and is introduced by the EBF to show the importance of the quality of the blood spotting. This is a difficult parameter to validate, because most mentioned problems with GBSP are introduced when patients take the sample at home. In a laboratory setting or other controlled environment, it is much easier to control the spotting procedure.
Proficiency Testing for DBS Samples
There is no proficiency testing programs for TDM by DBS. The different types of matrices complicate the design of such a program. The Association for Quality Assessment in Therapeutic Drug Monitoring and Clinical Toxicology (KKGT, the Netherlands) is currently studying the potential for a proficiency testing program for DBS samples.
Review of Methods Published in the Previous 5 Years
Table 1 provides an overview of drugs for which TDM using the DBS method has been reported in the literature in the previous 5 years. The analyte concentrations in DBS are measured by the application of various quantitative analytical techniques, including GC-MS [62], HPLC-UV [63], HPLC fluorimetry [64], LC-MS/MS [65], and immunoassays [66]. The assay ranges indicated, however, seemed sufficient for TDM for almost all drugs; very specific and sensitive methods (e.g., LC-MS/MS) seem to be preferable. HPLC-DAD is applicable in the mg/L range [1, 67–69].
Sampling was performed using two methods: the first method (A) involves the sampling of a drop of whole blood directly on the sampling paper within a premarked circle, and the second method (B) requires accurately pipetting capillary blood with a pipette on sampling paper. In method A, a paper disc is punched out from the DBS with a smaller diameter than the blood spot itself. The punching technique must be reproducible, and a special punching apparatus is necessary [70]. The disc represents a volumetric measurement comparable to a liquid measurement. The use of various brands of sampling paper is described in the publications, but the precise nature of the paper is not always mentioned [71].
In nearly all papers, the analytical validation seems adequate in terms of the current standards as described in the guideline on bioanalytical method validation [72]. However, the impact of variations of Hct values, spotted blood volume, and spot homogeneity are lacking in many articles.
Clinical validation is sometimes lacking in the articles, considering genuine clinical validations to be comparisons of concentrations found in venous samples and DBS samples, taken at the same time, and consecutive statistical analysis. In some papers, however, no comparison with venous sampling was made or only a few concentration-time curves, constructed with DBS samples, are presented. Sometimes a form of ‘‘in vitro’’ validation was performed: DBS samples were produced in vitro in the laboratory with the help of venous whole blood samples from humans. Concentrations, measured in these DBS samples, were then compared with concentrations found in the original whole blood samples. We have scored this as a limited validation. The stability of medicines in DBS samples during storage was studied in most of the articles in Table 1. Most analytes investigated in the DBSs were reported to be fairly stable.
Discussion
The standardization of the DBS technique that Edelbroek et al. [17] advocated in 2009 is not materialized. Whole spot cutting, pre-cut spots, and DPS are new developments in the previous 5 years. There are two areas in TDM where the DBS technique has significant advantages: home sampling by the patient and TDM in infants and neonates. These two areas have different requirements regarding the DBS technique. For home sampling, it is necessary that the patient may learn the technique by means of a short training session. There are currently no devices for volumetric application that are suitable to be used by a patient. In contrast, volumetric application of a DBS by a healthcare professional is a viable route. These professionals can be adequately trained and can acquire experience. This allows a wider choice of the DBS techniques used in infants and neonates. In developing a DBS method, it is important to define the scope: home sampling or sampling in remote areas, influence of Hct, and the need for converting blood concentration to plasma concentration. These requirements will be foremost in the selection of the most suitable DBS method.
Conclusion
DBS sampling is increasingly used in TDM. Several methods have been developed to correct for or minimize the influence of Hct on the measurements. The studies published on DBS sampling in TDM frequently show an adequate analytical validation, but limited clinical validation. Promising developments are DPS using membranes and Hct correction using the potassium concentration.
Acknowledgments
No sources of funding were used in the preparation of this review. The authors have no potential conflicts of interest to disclose.
Reference
- 1.Shah NM, Hawwa AF, Millership JS, Collier PS, McElnay JC. A simple bioanalytical method for the quantification of antiepileptic drugs in dried blood spots. J Chromatogr B Analyt Technol Biomed Life Sci. 2013;923–924:65–73. doi: 10.1016/j.jchromb.2013.02.005. [DOI] [PubMed] [Google Scholar]
- 2.Popov TV, Maricic LC, Prosen H, Voncina DB. Development and validation of dried blood spots technique for quantitative determination of topiramate using liquid chromatography-tandem mass spectrometry. Biomed Chromatogr. 2013;27:1054–1061. doi: 10.1002/bmc.2905. [DOI] [PubMed] [Google Scholar]
- 3.Koop DR, Bleyle LA, Munar M, Cherala G, Al-Uzri A. Analysis of tacrolimus and creatinine from a single dried blood spot using liquid chromatography tandem mass spectrometry. J Chromatogr B Anal Technol Biomed Life Sci. 2013;926:54–61. doi: 10.1016/j.jchromb.2013.02.035. [DOI] [PMC free article] [PubMed] [Google Scholar]
- 4.Li Q, Cao D, Huang Y, Xu H, Yu C, Li Z. Development and validation of a sensitive LC-MS/MS method for determination of tacrolimus on dried blood spots. Biomed Chromatogr. 2013;27:327–334. doi: 10.1002/bmc.2795. [DOI] [PubMed] [Google Scholar]
- 5.Egas AC, Van Maarseveen EM, Kwakkel-Van Erp JM, et al. Rapid and combined measurement of cyclosporin a, tacrolimus, sirolimus and everolimus in whole blood and dried blood spot with LC-MSMS. J Heart Lung Transplant. 2014;S33:S68. doi: 10.1016/j.healun.2014.01.217. [DOI] [Google Scholar]
- 6.Koster RA, Alffenaar JW, Greijdanus B, Uges DR. Fast LC-MS/MS analysis of tacrolimus, sirolimus, everolimus and cyclosporin A in dried blood spots and the influence of the hematocrit and immunosuppressant concentration on recovery. Talanta. 2013;115:47–54. doi: 10.1016/j.talanta.2013.04.027. [DOI] [PubMed] [Google Scholar]
- 7.Hoffman JT, Rossi SS, Espina-Quinto R, Letendre S, Capparelli EV. Determination of efavirenz in human dried blood spots by reversed-phase high-performance liquid chromatography with UV detection. Ther Drug Monit. 2013;35:203–208. doi: 10.1097/FTD.0b013e31827fb72b. [DOI] [PMC free article] [PubMed] [Google Scholar]
- 8.Castillo-Mancilla JR, Zheng JH, Rower JE, et al. Tenofovir, emtricitabine, and tenofovir diphosphate in dried blood spots for determining recent and cumulative drug exposure. AIDS Res Hum Retrovir. 2013;29:384–390. doi: 10.1089/aid.2012.0089. [DOI] [PMC free article] [PubMed] [Google Scholar]
- 9.Zheng JH, Guida LA, Rower C, et al. Quantitation of tenofovir and emtricitabine in dried blood spots (DBS) with LC-MS/MS. J Pharm Biomed Anal. 2014;88:144–151. doi: 10.1016/j.jpba.2013.08.033. [DOI] [PMC free article] [PubMed] [Google Scholar]
- 10.Lawson G, Cocks E, Tanna S. Bisoprolol, ramipril and simvastatin determination in dried blood spot samples using LC-HRMS for assessing medication adherence. J Pharm Biomed Anal. 2013;81–82:99–107. doi: 10.1016/j.jpba.2013.04.002. [DOI] [PubMed] [Google Scholar]
- 11.Deglon J, Thomas A, Daali Y, et al. Automated system for on-line desorption of dried blood spots applied to LC/MS/MS pharmacokinetic study of flurbiprofen and its metabolite. J Pharm Biomed Anal. 2011;54:359–367. doi: 10.1016/j.jpba.2010.08.032. [DOI] [PubMed] [Google Scholar]
- 12.Berm EJJ, Brummel-Mulder E, Paardekooper J, Hak E, Wilffert B, Maring JG. Determination of venlafaxine and O-desmethylvenlafaxine in dried blood spots using LC-MS/MS. Ther Drug Monit. 2013;35:659–660. [Google Scholar]
- 13.Hawwa AF, AlBawab A, Rooney M, Wedderburn LR, Beresford MW, McElnay JC. A novel dried blood spot-LCMS method for the quantification of methotrexate polyglutamates as a potential marker for methotrexate use in children. PLoS One. 2014;9:e89908. doi: 10.1371/journal.pone.0089908. [DOI] [PMC free article] [PubMed] [Google Scholar]
- 14.la Marca G, Giocaliere E, Villanelli F, et al. Development of an UPLC-MS/MS method for the determination of antibiotic ertapenem on dried blood spots. J Pharm Biomed Anal. 2012;61:108–113. doi: 10.1016/j.jpba.2011.12.018. [DOI] [PubMed] [Google Scholar]
- 15.Vu DH, Koster RA, Alffenaar JWC, Brouwers JRBJ, Uges DRA. Determination of moxifloxacin in dried blood spots using LC-MS/MS and the impact of the hematocrit and blood volume. J Chromatogr B Anal Technol Biomed Life Sci. 2011;879:1063–1070. doi: 10.1016/j.jchromb.2011.03.017. [DOI] [PubMed] [Google Scholar]
- 16.Vu DH, Bolhuis MS, Koster RA, et al. Dried blood spot analysis for therapeutic drug monitoring of linezolid in patients with multidrug-resistant tuberculosis. Antimicrob Agents Chemother. 2012;56:5758–5763. doi: 10.1128/AAC.01054-12. [DOI] [PMC free article] [PubMed] [Google Scholar]
- 17.Edelbroek PM, van der Heijden J, Stolk LM. Dried blood spot methods in therapeutic drug monitoring: methods, assays, and pitfalls. Ther Drug Monit. 2009;31:327–336. doi: 10.1097/FTD.0b013e31819e91ce. [DOI] [PubMed] [Google Scholar]
- 18.D’Arienzo CJ, Ji QC, Discenza L, et al. DBS sampling can be used to stabilize prodrugs in drug discovery rodent studies without the addition of esterase inhibitors. Bioanalysis. 2010;2:1415–1422. doi: 10.4155/bio.10.94. [DOI] [PubMed] [Google Scholar]
- 19.Li W, Zhang J, Tse FL. Strategies in quantitative LC-MS/MS analysis of unstable small molecules in biological matrices. Biomed Chromatogr. 2011;25:258–277. doi: 10.1002/bmc.1572. [DOI] [PubMed] [Google Scholar]
- 20.Meesters RJW, Hooff GP, Gruters R, Van Kampen JJA, Luider TM. Incurred sample reanalysis comparison of dried blood spots and plasma samples on the measurement of lopinavir in clinical samples. Bioanalysis. 2012;4:237–240. doi: 10.4155/bio.11.328. [DOI] [PubMed] [Google Scholar]
- 21.Rao RN, Maurya PK, Ramesh M, Srinivas R, Agwane SB. Development of a validated high-throughput LC-ESI-MS method for determination of sirolimus on dried blood spots. Biomed Chromatogr. 2010;24:1356–1364. doi: 10.1002/bmc.1450. [DOI] [PubMed] [Google Scholar]
- 22.Shipping guidelines for dried-blood spot specimens. 2014. Ref Type: Internet Communication.
- 23.Timmerman P, White S, Globig S, Ludtke S, Brunet L, Smeraglia J. EBF recommendation on the validation of bioanalytical methods for dried blood spots. Bioanalysis. 2011;3:1567–1575. doi: 10.4155/bio.11.132. [DOI] [PubMed] [Google Scholar]
- 24.Emmons G, Rowland M. Pharmacokinetic considerations as to when to use dried blood spot sampling. Bioanalysis. 2010;2:1791–1796. doi: 10.4155/bio.10.159. [DOI] [PubMed] [Google Scholar]
- 25.De Kesel PM, Sadones N, Capiau S, Lambert WE, Stove CP. Hemato-critical issues in quantitative analysis of dried blood spots: challenges and solutions. Bioanalysis. 2013;5:2023–2041. doi: 10.4155/bio.13.156. [DOI] [PubMed] [Google Scholar]
- 26.Ingels AS, De PP, Anseeuw K, et al. Dried blood spot punches for confirmation of suspected gamma-hydroxybutyric acid intoxications: validation of an optimized GC-MS procedure. Bioanalysis. 2011;3:2271–2281. doi: 10.4155/bio.11.204. [DOI] [PubMed] [Google Scholar]
- 27.Denniff P, Spooner N. The effect of hematocrit on assay bias when using DBS samples for the quantitative bioanalysis of drugs. Bioanalysis. 2010;2:1385–1395. doi: 10.4155/bio.10.103. [DOI] [PubMed] [Google Scholar]
- 28.O’Mara M, Hudson-Curtis B, Olson K, Yueh Y, Dunn J, Spooner N. The effect of hematocrit and punch location on assay bias during quantitative bioanalysis of dried blood spot samples. Bioanalysis. 2011;3:2335–2347. doi: 10.4155/bio.11.220. [DOI] [PubMed] [Google Scholar]
- 29.Ren X, Paehler T, Zimmer M, Guo Z, Zane P, Emmons GT. Impact of various factors on radioactivity distribution in different DBS papers. Bioanalysis. 2010;2:1469–1475. doi: 10.4155/bio.10.96. [DOI] [PubMed] [Google Scholar]
- 30.Fan L, Lee J, Hall J, Tolentino EJ, Wu H, El-Shourbagy T. Implementing DBS methodology for the determination of Compound A in monkey blood: GLP method validation and investigation of the impact of blood spreading on performance. Bioanalysis. 2011;3:1241–1252. doi: 10.4155/bio.11.97. [DOI] [PubMed] [Google Scholar]
- 31.Fan L, Lee JA. Managing the effect of hematocrit on DBS analysis in a regulated environment. Bioanalysis. 2012;4:345–347. doi: 10.4155/bio.11.337. [DOI] [PubMed] [Google Scholar]
- 32.Youhnovski N, Bergeron A, Furtado M, Garofolo F. Pre-cut dried blood spot (PCDBS): an alternative to dried blood spot (DBS) technique to overcome hematocrit impact. Rapid Commun Mass Spectrom. 2011;25:2951–2958. doi: 10.1002/rcm.5182. [DOI] [PubMed] [Google Scholar]
- 33.Meesters RJW, Hooff GP. State-of-the-art dried blood spot analysis: an overview of recent advances and future trends. Bioanalysis. 2013;5:2187–2208. doi: 10.4155/bio.13.175. [DOI] [PubMed] [Google Scholar]
- 34.Li F, Zulkoski J, Fast D, Michael S. Perforated dried blood spots: a novel format for accurate microsampling. Bioanalysis. 2011;3:2321–2333. doi: 10.4155/bio.11.219. [DOI] [PubMed] [Google Scholar]
- 35.Meesters RJ, Zhang J, van Huizen NA, Hooff GP, Gruters RA, Luider TM. Dried matrix on paper disks: the next generation DBS microsampling technique for managing the hematocrit effect in DBS analysis. Bioanalysis. 2012;4:2027–2035. doi: 10.4155/bio.12.175. [DOI] [PubMed] [Google Scholar]
- 36.Baietto L, D’Avolio A, Ariaudo A, et al. Development and validation of a new UPLC-PDA method to quantify linezolid in plasma and in dried plasma spots. J Chromatogr B Anal Technol Biomed Life Sci. 2013;936:42–47. doi: 10.1016/j.jchromb.2013.08.003. [DOI] [PubMed] [Google Scholar]
- 37.Baietto L, D’Avolio A, Pace S, et al. Development and validation of an UPLC-PDA method to quantify daptomycin in human plasma and in dried plasma spots. J Pharm Biomed Anal. 2014;88:66–70. doi: 10.1016/j.jpba.2013.08.022. [DOI] [PubMed] [Google Scholar]
- 38.D’Avolio A, Simiele M, Siccardi M, et al. HPLC-MS method for the quantification of nine anti-HIV drugs from dry plasma spot on glass filter and their long term stability in different conditions. J Pharm Biomed Anal. 2010;52:774–780. doi: 10.1016/j.jpba.2010.02.026. [DOI] [PubMed] [Google Scholar]
- 39.Kolocouri F, Dotsikas Y, Loukas YL. Dried plasma spots as an alternative sample collection technique for the quantitative LC-MS/MS determination of gabapentin. Anal Bioanal Chem. 2010;398:1339–1347. doi: 10.1007/s00216-010-4048-2. [DOI] [PubMed] [Google Scholar]
- 40.Barfield M, Wheller R. Use of dried plasma spots in the determination of pharmacokinetics in clinical studies: validation of a quantitative bioanalytical method. Anal Chem. 2011;83:118–124. doi: 10.1021/ac102003t. [DOI] [PubMed] [Google Scholar]
- 41.Li Y, Henion J, Abbott R, Wang P. The use of a membrane filtration device to form dried plasma spots for the quantitative determination of guanfacine in whole blood. Rapid Commun Mass Spectrom. 2012;26:1208–1212. doi: 10.1002/rcm.6212. [DOI] [PubMed] [Google Scholar]
- 42.Kim JH, Woenker T, Adamec J, Regnier FE. Simple, miniaturized blood plasma extraction method. Anal Chem. 2013;85:11501–11508. doi: 10.1021/ac402735y. [DOI] [PubMed] [Google Scholar]
- 43.Capiau S, Stove VV, Lambert WE, Stove CP. Prediction of the hematocrit of dried blood spots via potassium measurement on a routine clinical chemistry analyzer. Ther Drug Monit. 2013;35:659. doi: 10.1021/ac303014b. [DOI] [PubMed] [Google Scholar]
- 44.Erdi A, Thomas DP, Kakkar VV, Lane DA. Effect of low-dose subcutaneous heparin on whole-blood viscosity. Lancet. 1976;2:342–344. doi: 10.1016/S0140-6736(76)92595-2. [DOI] [PubMed] [Google Scholar]
- 45.Luckwell J, Danielson A, Johnson B, Clegg S, Green M, Pierce A. Applications and chemistry of cellulose papers for dried blood spot. In: Li W, Lee MS, editorss. Dried blood spots application and techniques. Oxford: Wiley, 2014.
- 46.Lawson G, Cocks E, Tanna S. Quantitative determination of atenolol in dried blood spot samples by LC-HRMS: a potential method for assessing medication adherence. J Chromatogr B Analyt Technol Biomed Life Sci. 2012;897:72–79. doi: 10.1016/j.jchromb.2012.04.013. [DOI] [PubMed] [Google Scholar]
- 47.Li W, Doherty JP, Kulmatycki K, Smith HT, Tse FL. Simultaneous LC-MS/MS quantitation of acetaminophen and its glucuronide and sulfate metabolites in human dried blood spot samples collected by subjects in a pilot clinical study. Bioanalysis. 2012;4:1429–1443. doi: 10.4155/bio.12.119. [DOI] [PubMed] [Google Scholar]
- 48.Reddy TM, Tama CI, Hayes RN. A dried blood spots technique based LC-MS/MS method for the analysis of posaconazole in human whole blood samples. J Chromatogr B Analyt Technol Biomed Life Sci. 2011;879:3626–3638. doi: 10.1016/j.jchromb.2011.10.008. [DOI] [PubMed] [Google Scholar]
- 49.Luckwell J, Denniff P, Capper S, et al. Assessment of the within- and between-lot variability of Whatman FTA((R)) DMPK and 903((R)) DBS papers and their suitability for the quantitative bioanalysis of small molecules. Bioanalysis. 2013;5:2613–2630. doi: 10.4155/bio.13.227. [DOI] [PubMed] [Google Scholar]
- 50.Geditz MC, Lindner W, Lammerhofer M et al. Simultaneous quantification of mefloquine (+)- and (-)-enantiomers and the carboxy metabolite in dried blood spots by liquid chromatography/tandem mass spectrometry. J Chromatogr B Analyt Technol Biomed Life Sci. 2013. [DOI] [PubMed]
- 51.Eibak LE, Hegge AB, Rasmussen KE, et al. Alginate and chitosan foam combined with electromembrane extraction for dried blood spot analysis. Anal Chem. 2012; 84(20):8783–9. [DOI] [PubMed]
- 52.Abu-Rabie P, Denniff P, Spooner N, Brynjolffssen J, Galluzzo P, Sanders G. Method of applying internal standard to dried matrix spot samples for use in quantitative bioanalysis. Anal Chem. 2011;83:8779–8786. doi: 10.1021/ac202321q. [DOI] [PubMed] [Google Scholar]
- 53.Zimmer D, Hassler S, Betschart B, Sack S, Fankhauser C, Loppacher M. Internal standard application to dried blood spots by spraying: investigation of the internal standard distribution. Bioanalysis. 2013;5:711–719. doi: 10.4155/bio.13.21. [DOI] [PubMed] [Google Scholar]
- 54.Deglon J, Thomas A, Cataldo A, Mangin P, Staub C. On-line desorption of dried blood spot: a novel approach for the direct LC/MS analysis of micro-whole blood samples. J Pharm Biomed Anal. 2009;49:1034–1039. doi: 10.1016/j.jpba.2009.02.001. [DOI] [PubMed] [Google Scholar]
- 55.Thomas A, Deglon J, Steimer T, Mangin P, Daali Y, Staub C. On-line desorption of dried blood spots coupled to hydrophilic interaction/reversed-phase LC/MS/MS system for the simultaneous analysis of drugs and their polar metabolites. J Sep Sci. 2010;33:873–879. doi: 10.1002/jssc.200900593. [DOI] [PubMed] [Google Scholar]
- 56.Ooms JA, Knegt L, Koster EH. Exploration of a new concept for automated dried blood spot analysis using flow-through desorption and online SPE-MS/MS. Bioanalysis. 2011;3:2311–2320. doi: 10.4155/bio.11.214. [DOI] [PubMed] [Google Scholar]
- 57.Liu J, Wang H, Manicke NE, Lin JM, Cooks RG, Ouyang Z. Development, characterization, and application of paper spray ionization. Anal Chem. 2010;82:2463–2471. doi: 10.1021/ac902854g. [DOI] [PubMed] [Google Scholar]
- 58.Zhang Y, Li H, Ma Y, Lin JM. Paper spray mass spectrometry-based method for analysis of droplets in a gravity-driven microfluidic chip. Analyst. 2014;139:1023–1029. doi: 10.1039/c3an01769a. [DOI] [PubMed] [Google Scholar]
- 59.Manicke NE, Abu-Rabie P, Spooner N, Ouyang Z, Cooks RG. Quantitative analysis of therapeutic drugs in dried blood spot samples by paper spray mass spectrometry: an avenue to therapeutic drug monitoring. J Am Soc Mass Spectrom. 2011;22:1501–1507. doi: 10.1007/s13361-011-0177-x. [DOI] [PubMed] [Google Scholar]
- 60.Abu-Rabie P, Spooner N. Direct quantitative bioanalysis of drugs in dried blood spot samples using a thin-layer chromatography mass spectrometer interface. Anal Chem. 2009;81:10275–10284. doi: 10.1021/ac901985e. [DOI] [PubMed] [Google Scholar]
- 61.Kertesz V, Van Berkel GJ. Fully automated liquid extraction-based surface sampling and ionization using a chip-based robotic nanoelectrospray platform. J Mass Spectrom. 2010;45:252–260. doi: 10.1002/jms.1709. [DOI] [PubMed] [Google Scholar]
- 62.Kong ST, Lim WH, Wang HY, Ng YL, Ho PC, Lim S. Comparison of dried blood spots and plasma valproic acid and carbamazepine levels. Epilepsia. 2012;53:116. doi: 10.1111/j.1528-1167.2012.03482.x. [DOI] [PubMed] [Google Scholar]
- 63.Gitau EN, Muchohi SN, Ogutu BR, Githiga IM, Kokwaro GO. Selective and sensitive liquid chromatographic assay of amodiaquine and desethylamodiaquine in whole blood spotted on filter paper. J Chromatogr B Analyt Technol Biomed Life Sci. 2004;799:173–177. doi: 10.1016/j.jchromb.2003.10.006. [DOI] [PubMed] [Google Scholar]
- 64.Romsing S, Lindegardh N, Bergqvist Y. Determination of tafenoquine in dried blood spots and plasma using LC and fluorescence detection. Bioanalysis. 2011;3:1847–1853. doi: 10.4155/bio.11.173. [DOI] [PubMed] [Google Scholar]
- 65.Chahbouni A, Sinjewel A, den Burger JC, et al. Rapid quantification of gabapentin, pregabalin, and vigabatrin in human serum by ultraperformance liquid chromatography with mass-spectrometric detection. Ther Drug Monit. 2013;35:48–53. doi: 10.1097/FTD.0b013e31827788c0. [DOI] [PubMed] [Google Scholar]
- 66.Li PK, Lee JT, Conboy KA, Ellis EF. Fluorescence polarization immunoassay for theophylline modified for use with dried blood spots on filter paper. Clin Chem. 1986;32:552–555. [PubMed] [Google Scholar]
- 67.Arpini J, Antunes MV, Pacheco LS, et al. Clinical evaluation of a dried blood spot method for determination of mycophenolic acid in renal transplant patients. Clin Biochem. 2013;46:1905–1908. doi: 10.1016/j.clinbiochem.2013.10.011. [DOI] [PubMed] [Google Scholar]
- 68.Suyagh M, Collier PS, Millership JS, et al. Metronidazole population pharmacokinetics in preterm neonates using dried blood-spot sampling. Pediatrics. 2011;127:e367–e374. doi: 10.1542/peds.2010-0807. [DOI] [PubMed] [Google Scholar]
- 69.Wilhelm AJ, den Burger JC, Chahbouni A, Vos RM, Sinjewel A. Analysis of mycophenolic acid in dried blood spots using reversed phase high performance liquid chromatography. J Chromatogr B Analyt Technol Biomed Life Sci. 2009;877:3916–3919. doi: 10.1016/j.jchromb.2009.09.037. [DOI] [PubMed] [Google Scholar]
- 70.Hoogtanders K, van der Heijden J, Christiaans M, Edelbroek P, van Hooff JP, Stolk LM. Therapeutic drug monitoring of tacrolimus with the dried blood spot method. J Pharm Biomed Anal. 2007;44:658–664. doi: 10.1016/j.jpba.2006.11.023. [DOI] [PubMed] [Google Scholar]
- 71.Nageswara RR, Satyanarayana RS, Mastan VR, Sarma VU, Girija SG. LC-ESI-MS/MS determination of paclitaxel on dried blood spots. Biomed Chromatogr. 2012;26:616–621. doi: 10.1002/bmc.1706. [DOI] [PubMed] [Google Scholar]
- 72.European Medicines Agency. Guideline on bioanalytical method validation. 2012. http://www.ema.europa.eu/docs/en_GB/document_library/Scientific_guideline/2011/08/WC500109686.pdf. Accessed 1 Sep 2014. [DOI] [PubMed]
- 73.Taylor RR, Hoffman KL, Schniedewind B, Clavijo C, Galinkin JL, Christians U. Comparison of the quantification of acetaminophen in plasma, cerebrospinal fluid and dried blood spots using high-performance liquid chromatography-tandem mass spectrometry. J Pharm Biomed Anal. 2013; 83:1–9. [DOI] [PMC free article] [PubMed]
- 74.Rao RN, Raju SS, Vali RM, Sankar GG. Liquid chromatography-mass spectrometric determination of losartan and its active metabolite on dried blood spots. J Chromatogr B Analyt Technol Biomed Life Sci. 2012; 902:47–54. [DOI] [PubMed]
- 75.la Marca G, Villanelli F, Malvagia S et al. Rapid and sensitive LC-MS/MS method for the analysis of antibiotic linezolid on dried blood spot. J Pharm Biomed Anal. 2012; 67–68:86–91. [DOI] [PubMed]
- 76.Rao RN, Vali RM, Ramachandra B, Maurya PK. Rapid determination of rifaximin on dried blood spots by LC-ESI-MS. Biomed Chromatogr. 2011; 25:1201–1207. [DOI] [PubMed]
- 77.la Marca G, Malvagia S, Filippi L et al. Rapid assay of rufinamide in dried blood spots by a new liquid chromatography-tandem mass spectrometric method. J Pharm Biomed Anal. 2011; 54:192–197. [DOI] [PubMed]
- 78.la MG, Malvagia S, Filippi L, Luceri F, Moneti G, Guerrini R. A new rapid micromethod for the assay of phenobarbital from dried blood spots by LC-tandem mass spectrometry. Epilepsia 2009; 50:2658–2662. [DOI] [PubMed]
- 79.Deglon J, Lauer E, Thomas A, Mangin P, Staub C. Use of the dried blood spot sampling process coupled with fast gas chromatography and negative-ion chemical ionization tandem mass spectrometry: application to fluoxetine, norfluoxetine, reboxetine, and paroxetine analysis. Anal Bioanal Chem. 2010; 396:2523–2532. [DOI] [PubMed]
- 80.Van Der Elst KCM, Span LFR, Van Hateren K et al. Dried blood spot analysis suitable for therapeutic drug monitoring of voriconazole, fluconazole, and posaconazole. Antimicrob Agents Chemother. 2013; 57:4999–5004. [DOI] [PMC free article] [PubMed]
- 81.Jimmerson LC, Zheng JH, Bushman LR, MacBrayne CE, Anderson PL, Kiser JJ. Development and validation of a dried blood spot assay for the quantification of ribavirin using liquid chromatography coupled to mass spectrometry. J Chromatogr B Anal Technol Biomed Life Sci. 2014; 944:18–24. [DOI] [PMC free article] [PubMed]
- 82.Meesters RJW, Van Kampen JJA, Reedijk ML et al. Ultrafast and high-throughput mass spectrometric assay for therapeutic drug monitoring of antiretroviral drugs in pediatric HIV-1 infection applying dried blood spots. Anal Bioanal Chem. 2010; 398:319–328. [DOI] [PMC free article] [PubMed]
- 83.Suyagh MF, Kole PL, Millership J, Collier P, Halliday H, McElnay JC. Development and validation of a dried blood spot-LC-APCI-MS assay for estimation of canrenone in paediatric samples. J Chromatogr B Analyt Technol Biomed Life Sci. 2010; 878:769–776. [DOI] [PubMed]
- 84.Yakkundi S, Millership J, Collier P, Shields MD, McElnay J. Development andvalidation of a dried blood spot LC-MS/MS assay to quantify ranitidine in paediatricsamples. J Pharm Biomed Anal. 2011; 56:1057–1063. [DOI] [PubMed]
- 85.Wilhelm AJ, Klijn A, Burger JCG, Veldkamp AI, Janssen JJWM, Swart N. Validation of dried blood spot sampling in therapeutic drug monitoring of cyclosporin. Ther Drug Monit. 2011; 33:545.
- 86.Wilhelm AJ, Klijn A, Den Burger JCG et al. Clinical validation of dried blood spotsampling in therapeutic drug monitoring of ciclosporin a in allogeneic stem cell transplant recipients: Direct comparison between capillary and venous sampling. Ther Drug Monit. 2013; 35:92–95. [DOI] [PubMed]
- 87.Sadilkova K, Busby B, Dickerson JA, Rutledge JC, Jack RM. Clinical validation and implementation of a multiplexed immunosuppressant assay in dried blood spots by LC-MS/MS. Clin Chim Acta. 2013; 421:152–156. [DOI] [PubMed]
- 88.Ansari M, Uppugunduri CR, Deglon J et al. A simplified method for busulfan monitoring using dried blood spot in combination with liquid chromatography/tandem mass spectrometry. Rapid Commun Mass Spectrom. 2012; 26:1437–1446. [DOI] [PubMed]
- 89.Kralj E, Trontelj J, Pajic T, Kristl A. Simultaneous measurement of imatinib, nilotinib and dasatinib in dried blood spot by ultra high performance liquid chromatography tandem mass spectrometry. J Chromatogr B Anal Technol Biomed Life Sci. 2012; 903:150–156. [DOI] [PubMed]
- 90.Hatami M, Karimnia E, Farhadi K. Determination of salmeterol in dried blood spot using an ionic liquid based dispersive liquid-liquid microextraction coupled with HPLC. J Pharm Biomed Anal. 2013; 85:283–287. [DOI] [PubMed]
- 91.Della Bona ML, Malvagia S, Villanelli F et al. A rapid liquid chromatography tandem mass spectrometry-based method for measuring propranolol on dried blood spots. J Pharm Biomed Anal. 2013; 78–79:34–38. [DOI] [PubMed]