Abstract
The veridical perception of collinearity between two separated lines is distorted by two parallel lines in the space between them (the Poggendorff illusion). This paper tests the conjecture that the perception of collinearity of separated lines is based on a two-stage mechanism. The first stage encodes the orientation of the virtual line between the proximal terminators of the target lines. The second stage compares this virtual orientation with the orientation of the target lines themselves. Errors can and do arise from either process. Two parallel lines, abutting against the target lines, cause the classical Poggendorff misalignment bias. The magnitude of the bias is increased by Gaussian blur, as is a version of the Poggendorff figure containing only acute angles. In the obtuse-angle figure, on the other hand, blur decreases the misalignment bias. We argue that the acute- and obtuse-angle biases depend upon different mechanisms, and that the obtuse-angle effect is more related to the obtuse-angle version of the Muller–Lyer illusion, which is also decreased by blur. If observers attempt to match the orientation of the virtual line between the two line intersections in the Poggendorff figure they make an error in the same direction as the Poggendorff bias. The orientation of the target lines in the figure, however, is veridically matched to a Gabor-patch probe, unless the target lines are very short, in which case the error is in the same direction as the Poggendorff bias. A small bend in the target lines where they abut the parallels increases the Poggendorff bias if it makes the line more orthogonal to the parallel, but has little effect in the opposite direction. The Poggendorff bias is unlikely to depend upon biases in first-stage linear filters because (a) it still exists in figures composed of short, luminance-balanced lines which are defined by contrast only; and (b) it also exists if the parallels are replaced by grating patches with the same mean luminance as the background. The orientation of the grating in the latter case affects the magnitude of the bias, but even an orientation which should reverse the Poggendorff bias by the mechanism of cross-orientation inhibition fails to do so. The Poggendorff bias is a complex effect arising from several sources. Blurring in second-stage filters with large receptive fields can explain many aspects of the phenomenon.
Keywords: Poggendorff bias, Muller–Lyer illusion, Gaussian blur
1. Introduction
To understand the mechanisms of the classical geometric illusions like the Poggendorff and Muller–Lyer (Tolansky, 1964) we need to ask basic questions. How are lengths encoded and compared? How are angles encoded and compared? Attempts to explain classical geometric illusions such as the Poggendorff have been hampered by the tendency to assume that the metrics for these processes are analogue and self-evident. Another reason why the geometric illusions have proved so resistant to explanation is that each illusion probably combines several smaller illusions. Unfortunately, the classical illusions have evolved in the literature to be conspicuous rather than to be informative, and they have thereby come to combine several distinct effects (Coren & Girgus, 1978; Hotopf & Hibberd, 1989; Morgan & Casco, 1990).
The Poggendorff illusion is a clear example of this confounding of several distinct phenomena. For example, the reason why the Poggendorff figure is usually presented with the parallels vertical is that the illusion is most striking in this orientation: the effect is reduced if the figure is rotated through 90° (Day & Dickinson, 1979) Hotopf and Hibberd (1989) cogently argued that this is because the Poggendorff illusion combines at least two effects: one is the effect that is seen with the figure in any orientation; the other is the orientation-dependent Zehender (1899) effect, which causes virtual 45° lines to be estimated as closer to the vertical than in fact they are. Failure to factor out the Zehender component has led to the mistaken conclusion that acute angle intersections cannot have anything to do with the Poggendorff effect. One argument has been that a misalignment is still seen when the parallels are replaced by subjective contours (Farne, 1970) or by dots at their ends (Coren, 1970) These Poggendorff effects were illustrated with the figure in its usual vertical orientation, in which the Zehender effect was operative. If these same figures are rotated through 90° the Zehender effect becomes an anti-Poggendorff effect (Hotopf & Hibberd, 1989). Another possibly mistaken argument is that the Poggendorff effect can have nothing do with acute angle intersections, since it survives in the amputated oblique only version (Fig. 1). This argument ignores the possibility that the obliques-only effect is unrelated to the original Poggendorff effect, or is perhaps only one small part of it. In general, understanding of the classical illusions has not been advanced by a tendency of authors to introduce amputated or altered versions of an illusion in an attempt to bolster their own theories and refute rival ones: this style of research is pointless if it is not accompanied by proof that the different figures expose a common mechanism.
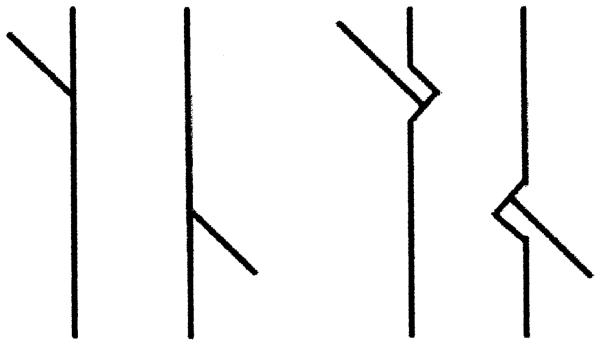
Fig. 1.
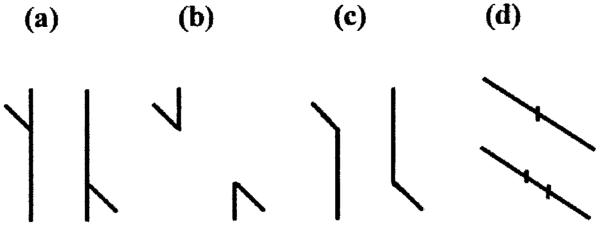
The classical version of the Poggendorff effect (a) and the acute-angle only (b) and obtuse-angle (c) only versions. (d) is a form of the Tolansky (1964) figure introduced by Day and Kasperczyk (1985) and related by them to the Poggendorff effect. We argue in this paper that (d) is a simple vernier alignment effect that has nothing to do with the Poggendorff.
The following series of arguments and experiments will attempt to show that a key component of the original Poggendorff effect is spatial blurring by second-order filters. Our model is similar to that of Glass (1970), but we show (contrary to Glass) that first-order blur cannot be the explanation. First-order blur operates strictly in the luminance domain. We shall show that the Poggendorff illusion is still present in figures where the critical features are defined by contrast rather than by luminance.
1.1. The Poggendorff figure: a computational analysis
The observer’s task is to determine whether two lines with a gap between them are collinear. If they are not collinear, the observer must be able to decide in which direction one of the lines should be moved in order to make them so (see Experiment 1 below) The last requirement rules out any model in which the observer is allowed to move one of the lines so as to maximise the output of one or more oriented filters spanning the whole figure. Formally, two lines are collinear in the Euclidean metric when there exists one, and only one straight line, of which they are segments. We therefore conjecture that observers test for collinearity by comparing the orientation of the visible lines with that of the virtual line joining their proximal ends. The illusion is caused by a misestimation of the orientation of the virtual line (Fig. 2). Since this line is virtual rather than real, its orientation can only be estimated from its endpoints. These endpoints are mislocated, for reasons that are given below, into the acute angles of the figure. Thus, in Fig. 2, the virtual line is estimated as having the orientation of the line i, j instead of b, c. The orientation of the real lines a, b and c, d are measured correctly. There is therefore a discrepancy between the real and the virtual line orientations, which can be eliminated by moving the line c, d upwards. This is the direction of the Poggendorff illusion.
Fig. 2.
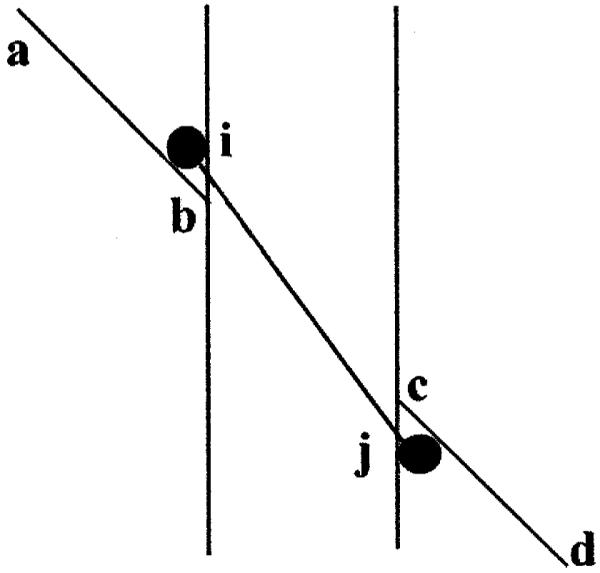
The figure illustrates a model for the Poggendorff illusion. The observer judges lines a, b and c, d to be collinear when they have the same orientation and this orientation is the same as the virtual line joining their points of intersection b, c with the vertical parallels, e, f and g, h. However, these termination points are mislocated following spatial filtering at points i, j. The orientation of the virtual line i, j thus differs from that of a, b, c, d and an illusory misalignment results. For details of the filtering process see the text.
We know that the mechanisms for responding to the orientation of virtual lines are present in the visual system. The apparent orientation of virtual lines has been studied in separated-vernier, 2-dot alignment and 3-dot vernier alignment tasks (Westheimer, 1979, 1981; Levi & Klein, 1986; Wilson, 1986; Burbeck, 1987; Morgan, 1990; Levi & Waugh, 1996; Mussap & Levi, 1996). It is unlikely that first-stage filters are used in these tasks because of the distances involved, and because accuracy is unaffected by making the features of opposite contrast polarity. Morgan (1990) and Levi and Westheimer (1987) found the same for spatial interval acuity). Accuracy is also unaffected by spatially-jittering the position of irrelevant features between the targets (Morgan, Hole, & Ward, 1990b). An alternative to first-order filters is that the measurement of virtual orientations involves second-stage filters with sub-fields centred on the features being assessed (Morgan et al., 1990b). The conjecture is that many subfields are involved and that the effective position of the feature is implicitly signalled by the centroid of the resulting activity: it is this that makes second-stage filters susceptible to a wide variety of interference effects from neighbouring features that result in many of the classical illusions (Morgan, Hole, & Glennerster, 1990a; Morgan & Glennerster, 1991). There is abundant evidence for the location of spatially-distributed filters by their centroids (Westheimer & McKee, 1977; Whitaker & Walker, 1988; Morgan & Glennerster, 1991).
1.2. A model of the Poggendorff misalignment
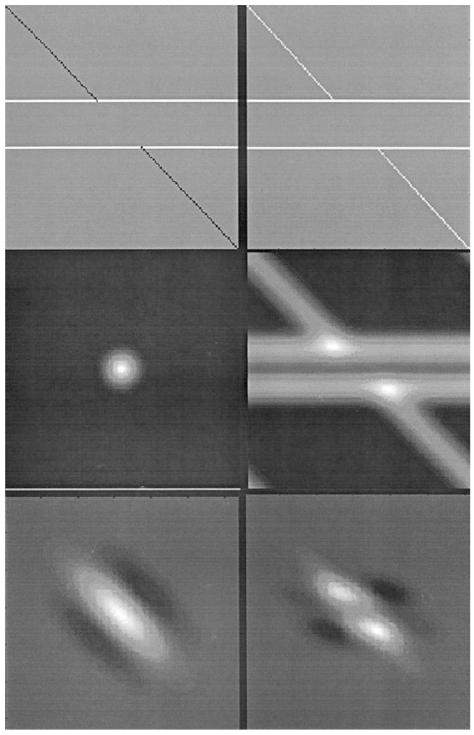
The most important stage of the model is rectification followed by coarse-scale isotropic filtering (Fig. 3: first two rows). Rectification is required because the illusion is insensitive to the relative contrast polarity of the target and inducing lines (Experiments 8 and 9). Coarse scale isotropic filtering is required to shift the maximum filter response into the acute angle of the figure (see Fig. 3). These second-stage filters or collector units are the same as those potulated to account for the accurate location of the centroids of mixed-polarty features (Morgan & Glennerster, 1991).
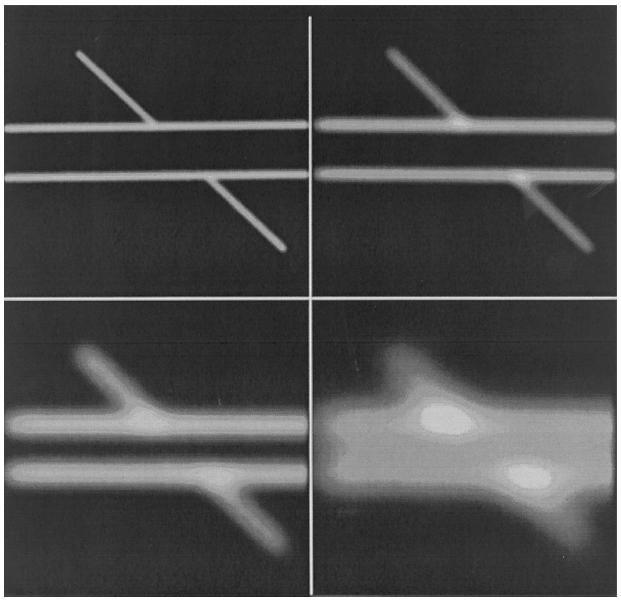
Fig. 3.
The images illustrate the stages of processing in the proposed model of the Poggendorff illusion. We begin with a version of the Poggendorff figure in which the obliques and parallels are of opposite contrast, since later experiments will show that the classical effect is still seen in this configuration. In the first stage (top row, right hand panel) the image is subjected to a pointwise rectification. In Stage II (second row of the figure) the rectified image is subjected to an isotropic Gaussian filter (filter: left, filtered figure: right). In Stage III (bottom row) the response of an oriented DoG filter in the centre of the image is measured by pointwise multiplication of the filter (left hand panel) and the output of Stage II. To obtain the response of the filter the pointwise-multiplied image (right-hand panel) is integrated. Stage III is repeated over a bank of oriented filters to obtain the filter response as a function of filter orientation. The population response is then used to compute the orientation of the virtual line in the Poggendorff figure (see Appendix A).
It would be possible to compute the virtual line in the figure by joining together the maxima in the isotropic filter response, and measuring the angle between them. This, indeed, is how the predictions in Fig. 9 are arrived at. However, it could be objected that this involves a computation for which no known neural mechanism exists. To show that the orientation of the virtual line can be computed, in principle, from oriented Gabor filters, we therefore incorporate a further stage of oriented filtering, in which an oriented filter bank is centered between the parallels, and captures the activity in the preceding filter layer. We stress that this last stage of filtering is not required to make predictions from the model: the key stage is the isotropic filtering following rectification, and the location of maxima in the filtered image.
Fig. 9.
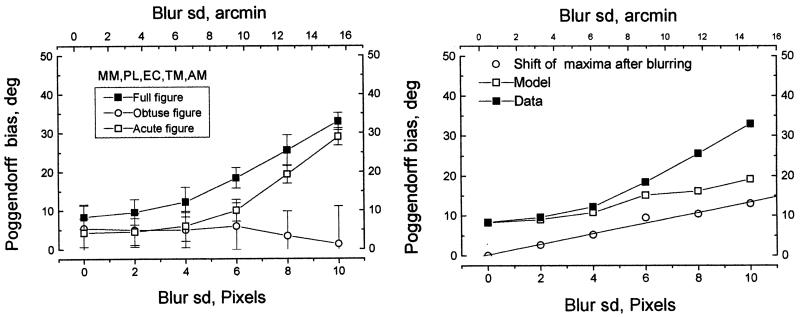
The figure shows the actual and predicted effects of blurring upon the bias in the Poggendorff effect. The angular Poggendorff bias is calculated from the linear extent of the illusion by calculating the angle of the virtual line joining the two intersections in the figure when it appears to be aligned. The difference between this calculated angle and the unbiased value of 45° is the angular measure of the Poggendorff effect. The left-hand panel shows the measured effect of low-pass (Gaussian) blur upon the full Poggendorff figure, the acute angle version and the obtuse angle version (see Fig. 1 for illustration of these figures). The horizontal axis shows the standard deviation of the Gaussian filter with which the figures were convolved; the vertical axis shows the mean measured bias in five observers. The error bars are 95% confidence intervals, based on the variance between, not within, observers. The right hand panel shows the fit to the data of the model described in the text. The lowest curve (circles) shows the shift in the angle of the virtual line joining the two maxima in the convolved image, corresponding to the area enclosed by the acute angle. The filled squares represent the data; the open squares show the predictions of the model based on intrinsic Gaussian blur of 6 arc min.
The successive processing stages in the model are illustrated in Fig. 3. In the first stage the stimulus is rectified (Fig. 3: row 1). The rectified output of the first stage is then subject to isotropic filtering (Fig. 3: row 2). The output of the second stage then passes to a bank of oriented Gabor filters, each centred in the image. The response of each of these oriented filters is obtained by pointwise multiplication of the input and the spatial point-spread function of the filter (Fig. 3: row 3 illustrates the case of a 45° oriented filter). It will be seen from Fig. 3 that the peaks in the output of the isotropic filtering stage are found near to the points of intersection of the target lines (the obliques) and the parallels, but that the peaks are slightly shifted into the acute angles. This biases the peak response of the oriented filter bank away from 45° and towards the horizontal. This bias is in the observed direction of the Poggendorff illusion. The shift in the population response as a function of the space constants of the isotropic (Stage II) and oriented (Stage IIII) filters in described in the Appendix A.
1.3. Physiological implementation of the model
We make no specific assumptions about the site of the rectifying nonlinearity. An early receptor nonlinearity could be involved (e.g. Morgan, Mather, Moulden, & Watt, 1984), or rectification could be achieved by combining the approximately half-wave rectified output of retinal ganglion cells (Watt & Morgan, 1984; Morgan & Watt, 1998). This need not be separate from the second stage which involves large, isotropic receptive fields, and which could receive input from first-stage on- and off-centre first-stage filters. The location of these large second-stage filters is unlikely to be in V1, on the basis of existing evidence. The final stage of orientation-specific filtering is simply a device for extracting information from the second stage, and may not have a direct physiological implementation. An alternative mechanism would be to extract the local sign of the local maxima revealed by Stage II in the region of the line intersections, and directly compute the angle between these maxima. However, although the term local sign is now freely used for second-stage filtering (e.g. Levi & Waugh, 1996) we have no idea how a mechanism based on local sign might work, so here we use oriented filters as an imaginary mechanism.
2. Experiment 1. Preliminary observations: magnitude of the Poggendorff bias compared to orientation acuity in the same figure
When discrimination performance is measured from psychometric functions it is possible to distinguish underlying sensitivity from bias (e.g. Morgan et al., 1990a). Consider, for example, a vernier judgement. The psychometric function plots the probability of one of the two kinds of response (say, leftwards shift) against the magnitude of the stimulus offset (which can be in either direction). Sensitivity is measured from the slope of the psychometric function, because this tells us the extent to which the observer’s decision is altered by changes in the underlying physical variable. A high sensitivity, however, does not imply a high accuracy of judgement. The observer might have bias, leading to a higher probability of one of the two kinds of response. Such a bias will move the psychometric function along the stimulus axis, and it can be measured by the point along the stimulus axis at which the probability of the two responses is equal. Illusions are special cases of biases which we believe to be sensory rather than response biases. We shall use the terms bias and illusions interchangeably in this paper.
Previous investigations of the classical geometric illusions have revealed that the illusory biases, although they may appear large in numerical terms, are seldom greater than ~2 jnd units when measured from psychometric functions (Morgan et al., 1990a). This finding indicates that that the biases are not much greater than the underlying noise in the sensory process. To see if this is also true of the Poggendorff effect the alignment bias was measured by a modified method of constant stimuli, which yielded psychometric functions from which both thresholds (jnd’s) and biases (P50 points) could be obtained.
2.1. Methods
A Poggendorff figure with horizontal parallels and traversals inclined at 26.56° to the parallels was generated by point-plotting on a Hewlett-Packard 1333A high-resolution oscilloscope under control of a Cambridge Electronic Design 502 interface and CAI Alpha computer (see Morgan, Watt, & McKee, 1983 for details). The spatial sampling interval was 2.7 arc s and the temporal frame rate 50 Hz. The screen was dark except for the figure, but was viewed in a room with normal daylight illumination.
The two parallels were each 120 arc min long and were separated by 15 arc min; the traversals were 33.5 long. Psychometric functions were obtained by an adaptive Probit estimation (Watt & Andrews, 1981) which presented a series of trials with the top traversal in a fixed position, and the lower one in a variety of positions, at each of which the observer had to decide whether it was shifted to the left or right of the position of correct alignment. Using the history of the observer’s responses, APE presented approximately equal numbers of positions to the left and right of the Point of Subjective Equality (the P50 point of the estimated Psychometric function), thus ensuring that the observer’s bias did not produce unequal numbers of responses on the left and right buttons. Each psychometric function was subjected to Probit analysis after 64 trials to determine (a) the threshold (jnd) defined as the standard deviation of the best-fitting cumulative Gaussian function and (b) the position of the traversals corresponding to the 50% point of the psychometric function.
2.2. Subjects
The observers were one psychophysically-experienced colleague (AJ) and three students at the University of Edinburgh. Three separate psychometric functions in each condition were taken from AJ and averaged; only one in each condition was taken from the students.
2.3. Results and discussion
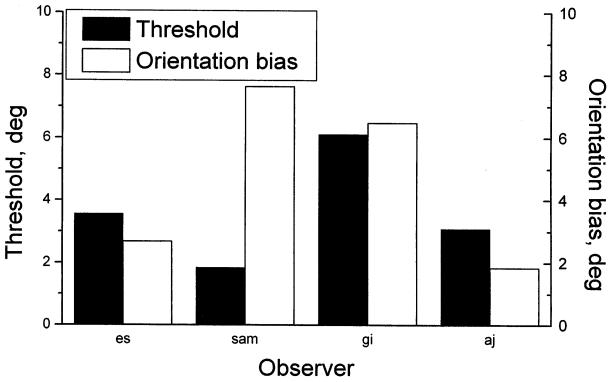
The data in Fig. 4 showed that the orientation bias in the stationary Poggendorff figure varied between 2–7° in different observers. Thresholds showed a similar variation. With the exception of one observer (SAM) the biases were less than 2× the thresholds; even in SAM the factor was less than 4×.
Fig. 4.
Results of Experiment 1, to determine the threshold (jnd) and bias in a Poggendorff figure from psychometric functions rather than the method of adjustment. The figure panel shows thresholds and biases for four observers separately, using a traditional Poggendorff figure. The units are in degrees of orientation of the virtual line joining the two intersection points in the figure, not degrees of visual angle. For further details see the text.
The conclusions from this preliminary experiment are that the Poggendorff bias is of the same order of magnitude as the jnd, as is the case with other classical geometric illusions (Morgan et al., 1990a). We now turn to experiments in which the bias was measured with the method of adjustment. The first experiment tested the virtual-angle model by allowing the observer to adjust the orientation of a comparison test Gabor patch so that it appeared to be equal to the orientation of the virtual line in a Poggendorff figure.
3. Experiments 2–10: general methods
3.1. Apparatus and stimuli
Stimuli were displayed on the 18” monitor of a Sun Sparc 10 workstation, which was viewed from a distance of approximately 0.71 m and were generated and filtered using the HIPS image processing software (Landy, Cohen, & Sperling, 1984: SharpImage Software PO Box 373 Prince St Station New York NY 10012–0007). The background luminance of the display was 9 cpd/m2 and the luminance of the white lines comprising the figure was 47.6 cpd/m2. In experiments with gratings a linear grey scale was used with a mean luminance of 28 cd/m2 Except where we state otherwise the lines comprising the figures (before filtering) were 1 pixel wide, and 1 pixel subtended approximately 1.5 arc min of visual angle. The basic Poggendorff figure used in the experiments consisted of two parallel horizontal lines 3° in length and 0.48° apart (the parallels), and two 45° oblique lines, 1.0° in length abutting against the parallels, one on top of the figure and the other below. Following standard usage in the literature, we refer to the 45° oblique lines as the traversals. In some experiments the observer adjusted the position of the lower traversal in the figure to make the two traversals appear collinear (method of adjustment). The horizontal position of the lower traversal could be altered in 1 pixel steps by the observer to make it appear parallel to the upper traversal. Several independent settings were made in each condition (usually three but sometimes five) and the average of these settings was used to determine the deviation of the observer’s point of subjective alignment from the true point of alignment. We refer to the deviation as the error or bias. On each trial the position of the lower traversal was randomised so that the observer could not know how many clicks of the mouse were needed to put the figure into true alignment. No feedback was given. In other experiments, the method of comparison was used: a separate comparison figure could be adjusted to match some feature of the Poggendorff or other test figure. For example, in Experiment 1, a comparison Gabor patch could be rotated by the observer some that its orientation appeared to match that of the virtual line joining the tips of the traversals.
3.2. Observers
Observations was carried out by the author (MM), and a mixture of paid and unpaid volunteers, with varying amounts of psychophysical experience. None of the observers other than the author knew the precise aims of the particular experiments.
4. Experiment 2: matching the orientation of the virtual line in the Poggendorff figure
Images of the Poggendorff figure and of a circular Gabor patch (σ=8 pixels [12 arc min]; f=3.75 cpd) were placed in randomly different parts of the screen for the three different observers. The orientation of the Gabor patch could be changed in 1° steps by clicking with mouse on a radio button on the screen. The angle of the virtual line joining the two obliques in the Poggendorff figure was varied between −63 and +63° from the vertical. This angle was varied by moving the horizontal position of the top oblique line. The orientation here refers to the orientation of the virtual line joining the two intersections in the figure, and this was the orientation that the observer attempted to match. There was a separate Poggendorff image for each orientation, and the observer clicked on another radio button to obtain the next, randomly chosen, orientation. A match was made to this orientation by varying the Gabor orientation, then the next Poggendorff orientation was chosen, and so on, until all the orientations had been matched.
The results are presented in Fig. 5a in terms of the difference between the observer’s settings and the correct angle of alignment. Positive errors represent observer’s settings that are too close to the vertical and negative settings represent observer’s settings that are too close to the horizontal. It will be seen from the figure that errors are asymmetrical on either side of the vertical for clockwise and anticlockwise angles. When the Poggendorff effect is in the same direction as the Zehender (right hand side of the graph), the magnitude of the error is greater than when the two effects are in opposite directions (left hand side of the graph). To factor out the true Poggendorff effect we assume that the true Zehender effect is symmetrical to either side of the vertical. Thus, if the bias at, say 20° is subtracted from the bias as −20°, the result will be zero if there is no Poggendorff effect. If the result is non-zero, we take its magnitude as representing the Poggendorff effect. The Zehender effect is then given by the difference between the total error and the calculated Poggendorff error. This calculation assumes additivity between the Poggendorff and Zehender effects, evidence for which has been provided by Hotopf and Hibberd (1989). The result of these calculations are shown in Fig. 5b. Note that the graphs in the figure are necessarily symmetrical on either side of the vertical. The figure reveals that there is a Poggendorff bias of 4–5° even when the virtual angle is vertical. The maximum effect, of about 10°, is reached when the virtual angle is 30–40°.
Fig. 5.
Results of Experiment 2 in which observers matched the orientation of the virtual line joining the two intersections in as Poggendorff figure. The matching stimulus was a circular Gabor patch containing a 3.75 c/deg grating that could be rotated by the observer in 1° steps until it appeared to match the orientation of the virtual line. The left hand panel shows the mean error made in the settings by three subjects (SB, TM, MM), where the error is defined as the shift towards the vertical orientation. The error bars represent standard deviations of the subject’s scores (note: not standard errors). The right hand panels shows these errors converted into errors in the Poggendorff direction (black lines), corrected for the Zehender bias by the method described in the text. The red lines show the Zehender bias towards the vertical.
These data shown that there is indeed a misestimation of the virtual line in the Poggendorff figure. This misestimation cannot be due to an error in extrapolating the traversals, because it occurs at all angles of the virtual line with respect to the traversal. By the same token, the effect cannot be due to a perceived shift in the orientation of the traversal (see also Experiment 4). The direction of the effect is consistent with a mechanism that draws a virtual line between two points located not at the intersection but in the vertex of the angle.
4.1. Summary and conclusions
The virtual line in the Poggendorff figure is misestimated by observers by as much as 10°. The error is in the same direction as the Poggendorff effect. The error cannot be explained by an error in extrapolating the traversals, or in coding their orientation. The results of Experiment 2 are consistent with the conjecture that at least one cause of the Poggendorff effect is the misestimation of the virtual line in the figure, and that this misestimation is caused by a mislocation of the intersection points, due to blurring in the visual system.
5. Experiment 3: introducing local bends in the traversal
If the Poggendorff effect is due to the misestimation of the location of the intersection points in the figure, and thus of the virtual line, then small local changes in the distribution of luminance around the intersection points should have an effect on the extent of the illusion. We introduced small changes in the angle of the traversal near to the intersection with the parallel using a sub-pixel interpolation method previously used to produce small vernier offsets on a coarsely-quantized display (Morgan & Aiba, 1985). The traversal consisted of two adjacent 45° lines of pixels. For most of their length the pixels were of the same luminance. In the last four pairs of pixels before the intersection with the parallel, a bend was introduced by changing their relative luminance. The sum of the luminances remained constant. The step by which one of the pixels in each pair was reduced and the other correspondingly increased, determined the angle of the bend. The maximum angular shifts thus obtained were 1.15° (towards vertical) and 1.10° (away from vertical). Observers (other than the author) were not told that these bends were in place, and indeed failed to notice them. They were simply required to adjust the position of the lower traversal to be collinear with the upper, as in the blur experiment. Measurements were taken with different amounts of bend, induced by differing amounts of luminance asymmetry.
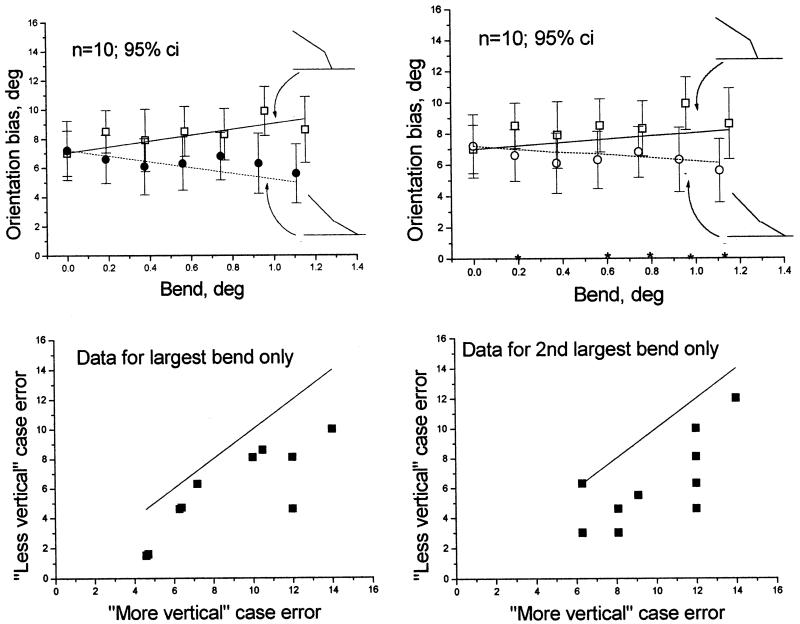
The results (Fig. 6) showed that making the angle more vertical near to the intersection increased the misalignment error, while making it less vertical decreased the error. Observers were consistent in this trend, despite large differences in their baseline biases. This can be seen from the bottom panels of Fig. 6 which compares the no-bend baseline condition with the condition where there was the maximum bend (leftmost vs. rightmost point in the left-hand panel). Because of the variance between observers in overall bias an ANOVA of all the data failed to show a significant effect. However, paired t-tests carried out separately at each level of bend showed highly significant effects. For levels of bend increasing from zero to the maximum the t values and associated probabilities were: 0.36(NS), 2.58(0.029*), 2.71(0.02*), 5.01(0.007**), 2.07(0.068), 6.14(0.0001**), 5.04(0.0007**).
Fig. 6.
Top panels: mean results of Experiment 3 in which a small bend was introduced into the last 4 pixels (6 arc min) of the traversal lines at their junction with the parallels. The bend was either in the direction expected to enhance the Poggendorff bias, (more acute, as illustrated in the upper of the two icons) or in the opposite direction(more obtuse, as illustrated in the lower icon). The solid lines show the increase in the bias expected if the observer treats the angle of the target line as being that of the final segment, rather than that of the whole line. The left- and right-hand panels show two different predictions, explained in the text. The error bars represent 95% confidence intervals. An asterisk on the horizontal axis indicates that the two points at that position differ significantly by a paired t-test with P<0.029. For details see the text. Bottom panel: individual data for the case of the largest bend. Each symbol plots the error made by a single observer in the acute-bend case (horizontal axis) against the error made by the same observer in the obtuse-bend case. The diagonal line shows the locus of points expected if the two errors are equal; most points lie under this line, indicating a smaller obtuse angle error.
The effects are small, but so too were the predicted effects (see Fig. 6). There are two different ways of making the prediction. The two-stage model for the Poggendorff task assumes that observers (a) estimate the orientation of the virtual line between the ends of the target line where they abut the parallels and (b) compare this to the orientation of the target lines themselves. The bend in the line affects the point at which it intersects the parallel and thus the orientation of the virtual line. The positional shift is twice that of the shift to the target line, since both target lines were shifted, in opposite directions. On the other hand, the predicted effect due to the change in the target line orientation alone is equal to the angle of the bend. The two predictions thus arrive at slopes differing by a factor or two (left and right hand panels of Fig. 10). The data do not permit a decision between the two predictions. Thus we are unable to decide whether the bend affected the bias because it changed the angle of the target line, or its position, or both.
Fig. 10.
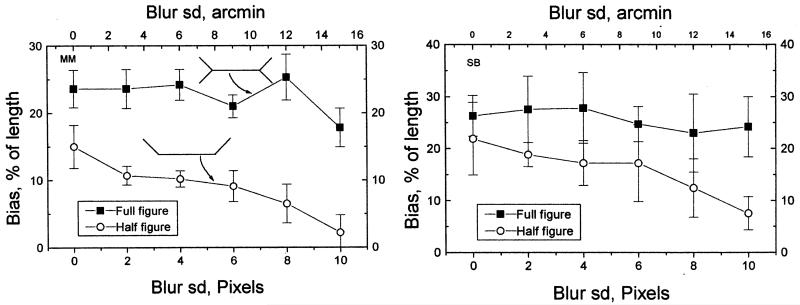
Effects of blur on the perceived extent of the outgoing-fins version of the Muller–Lyer figure (full figure: squares) and the half-figure (circles) in which the fins were present on one side of the line only. The icons in the left-hand panel illustrate these two configurations. The two panels are for different subjects (SB and MM). The data are means over three independent settings; error bars are standard deviations of these settings. Both subjects show a decrease in the bias in the half-figure as the extent of blur increases. The behaviour is similar to that of the obtuse-angle Poggendorff figure.
The very local effect revealed by the present experiment recalls a report by Horrell, a demonstration version of which is shown below in Fig. 7, showing that the Poggendorff effect is reduced if the local intersection angle is made normal. The demonstration in Fig. 7 may be viewed at increasing viewing distances to show that the Poggendorff effect is reduced or absent even when the concavity in the parallels subtends only a few arc min.
Fig. 7.
A version of the Poggendorff figure due to Horrell, showing that the bias is reduced or even abolished if the local angle of intersection is made into a right angle. The reader can experiment with viewing distance to determine the visual angle of the notch at which the bias is recovered.
The next experiment shows that blur increases the extent of the Poggendorff effect when the blur exceeds the intrinsic blur of the putative second-stage filtering process. Blur does not increase the obtuse-angle version of the Poggendorff, but neither does it increase the Muller–Lyer illusion (Experiment 5), on which the obtuse-angle effect is plausibly based.
6. Experiment 4: the effects of Gaussian blur on the Poggendorff figure
Glass (1970) asserted that a modification of the Poggendorff illusion is increased by optical blur, but he presented no data, and the version of the illusion he presented had a continuous line crossing the parallels, which is more akin to the H crossbar illusion (Judd, 1899; Morgan, Medford, & Newsome, 1995) than to the classical Poggendorff. We wanted to know whether blur also increased the acute and obtuse-angle amputated versions. Gaussian blur of 0, 2, 4 8 and 10 pixels was used. Photographic examples are shown in Fig. 8. Results from five observers are illustrated in Fig. 9a. Blur increases the orientation bias in the full Poggendorff figure, and in the acute angle version, but in the obtuse angle version increasing blur causes the orientation bias to decline. This is evidence that the obtuse angle bias has a different cause from the Poggendorff effect.
Fig. 8.
The photographs show the basic Poggendorff figure used in the Experiments with varying degrees of Gaussian blur. The separation between the parallels was 20 pixels and the space constant (σ) of the isotropic Gaussian filter was (reading left to right and up to down) 2, 4, 8 and 10 pixels.
Small amounts of blur had no effect upon any of the biases, and this is evidence for intrinsic blur in the system (Pointer & Watt, 1987; Levi & Klein, 1990; Morgan, 1992; Paakkonen & Morgan, 1992). To model the effects of blur, the positions of the local luminance maxima corresponding to the line intersections following filtering were measured. These move progressively into the acute angle as blur increases. The resulting angular shift is shown by the open circles in Fig. 9b. From the function relating angular shift to blur, we can compute that an intrinsic blur of ~6 pixels (9 arc min) is required to produce the observed angular bias when the extrinsic blur is zero. We now model the data by assuming that the total effective blur is given by the expression:
| (1) |
and the extent of the angular bias computed from this relationship and the simulated effects of Gaussian blur is given in the model curve of Fig. 9b. This model adequately fits the flat part of the data curve, but the subsequent rise in the real observers’ bias was considerably more rapid than that predicted by the Model. We conclude that the blur must have an effect over and above its effect upon the apparent position of the line intersections. A clue to the nature of this additional effect is given by inspection of the blurred figures (Fig. 8). At large blurs, not only is the peak corresponding to the intersection shifted, but also the angle of the traversal lines themselves, which are shifted towards the vertical. Thus a possible cause contributing to the Poggendorff effect may be a local change in the orientation of the transversals near to the intersection with the parallels: an effect some have reported seeing even in the unfiltered Poggendorff figure (Hotopf & Hibberd, 1989). Evidence that misestimation of the virtual line cannot be the only cause of the Poggendorff effect is that at 45° this effect is quite small: only 2.7°, compared to a magnitude of 8.35° in the identical, unfiltered figure in Experiment 3.
In later experiments we shall attempt to measure the extent of the local orientation effect directly. For the moment, however, we conclude that there are two effects of intrinsic blur that are candidates for causes of the Poggendorff effect: a shift in the internally-computed position of acute-angle line intersections, and a shift in the apparent orientation of the traversal line near to the parallel.
6.1. Summary and conclusion
The classical Poggendorff comprises at least three effects, one of which depends on the presence of the acute angle in the figure, and which is increased by blur; a second effect, which depends on the obtuse angle and which is decreased by blur; and a third which is a shift of the perceived angle of the traversal line away from that of the parallels. The acute-angle effect may be partially explained by a shift in the position of the vertex of an acute angle caused by intrinsic blur: this effect is increased by extrinsic blur. This factor cannot be the only cause of the Poggendorff effect, because it is too small at 45° to account for the magnitude of the error. A shift of the perceived angle of the traversal line away from that of the parallels may account for the discrepancy. There is no evidence so far that this last effect operates in the absence of extrinsic blur, but this possibility will be investigated in Experiments 4 and 5. The cause of the obtuse-angle Poggendorff effect may be the same as that of the Muller–Lyer illusion, and this possibility is tested in the following experiment (Experiment 3).
7. Experiment 5: what is the explanation of the obtuse-angle effect?
We take the fact that blur has opposite effects upon the obtuse- and acute-angle figures a priori evidence that the obtuse angle effect and the Poggendorff/acute angle effects have a different cause. If this is indeed the case, it has been a mistake in the past to dismiss blurring explanations of the Poggendorff effect on the grounds that they cannot account for the obtuse angle effect. But we must beware falling into the same trap and concluding that the obtuse angle effect has nothing to do with the ordinary Poggendorff. The Poggendorff effect sensu strictu may combine a blur-dependent effect of the acute angle and a blur-resistant effect of the obtuse angle. The fact that neither the obtuse nor the acute effects are individually as large as the Poggendorff effect may be taken as evidence for multiple causes.
To understand the possible cause of the obtuse angle effect, it may again be helpful to undertake a computational analysis and ask how the obtuse angle alignment task might be performed by the visual system. If the mechanism involves the computation of a virtual line between the vertices of the two angles, then the vertices must first be located. This is not as simple as the case of locating the vertex of an acute angle, because there is no corresponding local maximum in the output of first-stage, circularly symmetrical filters (see Fig. 8). A possible strategy would be to locate the end-points of the component lines by second-stage end-stopped filters. These, however will be biased in the direction of elongating the line, because of the presence of the second, outgoing, line at the intersection. This explanation is similar to one previously advanced for the Muller–Lyer illusion of length (Morgan et al., 1990a). In other words, we propose that the obtuse-angle effect is a truncated version of the Muller–Lyer illusion, with each of the parallels serving as the stem of the Muller–Lyer figure, and each of the traversals serving as one half of the outgoing arrowhead. Two predictions follow, of which the second is not at all intuitive: (a) there should be a Muller–Lyer effect if the outgoing fins are on one side of the stem only; and (b) the extent of this effect should be reduced by Gaussian blur.
These predictions were tested by the method of comparison, using a horizontal line that the observer could adjust in length to equal the apparent extent of the horizontal stem line in an outgoing-fin Muller–Lyer figure and its truncated equivalent. Two different real sizes of the stem (128 and 120 pixels) and different degrees of blur in the test figure were randomly interleaved over trials. Each observer made three independent adjustments. The results are shown in Fig. 10
The results confirm both predictions. There is a bias in the truncated figure, and this bias decreases with increasing blur. The bias is greater in the original untruncated Muller–Lyer figure, and this bias does not decrease with blur. We therefore have evidence that the Muller–Lyer effect itself depends on more than one mechanism, one of which depends on the presence of an acute angle in the figure, and another which depends on the obtuse angle. The acute angle effect may increase with blur, as does the Poggendorff acute angle effect, and this increase may compensate for the decrease in the obtuse angle effect, thus explaining the overall insensitivity of the Muller–Lyer illusion to blur. The acute angle effect may depend on displacement of the centroid into the acute angle, as proposed by Rogers and Glennerster (1993), who model their data with a filter having a space-constant of the order of one tenth of the shaft length. Since this is larger than any of the blurs used in our experiment, our data cannot be used to test their model. The obtuse-angle effect is not explained in any obvious manner by the Glennerseter and Rogers model, or by any existing theory of which we aware.
7.1. Summary and conclusion
The classical Poggendorff comprises at least three effects, one of which depends on the presence of the acute angle in the figure, and which is increased by blur, and a second effect, which depends on the obtuse angle and which is decreased by blur. The acute-angle effect may be partially explained by a shift in the position of the vertex of an acute angle caused by intrinsic blur: this effect is increased by extrinsic blur. The cause of the obtuse-angle Poggendorff effect may be the same as that of the Muller–Lyer illusion, and this possibility has been supported by showing that the length illusion in an obtuse-only Muller–Lyer figure is decreased by blur, just like the obtuse Poggendorff effect. A third possible cause of the Poggendorff effect appears with larger extrinsic blurs: a shift of the perceived angle of the traversal line away from that of the parallels (see Fig. 8). There is no evidence so far that this effect operates in the absence of extrinsic blur, but this possibility will be investigated in the following experiments (4 and 5).
8. Experiment 6: is the angle of the traversal misperceived?
Observers set the apparent orientation of a probe to the apparent orientation of the upper traversal in the full Poggendorff figure (Experiment 6a). The orientation of the traversal was varied between 0° (vertical) and 50°. The probe in this case was a pair of dots 10 pixels apart, with a variable angle between them under the observer’s control. In a separate experiment, the orientation of the traversal was kept constant at 45° and its length was varied (Experiment 6b) and the observer once again matched the probe to the perceived orientation of the target line. In addition, with the probe absent, the Poggendorff effect itself was measured, as in previous experiments, by moving the top traversal line until it appeared collinear with the lower traversal.
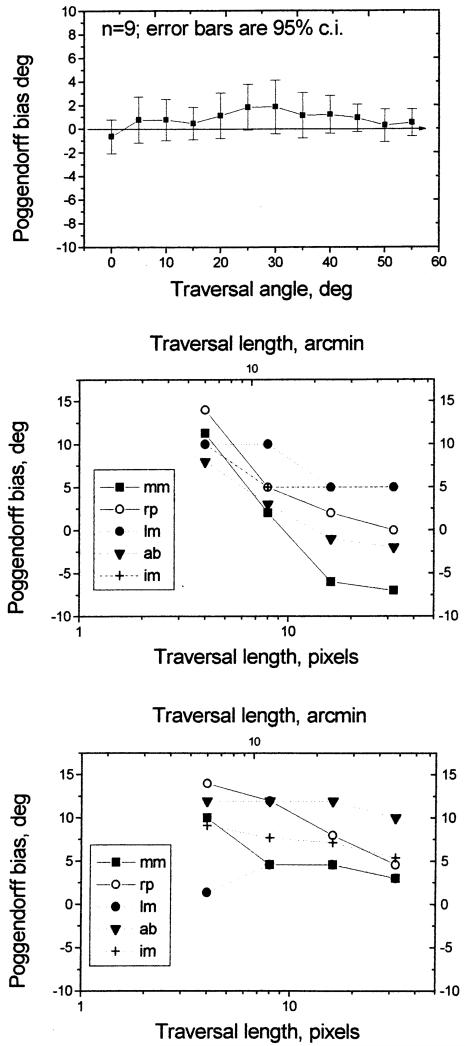
The results are shown in Fig. 11. There was a small error in Experiment 6a, reaching a maximum of only 1° at a traversal angle of 30°. It is unclear whether this was due to a shift in the perceived angle of the traversal, or to the Zehender effect. In retrospect, it was not a good idea to use a virtual angle (two dots) as the probe, because this could have produced a Zehender effect, which in this case would have been in the same direction as the expected shift of the traversal (i.e. towards the vertical). However, the Zehender effect would have if anything reduced the predicted orientation shift in the traversal, so we can infer without difficulty that the predicted orientation shift was, at best, very small. It cannot explain the Poggendorff effect of about 10° (previous experiments).
Fig. 11.
The top panel shows the results of Experiment 5a in which observers adjusted the angle of a two-dot probe (vertical axis) to match the perceived angle of the upper traversal line in a Poggendorff figure, as its angle to the parallel lines of the figure was varied (horizontal axis). The error bars show 95% confidence intervals. There is a tendency to perceive the target line as more nearly vertical than it is, but the effect is smaller than the Poggendorff effect measured in the other experiments. The bottom two panels show the effects of varying the length of the target line upon (middle panel) its perceived orientation and (bottom panel) the magnitude of the Poggendorff bias. Shorter target lines are seen as more shifted towards the vertical than longer ones, but this has little effect upon the Poggendorff bias
In the second and third parts of the experiment (Fig. 11b, c) the length of the traversal was varied. When the apparent orientation of the traversal was measured with the probe, long traversals showed no systematic orientation shift, in agreement with Experiment 4a, but short traversals were shifted towards the vertical by as much as 10°. The effect of traversal length was statistically significant (F[3, 16]=7.42; P= 0.02). However, when the Poggendorff bias itself was measured by moving the upper traversal, there was no significant effect of probe length (F[3, 16]=1.1; P. 0.37).
The change in the apparent orientation of short, abutting lines is in agreement with the orthogonal orientation shift (the OOS) previously reported by Morgan et al. (1995) for short line abutting segments. The OOS can be explained by blurring (see Fig. 8), or alternatively, by cross-orientation inhibition, a possibility to which we shall return in Experiment 7. The OSS could be a component of the Poggendorff effect if the observer extrapolates the traversals using orientation information only from near to their intersections with the parallels. However, at this stage, any connection between the Poggendorff effect and the OSS is purely speculative. The OSS cannot explain the misestimation of the virtual line, revealed directly by Experiment 2.
8.1. Summary and conclusion
The traversals are not globally shifted in orientation, but they are shifted locally near to the intersections. We have now identified three possible mechanisms for the Poggendorff, even when the Zehender effect is excluded. One is the misestimation of the virtual angle in the figure, which depends upon the acute angle intersection. The second is the Muller–Lyer effect associated with the obtuse angle. The third is the very local orthogonal orientation shift associated with short line segments. The last effect cannot explain the errors in the virtual line matching task.
A physiological model frequently advanced to explain the Poggendorff effect is cross-orientation inhibition (Blakemore, Carpenter, & Georgeson, 1970; Blakemore & Tobin, 1972). The idea is that the distribution of activity across a population of orientation-tuned detectors is shifted by the presence nearby of another line. If this inhibition is a property of first-order filters, it should be abolished in stimuli where the lines are defined not by luminance but by contrast. This prediction was tested in the next two experiments.
9. Experiment 8: the Poggendorff effect with contrast defined lines: I
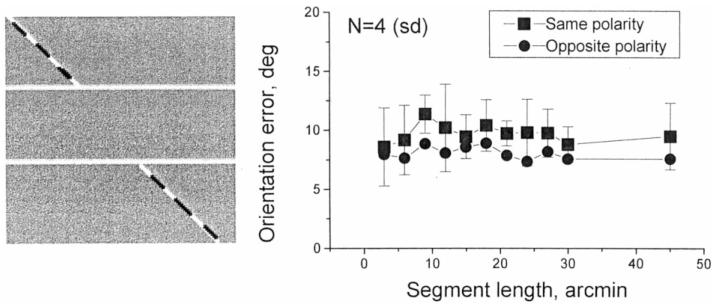
The standard Poggendorff stimulus used in Experiment 2 was modified by composing the traversal lines in the figure with alternating black and white line segments, the mean luminance of which was equal to that of the grey background. The segment length was systematically varied, on the assumption that at a sufficiently small length, the line should be invisible to first-order orientationally-selective filters. The luminance balance was verified by observing that at the smallest segment length, the stimulus became invisible at viewing distances greater than those used when making the colinearity settings. Two classes of stimulus were investigated. In the same-polarity case the proximal segment of the traversal had the same contrast polarity as the segment of the parallel against which it abutted; in the opposite polarity case the contrast of the two segments was different, i.e. one white and the other black.
The result (Fig. 12) was that segment length had no significant effect on the magnitude of the orientation error. The error was as large with the smallest segment size (3 min) as with the largest (45 arc min). There was a slight effect of relative contrast polarity of abutting segments, but the orientation error was large even with opposite polarities. These data are strong evidence against the involvement of cross-orientational inhibition acting at the level of first-order filters.
Fig. 12.
Results of Experiment 7 in which the lines composing the obliques of the Poggendorff figure were composed of alternating white and black segments with the same mean luminance as the background. The abutting segments of the parallels and the traversals were either of the same (square symbols) or opposite (circle symbols) polarity. In the case illustrated in the panel on the right the abutting segments are of the same contrast. The segment length was varied (horizontal axis). The error bars show the standard deviation of the mean scores of four observers.
9.1. Summary and conclusions
The orthogonal orientation shift, suggested as one factor in the Poggendorff effect, is very unlikely to depend upon cross-orientational inhibition in first-order filters. Nor can the error in estimating the virtual line depend on properties of first-order orientationally-tuned filters.
In the next experiment we carry this conclusion one stage further, and deliberately engineer a stimulus in which first- and second-order filters would produce opposite directions of alignment effect.
10. Experiment 9: the Poggendorff effect with gratings replacing the parallels
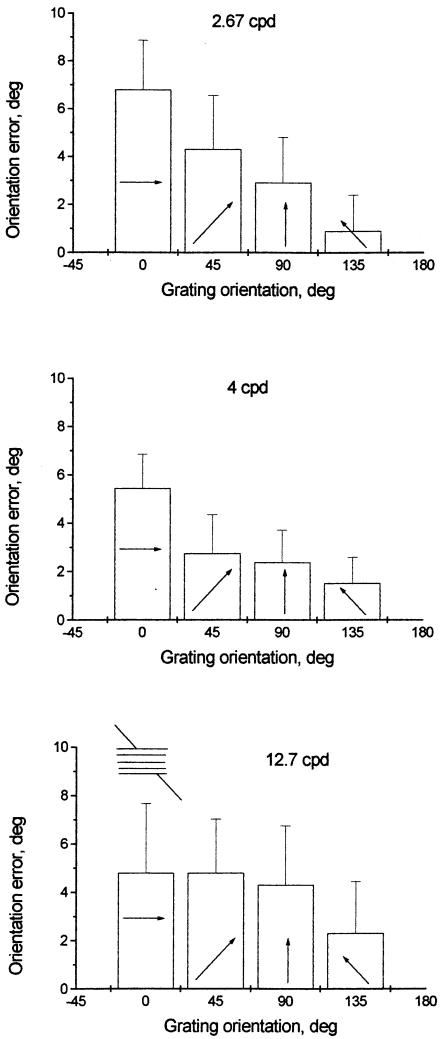
The parallel lines of the Poggendorff figure were removed and replaced by strips of grating which had the same mean luminance as the background (35 cpd/m 2). The orientation of the grating was either horizontal (0°), 45, 90 or 135°. The orientation of the traversals was 135°. Observers adjusted the position of the upper traversal to make it appear collinear with the lower. In the first experiment, the spatial frequency of the grating was 4 cpd and the contrast was 30%. Ten subjects were tested. In a semi-replication carried out 2 years later, two different spatial frequencies were used (2.67 and 12.7 cpd) at 19.7% contrast. Nine observers were used, each making two independent observations.
The results in Fig. 13 show that the orientation error was at its greatest when the grating was horizontal. This is unsurprising since effectively here the traversal abuts against a horizontal bar, either black or white, just as in the normal figure. The error was reduced when the grating was 45 or 90° and was further reduced when it was 135°.
Fig. 13.
Results of Experiment 8, which the parallels of the classical Poggendorff figure were replaced by gratings at four different angles, with the traversal always at 135°. The icon show the case of a horizontally orientated grating. The arrows inside the data bars represent the grating orientation. The three panels show results at three different spatial frequencies (2.67, 4 and 12.7 cpd). The data show means over nine observers and the error bars show 95% confidence intervals.
A possible artefact in the 135° case should be noted: the grating was parallel to the traversals and collinearity could be estimated by aligning the two parallels with the same half-cycle of grating. Several observers reported doing this. The 135° condition was therefore removed from a statistical analysis of the data. An ANOVA showed that the effect of grating angle (0, 45, 90°) was significant in the low frequency case (F[2, 24]=5.17, P=0.0135) but not with the high frequency grating (F[2, 24]=0.097). When the low (2.56 cpd) and high (12.7 cpd) spatial frequency data were analysed together the effect of angle just failed to reach the 5% level of significance (F[2, 48]=2.87, P=0.067). Neither the Main effect of spatial frequency nor the interaction term approached significance. Cross-orientational inhibition in first-order filters would predict a reversal of the Poggendorff effect when the grating is 90°. The vertical orientation of the grating would push the orientation of the traversal towards the horizontal rather than the vertical. No effect should have been observed with the 45° grating, since it is orthogonal to the traversal. Cross-orientational inhibition fails to explain the orientation bias still found with these stimuli.
It may be argued that the spatial frequency of the grating was too low to remove first-order boundaries at the local intersections. However, it will be seen from Fig. 13 that at the highest spatial frequency used (~12 cpd) the effect of grating angle was smaller than at the lower frequencies. There was indeed no significant effect of grating angle, except at 135°.
After carrying out these experiments, we found that a similar study had been performed by Masini, Skiaky and Pascarella (1992) using parallel-line textures between the parallels, instead of gratings. They also used angles of 0, 45, 90 and 135°. Since the textures were not luminance balanced with respect to the background, the operation of first-order filters could not be excluded. Nevertheless, Masini et al. found the same rank ordering of the texture angles with respect to the Poggendorff bias as that reported here. They use their data to support a theory of the Poggendorff effect by Day and Kasperczyk (1985) who observed that the short line (which may be replaced by a dot) in the configuration shown in Fig. 1d did not appear to observers to bisect the line between the two lower dots. Why this is held to be relevant to the Poggendorff effect is not clear. An obvious explanation is that the vernier offset between the top dot and the bottom left hand dot is in fact really smaller than that between the top dot and the bottom right hand dot; when asked to bisect the lower dots observers may well bisect the angle rather than the line. In general, there is no guarantee that when observers are given verbal instructions that they will translate them into the kind of metrical decision desired by the experimenter, as Day et al. themselves point out.
10.1. Summary and conclusion
An alignment bias is found in a Poggendorff figure containing second-order parallels only, defined by grating boundaries. The orientation of the grating affects the extent of the alignment bias. The largest effect is seen with a horizontal grating, which in effect contains a first-order boundary at 45° to the traversal. The smallest effect is seen with a 135° grating, oriented at 0° with respect to the traversal: observers can use the grating in this figure as a guide to collinearity. Intermediate effects were found with 45 and 90° gratings. The reversed Poggendorff effect predicted by cross-orientational inhibition with a 90° grating was not found. The evidence is consistent with the possibility that all the gratings except for the horizontal abolished the orthogonal orientation shift (OOS) of the traversal: the remaining effect could well be the virtual line misalignment error. Thus we conclude from this and the previous experiment that the OOS is caused by second-stage filtering, but not by cross-orientational inhibition either of the first or second order.
Finally, we turn to the effect of stereo disparities upon the Poggendorff bias.
11. Experiment 10: the effect of stereoscopic disparities on the Poggendorff effect
So far, we have considered only effects in two-dimensions. However, Gillam (1971) has proposed a depth processing account of the Poggendorff effect, according to which the bias is due to a faulty interpretation of perspective cues in the figure. This theory is called into question by the fact that the Poggendorff effect is still present in a real 3-D scene where the traversals consist of a single rod, is occluded by a nearer opaque screen (Morgan, 1996). However, others have reported that the extent of the effect is indeed modulated by depth information (Sakaguchi, Idesawa, & Yamatsuka, 1995). We therefore decided to measure the Poggendorff effect in a dichoptic display where the traversals could be imaged either in front of or behind the (horizontal) parallels.
The prediction that the bias will be reduced by disparity is not necessarily unique to the perspective theory. If second-stage filters responding to virtual lines are themselves disparity tuned, they may be less subject to biases from interfering lines in a different depth plane from the target lines. Harris and Morgan (1993) reported such an effect in a dot-localisation task. If observers attempt to estimate the distance between two green dots, each embedded in a cluster of red dots, they are biased towards reporting the distance between the centroids of the clusters, rather than between the target (red) dots. However, if the target dots are imaged stereoscopically in a different depth plane from the rest of the cluster, decisions become more veridical. It is difficult to apply the perspective theory to this experimental finding.
11.1. Methods
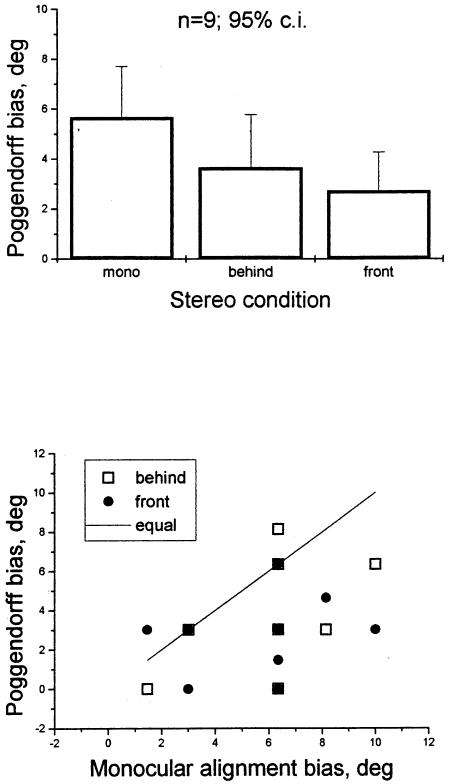
The basic Poggendorff figure was identical to that used in Experiment 5a, with short (4 pixels, 6 arc min) alternating black–white segments making up the parallel lines. The reason for this was to provide structure to aid fusion. Each eye was presented with a separate figure, the two being fused with the help of an antique Brewster stereoscope placed 14 cm in front of the screen. Because of the nearer viewing distance and the magnification by the lenses, the visual angles subtended by the figure were considerably greater than that in the other experiments. The figures in the two eyes were identical except that the horizontal position of the traversals in the right eye could be shifted relative to those in the left to give a crossed or uncrossed disparity of 10 arc min. In addition, the position of the upper traversal in both figures could be moved in synchrony by the observer to make it align with the lower traversal. This movement did not affect the disparity. In addition, a monocular control was run in which the observer placed an eye-patch over one eye. Nine subjects took part in the Experiment.
11.2. Results
Errors were smaller on average in the dichoptic conditions than in the monocular control (Fig. 14 left hand panel). Because of the large inter-subject variability revealed in Fig. 14 an overall one-factor ANOVA just failed to reach significance (F[2, 24]=3.09; P=0.06). A paired t-test, comparing the behind and the monocular conditions also failed to reach significance (t=2.23; P=.056) but the same test comparing the front and monocular conditions did reach a conventional level of significance (t=2.98; P=0.017). The difference between the behind and front conditions’ was not significant (t=1; t=0.33). The finding that the Poggendorff bias is least in the front condition agrees with Sakaguchi et al. (1995), but not with their report that the effect vanishes almost completely.
Fig. 14.
Results of Experiment 9, in which the Poggendorff figure was presented dichoptically to give a stereo effect. The traversal was given a disparity to make it appear either behind or in front of the horizontal traversals. In the control (mono) condition the observer used one eye only. The top panel shows the means and 95% confidence limits. The bottom panel shows the individual data with each individuals error in the dichoptic condition (vertical axis) plotted as a function of the error of the same individual in the monocular condition (horizontal axis). Squares show errors in the behind-dichoptic condition and circles in the front-dichoptic condition. The diagonal line shows the locus of points expected if the dichoptic and monocular errors are equal; most points lie under this line, indicating a smaller dichoptic error.
The large individual variability makes it impossible to be certain, but the data do provide some support for the conjecture that the conventional 2-D Poggendorff bias is reduced by using disparity to present the target and inducing lines in different depth planes. The results can be taken either as support for the perspective theory (Gillam, 1977), or to indicate that second-stage filters involved in virtual angle perception are disparity tuned (Harris & Morgan, 1993). However, the fact that the bias is present at all in figures with a clear depth separation, as indeed it is in real-world scenes with trees and branches, is difficult to explain by the perspective theory alone.
12. General discussion
The Poggendorff is a vernier alignment task. We cannot understand the Poggendorff bias without understanding the mechanisms for alignment decisions in general. Recent work on the vernier alignment of separated features has shown that second-stage filters rather than first-stage luminance-based filters are involved. These filters have large receptive fields, over which they integrate the output of first-stage filters. Such filters are excellent at encoding the centroids of spatially-distributed features, but systematic biases result when the experimenter arbitrarily designates some of the features falling within the receptive field as irrelevant to the task (Morgan, 1996)
Two target lines of the same orientation are collinear in the Euclidean metric when the virtual line joining their ends has the same orientation as the target lines. We propose, therefore, that the Poggendorff alignment task is carried out as a two stage process: (1) the first process estimates the origin of the virtual line (2) the second process compares the orientation of the virtual line to the orientation of the target lines. Biases could arise from errors at either or both stages. We have obtained direct evidence that the virtual line is misestimated in a task in which observers match its perceived orientation to that of a Gabor patch. The direction of the error suggests that observers draw the virtual line not between the two line intersections, but between blobs included inside the acute angle formed between the target and the parallels (see Fig. 2).
As an alternative to the two-stage model, we have considered a single-stage model in which the observer aligns the free ends of the two traversals, and the two spatial points of intersection computed after blurring (in other words, the points a, i, j, d in Fig. 2). This has the advantage of predicting an increase in the bias with blur more comparable to the data. However, the one-stage alignment model predicts that shorter traversals will give rise to larger Poggendorff biases, and we have seen (Fig. 11) that this is not the case. We have therefore preferred the two-stage model. However, it is worth bearing in mind that different observers may use different strategies in performing a complex task like the Poggendorff, and the single-stage model may be a better account for some observers.
Another possible cause of the Poggendorff bias arises in estimating the orientation of the target lines at the point where they abut the parallel. There is at best only a small error in estimating the orientation of the whole target line in the classical figure, but there is an increasing error as the lines are made smaller, recalling previous reports (Morgan et al., 1995). Placing an artificial bend in the line near to the abutment point had the expected effect of increasing the Poggendorff bias when it was towards the orthogonal, but had a much weaker effect in decreasing the bias when it was away from the orthogonal.
None of these biases can be explained by blurring in first-stage filters, because the Poggendorff bias is still found with contrast-defined lines, and with parallels defined by patches of grating. The orientation of the grating patch in the latter case has some effect, arguing for a possible contribution of first-order filters; but the expected reversal of the bias when the grating was at an angle of 45° with respect to the target lines did not materialise. The last finding poses a difficulty for the cross-orientational inhibition theory of the Poggendorff effect, unless the inhibition happens at the second-stage filter level.
The Poggendorff effect is weakened by placing the target and inducing lines in different disparity-defined planes, but is not abolished. This finding recalls the observation that observers are more able to extract positional information from single dots within dot clusters when they have a different disparity (Harris & Morgan, 1993). Unlike the dot cluster case, however, relative movement of the target and inducing lines does not reduce the Poggendorff bias (Experiment 1).
We suggest that the Poggendorff bias is explained by spatial blurring in second stage filters. Optical blur enhances the Poggendorff effect, and its acute angle-only version, when it exceeds the intrinsic blur, which we estimate as Gaussian with a standard deviation of about 6 arc min, far greater than the resolution limit for human vision. A problem is that blur decreases rather than increases the obtuse angle-only version of the effect. However, we suggest that this effect is not the Poggendorff at all, but depends on a different mechanism akin to the Muller–Lyer. We show that the relevant version of the Muller–Lyer illusion is also decreased by Gaussian blur. In general, susceptibility to blur turns out to be a useful device for the complex task of dissecting the classical illusions into their components.
Acknowledgements
This work was begun in the Centre for Neuroscience at the University of Edinburgh, and I thank John Kelly and Richard Morris for their support while I was there. The work was supported by grants from the Biological and Biotechnology Science Research Council (BBSRC), the Medical Research Council (MRC), the BIOMED 2 Programme of the European Community and a Network Grant from the European Community. I thank Andrew Glennerster for his critical comments.
Appendix A
In a simulation of the model, a Poggendorff figure with horizontal parallels (parallel gap=24) and a 45° traversal line was convolved with a circularly symmetrical Gaussian filter with the point-spread function:
| (A1) |
The resulting image was multiplied by a Gabor patch oriented at an angle θ and the response calculated as the integral over the whole image of dimensions w x h:
| (A2) |
where h(x, y) is the Gaussian envelope with orientation θ:
| (A3) |
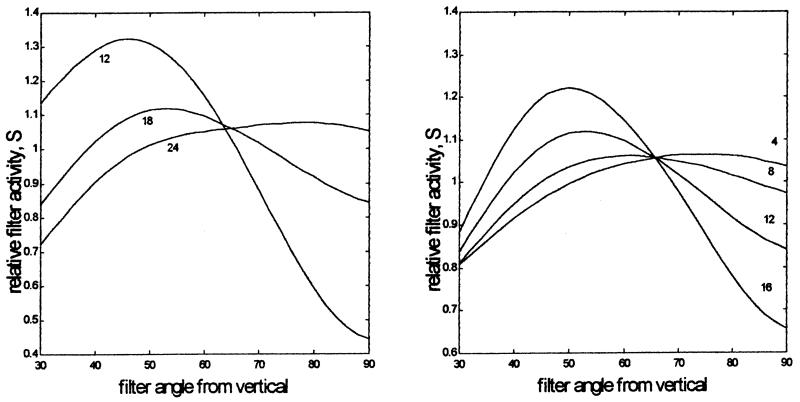
with aspect ratio (σy/σx)=1.5 and a spatial frequency of 48/σ(x).The phase was even. The Gabor patch was centred in the middle of the image in the centre of the imaginary traversal joining the two target lines. The orientation of the Gabor patch was varied. S (see Eq. (A2)) was calculated for each orientation of the Gabor patch. In the first simulation (left hand panel) σx of the isotropic Gaussian filter was eight and the size of the oriented Gabor envelope was varied. In the second simulation, σx of the isotropic Gaussian filter was varied with σx of the oriented Gabor held constant at 18. The results are shown in Fig. 15: (note: each curve is scaled by its mean value; the parameter on the curves is σx of the Gabor envelope).
Fig. 15.
The two panels show the results of simulations of the Poggendorff bias described in Fig. 3 and in the Appendix. The quantity computed (vertical axis) is the response of each of a set of oriented Gabor filters (orientation on the horizontal axis) placed with their centre mid-way along the virtual line joining the two traversals of the Poggendorff figure (see Fig. 3). Since the true angle of the traversals and of the virtual line is 45°, the maximum response would be expected in a filter oriented at 45°. However, the distribution is distorted by a prior stage of isotropic filtering (see Fig. 3). In the first simulation (left hand panel) σx of the isotropic Gaussian filter was eight pixels and the size of the oriented Gabor envelope was varied. In the second simulation, (right hand panel) σx of the isotropic Gaussian filter was varied with σx of the oriented Gabor held constant at 18 pixels. The gap between the parallels was 24 pixels.
The simulations show that the peak filter response is moved away from 45° in the direction of the horizontal. This is the direction of the Poggendorff bias. If the observer computes the orientation of the virtual line between the junctions of the target lines with the parallels as being more horizontal than the angle of the target lines themselves, then she will have to move the top line rightwards. The magnitude of the bias increases with the size of both the isotropic Gaussian filter and the oriented Gabor. Biases reach as much as 20° with the largest filters, which is far greater than the bias actually observed in the Poggendorff effect.
References
- Blakemore C, Carpenter RHS, Georgeson MA. Lateral inhibition between orientation detectors in the human visual system. Nature. 1970;228:37–39. doi: 10.1038/228037a0. [DOI] [PubMed] [Google Scholar]
- Blakemore C, Tobin EA. Lateral inhibition between orientation detectors in the cat’s visual cortex. Experimental Brain Research. 1972;15:439–440. doi: 10.1007/BF00234129. [DOI] [PubMed] [Google Scholar]
- Burbeck CA. Position and spatial frequency in large-scale localization judgments. Vision Research. 1987;27:417–427. doi: 10.1016/0042-6989(87)90090-3. [DOI] [PubMed] [Google Scholar]
- Coren S. Lateral inhibition and geometric illusions. Quarterly Journal of Experimental Psychology. 1970;22:274–278. doi: 10.1080/00335557043000212. [DOI] [PubMed] [Google Scholar]
- Coren S, Girgus JS. Seeing is deceiving: the psychology of visual illusions. Lawrence Earlbaum; Hillsdale: 1978. [Google Scholar]
- Day R, Kasperczyk RT. Apparent displacement of lines and dots in a parallel-line figure: a clue of the basis of the Poggendorff effect. Perception and Psychophysics. 1985;38:74–80. doi: 10.3758/bf03202927. [DOI] [PubMed] [Google Scholar]
- Day RH, Dickinson RG. Relative magnitude of apparent misalignment in acute-angle and oblique-angle line figures. Perception and Psychophysics. 1979;25:244–246. doi: 10.3758/bf03202996. [DOI] [PubMed] [Google Scholar]
- Farne M. On the Poggendorff Illusion: a note to Cumming’s critisism of Chung Chian’s theory. Perception and Psychophysics. 1970;8:112. [Google Scholar]
- Gillam B. A depth processing theory of the Poggendorff illusion. Perception and Psychophysics. 1971;10:211–216. [Google Scholar]
- Glass L. Effects of blurring on perception of a simple geometric pattern. Nature. 1970;228:1341–1342. doi: 10.1038/2281341a0. [DOI] [PubMed] [Google Scholar]
- Harris J, Morgan MJ. Stereo and motion disparities interfere with positional averaging. Vision Research. 1993;33:309–313. doi: 10.1016/0042-6989(93)90087-d. [DOI] [PubMed] [Google Scholar]
- Hotopf WHN, Hibberd MC. The role of angles in inducing misalignment in the Poggendorf figure. Quarterly Journal of Experimental Psychology. 1989;41a:355–383. doi: 10.1080/14640748908402370. [DOI] [PubMed] [Google Scholar]
- Judd CH. A study of geometrical illusions. Psychological Review. 1899;6:241–261. [Google Scholar]
- Landy MS, Cohen Y, Sperling G. HIPS: a UNIX-based image processing system. Computer Vision Graphics and Image Processing. 1984;25:331–347. [Google Scholar]
- Levi DM, Klein SA. Sampling in spatial vision. Nature. 1986 Mar 27;320:360–362. doi: 10.1038/320360a0. [DOI] [PubMed] [Google Scholar]
- Levi DM, Klein SA. Equivalent intrinsic blur in amblyopia. Vision Research. 1990;30:1995–2022. doi: 10.1016/0042-6989(90)90017-f. [DOI] [PubMed] [Google Scholar]
- Levi DM, Waugh SJ. Position acuity with opposite-contrast polarity features: evidence for a nonlinear collector mechanism for position acuity. Vision Research. 1996;36:573–588. doi: 10.1016/0042-6989(95)00128-x. [DOI] [PubMed] [Google Scholar]
- Levi DM, Westheimer G. Spatial-interval discrimination: what delimits the interval? Journal of the Optical Society of America. 1987;4:1304–1313. doi: 10.1364/josaa.4.001304. [DOI] [PubMed] [Google Scholar]
- Masini R, Skiaky R, Pascarella A. The orientation of a parallel line texture between the verticals can modify the strength of the Poggendorff illusion. Perception and Psychophysics. 1992;52:235–242. doi: 10.3758/bf03209141. [DOI] [PubMed] [Google Scholar]
- Morgan MJ, Regan D. Spatial vision. Macmillan; London: 1990. Hyperacuity; pp. 87–113. [Google Scholar]
- Morgan MJ. Spatial filtering precedes motion detection. Nature. 1992;365:344–346. doi: 10.1038/355344a0. [DOI] [PubMed] [Google Scholar]
- Morgan MJ, Bruce V. Unsolved mysteries of the mind. Earlbaum; Hove: 1996. Visual illusions. [Google Scholar]
- Morgan MJ, Aiba TS. Vernier acuity predicted from changes in the light distribution of the retinal image. Spatial Vision. 1985;1:151–171. doi: 10.1163/156856885x00161. [DOI] [PubMed] [Google Scholar]
- Morgan MJ, Casco C. Spatial filtering and spatial primitives in early vision. Proceedings of the Royal Society B. 1990;242:1–10. doi: 10.1098/rspb.1990.0095. [DOI] [PubMed] [Google Scholar]
- Morgan MJ, Glennerster A. Efficiency of locating centres of dot clusters by human observers. Vision Research. 1991;31:2075–2083. doi: 10.1016/0042-6989(91)90165-2. [DOI] [PubMed] [Google Scholar]
- Morgan MJ, Hole GJ, Glennerster A. Biases and sensitivities in geometrical illusions. Vision Research. 1990;30:1793–1810. doi: 10.1016/0042-6989(90)90160-m. [DOI] [PubMed] [Google Scholar]
- Morgan MJ, Hole GJ, Ward RM. Evidence for positional coding in hyperacuity. Journal of the Optical Society of America A. 1990;7:297–304. doi: 10.1364/josaa.7.000297. [DOI] [PubMed] [Google Scholar]
- Morgan MJ, Mather G, Moulden B, Watt RJ. Intensity-response nonlinearities and the theory of edge localization. Vision Research. 1984;24:713–719. doi: 10.1016/0042-6989(84)90212-8. [DOI] [PubMed] [Google Scholar]
- Morgan MJ, Medford A, Newsome P. The orthogonal orientation shift and spatial filtering. Perception. 1995;24:513–524. doi: 10.1068/p240513. [DOI] [PubMed] [Google Scholar]
- Morgan MJ, Watt RJ. The combination of filters in early spatial vision: a retrospective analysis of the MIRAGE model. Perception. 1998;26:1073–1088. doi: 10.1068/p261073. [DOI] [PubMed] [Google Scholar]
- Morgan MJ, Watt RJ, McKee SP. Exposure duration affects the sensitivity of vernier acuity of target motion. Vision Research. 1983;23:541–546. doi: 10.1016/0042-6989(83)90129-3. [DOI] [PubMed] [Google Scholar]
- Mussap AJ, Levi DM. Spatial properties of filters underlying vernier acuity revealed by masking: evidence for collator mechanisms. Vision Research. 1996;36:2459–2473. doi: 10.1016/0042-6989(95)00306-1. [DOI] [PubMed] [Google Scholar]
- Paakkonen A, Morgan MJ. The effects of motion blur on blur discrimination; Paper presented at the Experimental Psychology Society; London, UK. 1992. [Google Scholar]
- Pointer JS, Watt RJ. Shape recognition in amblyopia. Vision Research. 1987;27:651–660. doi: 10.1016/0042-6989(87)90049-6. [DOI] [PubMed] [Google Scholar]
- Rogers B, Glennerster A. New depth to the Muller–Lyer illusion. Perception. 1993;22:691–704. doi: 10.1068/p220691. [DOI] [PubMed] [Google Scholar]
- Sakaguchi Y, Idesawa M, Yamatsuka T. A study of the Poggendorff illusion in connection with depth and occlusion. Investigative Ophthalmology and Visual Science. 1995;36:669. [Google Scholar]
- Tolansky S. Optical illusions. Pergamon; London: 1964. [Google Scholar]
- Watt RJ, Andrews DP. APE: adaptive Probit estimation of a psychometric function. Current Psychological Reviews. 1981;1:205–214. [Google Scholar]
- Watt RJ, Morgan MJ. Spatial filters and the localization of luminance changes in human vision. Vision Research. 1984;24:1387–1397. doi: 10.1016/0042-6989(84)90194-9. [DOI] [PubMed] [Google Scholar]
- Westheimer G. The spatial sense of the eye. Investigative Ophthalmology and Visual Science. 1979;18:893–912. [PubMed] [Google Scholar]
- Westheimer G. Visual hyperacuity. Progress in Sensory Physiology. 1981;1:2–29. [Google Scholar]
- Westheimer G, McKee SP. Spatial configurations for hyperacuity. Vision Research. 1977;17:941–947. doi: 10.1016/0042-6989(77)90069-4. [DOI] [PubMed] [Google Scholar]
- Whitaker D, Walker H. Centroid evaluation in the vernier alignment of random dot clusters. Vision Research. 1988;28:777–784. doi: 10.1016/0042-6989(88)90024-7. [DOI] [PubMed] [Google Scholar]
- Wilson HR. Responses of spatial mechanisms can explain hyperacuity. Vision Research. 1986;26:453–469. doi: 10.1016/0042-6989(86)90188-4. [DOI] [PubMed] [Google Scholar]
- Zehender WV. Ueber geometrisch-optische Tauschungen. Zeitschrift für Psychologie. 1899;20:65–117. [Google Scholar]


