

Abstract
Many cell types undergo a hypoxic response in the presence of low oxygen, which can lead to transcriptional, metabolic, and structural changes within the cell. Many biophysical studies to probe the localization and dynamics of single fluorescently labeled molecules in live cells either require or benefit from low-oxygen conditions. In this study, we examine how low-oxygen conditions alter the mobility of a series of plasma membrane proteins with a range of anchoring motifs in HeLa cells at 37°C. Under high-oxygen conditions, diffusion of all proteins is heterogeneous and confined. When oxygen is reduced with an enzymatic oxygen-scavenging system for ≥15 min, diffusion rates increase by >2-fold, motion becomes unconfined on the timescales and distance scales investigated, and distributions of diffusion coefficients are remarkably consistent with those expected from Brownian motion. More subtle changes in protein mobility are observed in several other laboratory cell lines examined under both high- and low-oxygen conditions. Morphological changes and actin remodeling are observed in HeLa cells placed in a low-oxygen environment for 30 min, but changes are less apparent in the other cell types investigated. This suggests that changes in actin structure are responsible for increased diffusion in hypoxic HeLa cells, although superresolution localization measurements in chemically fixed cells indicate that membrane proteins do not colocalize with F-actin under either experimental condition. These studies emphasize the importance of controls in single-molecule imaging measurements, and indicate that acute response to low oxygen in HeLa cells leads to dramatic changes in plasma membrane structure. It is possible that these changes are either a cause or consequence of phenotypic changes in solid tumor cells associated with increased drug resistance and malignancy.
Introduction
Single-particle tracking (SPT) is an experimental tool that is widely used to probe the dynamics and interactions between proteins in live cells (1–5). In many ways, the advent of superresolution fluorescence localization techniques (6–8) has simplified SPT measurements by enabling the measurement and quantification of a large number of single-particle trajectories in a single cell over extended time periods (9–11). This is accomplished through the use of photoactivatable or photoswitchable fluorescent probes, which can be present at high density and imaged at low density by activating a small subset of fluorophores in a single acquisition frame. One disadvantage of using photoactivatable or photoswitchable fluorescent probes for SPT measurements is that they tend to result in short single-molecule trajectories, whose reduced statistics poorly specify mobility parameters such as diffusion coefficients (12,13). A second disadvantage is that many photoactivatable or photoswitchable fluorescent probes either require a low-oxygen and reducing environment or have improved photophysical properties under these imaging conditions (14–16). Since oxygen is required for many normal cellular processes, imaging in low oxygen could potentially lead to findings that are not representative of those found in the presence of excess dissolved oxygen.
Cells in the body experience a wide range of local oxygen environments that can vary widely from typical culture and imaging conditions. The concentration of oxygen in a buffer that is equilibrated with normal (20%) atmosphere is roughly 200 μM at 37°C, whereas the dissolved oxygen concentration in vivo can be much lower, ranging from ∼2% to 10% (20–100 μM) in organs and tissues (17,18). Even lower oxygen conditions are found in some areas of the body, such as parts of the bone marrow (19), with some stem cells requiring <1–8% (<10–80 μM) for normal cellular development and differentiation (18). Low-oxygen conditions are routinely found in solid tumors, and, not surprisingly, some cancer cell types have adapted to survive and even thrive in these conditions (20). In many cases, cancer cells develop an altered metabolism that is not dependent on the regular availability of oxygen (21). The glucose oxidase and catalase enzymatic scavenging systems commonly used in single-molecule and superresolution imaging experiments achieve a steady state of 14.6 μM at room temperature (22), which is on the low end of the physiological range.
Low oxygen leads to the induction of hypoxic signaling cascades through the activation of hypoxia-inducible factor α (HIFα), which in turn regulates the expression of a large number of different protein species, including enzymes that are involved in glycolysis and factors that promote the growth of local vasculature (23). Acute, nontranscriptional responses include ATP reduction and mitochondrial damage, which can lead to the release of reactive oxygen species (ROS) and subsequent oxidation of biomolecules, including lipids (24). In some stem cells and cancers, changes in local oxygen concentration can induce large phenotypic changes, including differentiation and reprogramming (18,21). Since many laboratory cell lines originate from cancers or rapidly dividing stem cells, the low-oxygen conditions that are convenient for single-molecule imaging measurements could potentially lead to large changes in experimental outcomes. Here, we demonstrate that in HeLa cells, hypoxic imaging conditions induce large changes in the speed, confinement, and heterogeneity of the motions of plasma membrane proteins.
Materials and Methods
Model protein constructs, cells, and transfection
The model protein design is summarized in Table S1 of the Supporting Material. The mEos3.2 photoswitchable protein (25) was anchored to the membrane by the following motifs: glycosylphosphatidylinositol (GPI) derived from CD58 (26), a geranylgeranyl moiety with a polybasic sequence (GG) derived from K-Ras (27), a palmitoyl and myristoyl posttranslational modification (PM) derived from Lyn kinase (27), a single transmembrane (TM) domain derived from hemagglutinin with point-mutated cysteines to prevent palmitoylation (28), the full-length human β2 adrenergic receptor (β2AR) (29), and ezrin (30). For those constructs for which protein had to be delivered to the outside of the plasma membrane (GPI, TM, and β2AR), an ER translocation sequence (MELFWSIVFTVLLSFSCRGSDWESLQSTVPR) was added upstream of mEos3.2 to ensure surface delivery. Each gene was inserted into C1 or N1 plasmid from Clontech (Mountain View, CA). The localization of phosphatidylinositol 4,5 bisphosphate (PI(4,5)P2) was determined using the PH domain from PLC-δ1 conjugated to eGFP (31). HeLa (human cervical carcinoma) cells were maintained at 5% CO2 at 37°C in Dulbecco’s modified Eagle’s medium (DMEM) supplemented with L-glutamine, 5% fetal bovine serum (FBS), and 1% Pen/Strep reagent. Chinese hamster ovary (CHO) and green monkey kidney cell line COS-7 cells were maintained in DMEM supplemented with L-glutamine, 10% FBS, and 1% PenStrep reagent. RBL-2H3 cells were maintained in DMEM with L-glutamine, 20% FBS, and 50 μg/ml gentamicin reagent. CH27 cells were carried in DMEM supplemented with 2 mM L-glutamine, 15% FBS, 50 μM β-mercaptoethanol, and 1% Pen/Strep reagent. All cell culture reagents were purchased from Gibco/Life Technologies (Carlsbad, CA). HeLa, COS-7, and CHO cells were plated in 35 mm glass-bottomed MatTek dishes (Ashland, MA) 12–24 hr before transfection with 0.5 μg DNA using GeneIn (Amsbio, Abingdon, UK). Cells were incubated for 12–36 h after transfection and then imaged. RBL-2H3 and CH27 cells were transfected via electroporation using the Lonza Nucleofector system (Lonza, Allendale, NJ) and imaged 12–24 hr after transfection.
Imaging buffers
The low-oxygen (hypoxic) imaging buffer contained Tris-buffered saline solution (65 mM Tris, 100 mM NaCl, 5 mM KCl, 1 mM MgCl2, 1.8 mM CaCl2 at pH 7.5) plus 15 mg/ml glutathione, 9 mg/ml glucose, and 1 mg/ml bovine serum albumin (BSA). CH27 and RBL-2H3 cells were imaged in the same buffer but with 4 mg/ml glutathione added. An enzymatic oxygen-scavenging system (0.5 mg glucose oxidase and 0.04 mg catalase added per 1 ml imaging buffer) was included. The high-oxygen (normoxic) imaging buffer consisted of 135 mM NaCl, 5 mM KCl, 1 mM MgCl2, 1.8 mM CaCl2, 5.6 mM glucose, 1 mg/mL BSA, and 20 mM HEPES (pH 7.4). All reagents for imaging buffer were acquired from Sigma-Aldrich (St. Louis, MO).
Single-molecule imaging
Cells were imaged using total internal reflection (TIR) illumination through a 100×, 1.49 N.A. oil-immersion objective with an IX81-ZDC inverted microscope (Olympus America, Center Valley, PA). Fluorescent cells were identified using low-intensity 495 ± 50 nm wide-field light from an LED excitation system (Cool LED, Andover, UK). An Ixon Ultra 897 EMCCD camera (Andor, Belfast, Northern Ireland) provided sensitivity for single-molecule detection under light from a 561 nm sapphire laser (Coherent, Santa Clara, CA). A second 405 nm laser (Cube; Coherent) was used to stimulate photoconversion of mEos3.2 to the 561 nm-excitable state. Excitation and emission were filtered by a multi-bandpass filter cube (LF405/488/561/635; Semrock, Rochester, NY). Temperature was controlled to 36.8°C ± 1.0°C using manual settings on a sample temperature feedback cooling and heating stage-top incubator (INUCP-KRi-F1; Tokai Hit, Fujinomya, Japan). In the low-oxygen (hypoxic) buffer, data were acquired over 4–10 min at close to 50 frames per second (20 ms integration time) using custom acquisition software written in MATLAB (The MathWorks, Natick, MA). Additional measures were used to prevent phototoxicity under high-oxygen (normoxic) conditions, including reducing the excitation light intensity by 20–50%, increasing integration times to 30 ms, and limiting data acquisition to a maximum of 5 min.
Localization, SPT, and reconstructed images
Fluorophores in each frame of a recording were localized using custom software written in MATLAB as described previously (32). Diffraction-limited spots were fit to a two-dimensional Gaussian function through least-squares fitting using fminunc(). In this method, localizations are culled to remove outliers in width, brightness, aspect ratio, and localization precision. The image area is masked to exclude regions away from the cell, and single molecules identified outside of this mask are excluded from further analysis. Single-particle trajectories are generated by a simple nearest-neighbor algorithm that connects localized fluorophores in successive frames within a specified cutoff distance, and tracks are terminated when more than one connection can be made within that distance. The cutoff is chosen by monitoring histograms of step sizes from generated tracks to ensure that it follows a smooth and single peaked distribution. If a spot cannot be linked to the previous frame, the algorithm seeks candidate spots a second frame back to compensate for momentary blinking of the fluorophore or occasional losses of localized molecules in image processing. This simple algorithm was found to yield results comparable to those obtained with more complicated tracking algorithms involving global minimizations (33). Superresolution images were reconstructed by incrementing the value of a matrix corresponding to the localized position and then filtering by a Gaussian function with a standard deviation of 50 nm. In live cells, to reduce spatial correlation artifacts from moving particles, only the first point of each recorded trajectory was included in reconstructed images. The absolute intensity of images reconstructed in this way is arbitrary, since it depends on the expression level as well as the photophysical properties of the probes, such as the on rate, off rate, and duty cycle, which can vary between experimental conditions.
Quantification of diffusion parameters
The mean-squared displacement (MSD) as a function of time interval (τ) was tabulated from single-molecule trajectories (x(t), y(t)) followed for at least 12 image frames according to MSD(τ) = <(x(t + τ) − x(t))2> + <(y(t + τ) − y(t))2>, where < > denotes an average over all time (t). Single-molecule diffusion coefficients (DSM) were defined as MSD(τ) = 4DSMτ + offset and were evaluated through a weighted linear least-squares fitting routine in MATLAB (lscov) using points 2–4 of the MSD(τ) curve, corresponding to 40 ≤ τ ≤ 80 ms under low-oxygen conditions and 60 ≤ τ ≤ 120 ms under high-oxygen conditions. The first τ point was excluded because the integration time is a significant fraction of the frame time and is not well specified (34). The weights used were the inverse of the standard error of the mean for each MSD(τ), and offsets were consistent with the average localization precision of 30 nm. The confinement exponent α was defined as MSD(τ) = A τα and was evaluated by fitting points 1–6 of log(MSD) versus log(τ) to a line, also using lscov. A is a constant that is disregarded, and including a linear offset in this relation did not significantly alter the results presented. Representative trajectories, MSD(τ) curves, and fits to extract DSM and αSM are shown in Fig. S1. In Tables 1 and 2, diffusion coefficients are reported corresponding to the mean and 25th–75th percentiles of the data. These were obtained from the cumulative distribution function using the ecdf function in MATLAB.
Table 1.
Single-molecule diffusion parameters under high-oxygen conditions in HeLa cells
| <DSM> | DSM (25–75%) | <αSM> | αSM (25–75%) | |
|---|---|---|---|---|
| PM | 0.30 | 0.048–0.58 | 0.61 | 0.15–1.0 |
| GG | 0.23 | 0.020–0.45 | 0.63 | 0.23–1.0 |
| GPI | 0.16 | 0.022–0.26 | 0.53 | 0.15–0.92 |
| TM | 0.11 | 0.027–0.20 | 0.56 | 0.16–0.92 |
| β2AR | 0.060 | 0.014–0.11 | 0.34 | 0.030–0.62 |
| Brownian | 0.96 × D | 0.55 × D –1.33 × D | 0.94 | 0.73–1.15 |
DSM is given in μm2/s. <DSM> and <αSM> indicate the mean value and (25–75%) indicates the range of values corresponding to the 25th–75th percentiles of measured values. Brownian refers to the mobility parameters obtained by fitting simulated Brownian trajectories with diffusion coefficient D.
Table 2.
Single-molecule diffusion parameters under low-oxygen conditions
| <DSM> | DSM (25–75%) | DBrownian | <αSM> | αSM (25–75%) | |
|---|---|---|---|---|---|
| PM | 0.96 | 0.43–1.6 | 0.97 ± 0.19 | 0.90 | 0.70–1.2 |
| GG | 0.67 | 0.19–1.2 | 0.99 ± 0.16 | 0.69 | 0.18–1.1 |
| GPI | 0.71 | 0.36–1.0 | 0.73 ± 0.06 | 0.87 | 0.67–1.1 |
| TM | 0.36 | 0.18–0.53 | 0.40 ± 0.01 | 0.89 | 0.70–1.1 |
| β2AR | 0.26 | 0.13–0.38 | 0.27 ± 0.01 | 0.87 | 0.67–1.1 |
| Brownian | 0.96 × D | 0.55 × D –1.33 × D | D | 0.94 | 0.73–1.15 |
DSM is given in μm2/s. <DSM> and <αSM> indicate the mean value and (25–75%) indicates the range of values corresponding to the 25th–75th percentiles of measured values. DBrownian corresponds to the diffusion coefficient needed to obtain the best agreement between Brownian simulations and experimental data, as described in Materials and Methods. Brownian refers to the mobility parameters obtained by fitting simulated Brownian trajectories with diffusion coefficient D.
Brownian motion was simulated by generating lateral displacements in two dimensions using a Gaussian distributed random number generator in MATLAB (randn). Simulated trajectories were constructed using the empirical distribution of trajectory lengths, taking into account trajectories with segments that skip image frames. When included in the figures, histograms of simulated DSM were shifted along the diffusion coefficient axis to determine the simulated diffusion coefficient that was in the best agreement with experimental findings (the corresponding bulk diffusion coefficient values are reported in Table 2). The amplitude of the simulated DSM histograms varies in the figures to facilitate comparison with acquired data.
Giant plasma membrane vesicles
Giant plasma membrane vesicles (GPMVs) labeled with DiI-C12 were generated through incubation with low concentrations of dithiothreitol and formaldehyde (35,36), and imaged as previously described (37). Transition temperatures were determined by measuring the fraction of GPMVs that contained coexisting liquid phases as a function of temperature, and fitting to a sigmoid function to extract the temperature at which half of the vesicles had passed through the transition (37). GPMVs of CH27 cells were not investigated, because these cells are not adherent and this introduces technical challenges. SPT measurements in GPMVs were accomplished by expressing TM in CHO cells and producing GPMVs in an active buffer containing 4 mM glutathione instead of dithiothreitol and without DiI-C12 labeling. Single molecules in GPMVs were imaged and temperature was controlled as described above for measurements in intact cells.
Phalloidin staining
Cells were fixed using 4% paraformaldehyde and 0.1% glutaraldehyde after incubation for 30 min at 37°C with either a normoxic or hypoxic buffer. Cells were permeabilized with 0.1% Triton X-100 and stained with Alexa Fluor 647 (A647)-labeled phalloidin (Invitrogen/Life Technologies, Carlsbad, CA) according to the protocol supplied by the manufacturer.
Superresolution fluorescence localization imaging and cross-correlation analysis
Transiently transfected HeLa cells were chemically fixed and then stained with phalloidin as described above. Single-molecule emissions from mEos3.2 and A647 were acquired simultaneously over at least 5000 image frames and the raw data were used to reconstruct high-resolution images without grouping multiple localizations of the same fluorophore or added blurring, as described previously (32,38). Cross-correlation functions measure the increased probability of finding an A647 probe at a radius r away from a mEos3.2 probe, or vice versa, compared with that expected from a random distribution. Cross-correlation functions were tabulated from masked regions of single transfected cells as described previously (32,38) and normalized such that the value of one represents a random distribution, and the curves shown represent an average over four to six distinct cells.
Results and Discussion
Diffusion of a minimal TM peptide is heterogeneous and confined in live HeLa cells
We probed the mobility of a single-pass TM peptide conjugated to the photoswitchable fluorophore mEos3.2 (25) and transiently expressed in HeLa cells at 37°C. We visualized and localized single molecules, and then assembled trajectories using standard algorithms as described in Materials and Methods. Using the photoswitchable fluorophore mEos3.2, we were able to acquire a large number of trajectories within a single cell over a time course of minutes because excitation and activation lasers could be tuned such that only a sparse subset of fluorophores were imaged in a single acquisition frame. This is demonstrated in Fig. 1 A, which shows trajectories acquired by imaging a single HeLa cell for 4 min, and raw data are shown in Movie S1.
Figure 1.

SPT-PALM of a transmembrane peptide in normoxic HeLa cells at 37°C. (A) Single-molecule trajectories lasting at least 12 image frames are superimposed on a reconstructed image generated from all localized particles. (B) Single-particle diffusion coefficients are more broadly distributed in this single cell than expected from Brownian motion with the same track length distribution. DSM is tabulated as described in the main text. (C) Diffusion histograms from a single cell are representative of those measured over multiple cells. (D) The distribution of the confinement exponent α indicates the presence of an immobile fraction centered around α = 0 (red arrow). Mobile (α > 0) trajectories are shifted to lower values than expected for Brownian motion, indicating some confinement. (E) α shows modest cell-to-cell variation, primarily in the fraction of immobile trajectories. To see this figure in color, go online.
We quantified the mobility of single molecules by first tabulating the MSD as a function of time interval (τ) from trajectories lasting at least 12 image frames, corresponding to 360 ms. We extracted single-molecule diffusion coefficients (DSM) by fitting points 2–4 of MSD(τ) to a line, corresponding to 60 ms ≤ τ ≤ 120 ms, with the initial time interval excluded to avoid potential artifacts arising from the finite integration time in these measurements. Here, DSM is simply defined as the slope of this line divided by 4. We estimated the confinement of single-molecule trajectories by fitting points 1–6 (≤180 ms) of MSD(τ) to Aτα, where A is a constant that is disregarded. The parameter α is frequently called the confinement exponent, where α = 1 indicates Brownian or unconfined motion, α < 1 indicates confined motion, and α > 1 indicates directed motion (39,40). Several representative MSD(τ) curves fit to extract DSM and α are shown in Fig. S1, and the ensemble of these values measured from trajectories acquired from a single cell is shown in Fig. 1, B and D.
The distribution of single-molecule mobility observed in a single cell is broad, spanning over 2 orders of magnitude in DSM and between −0.5 and 1.5 in α. Some of this heterogeneity arises from inherent challenges in specifying single-molecule diffusion coefficients from short trajectories (12,13), because MSD(τ) has a low signal/noise ratio. For comparison, we extracted DSM and α as described above, but from simulated Brownian trajectories with the same track-length distribution as observed experimentally. The simulated distributions of DSM are narrower than those observed in cells (Fig. 1 B), indicating that the motions of the TM protein are more heterogeneous than would be expected from a single population of Brownian diffusers. The experimental distribution of α is shifted to lower values than those obtained from the Brownian simulation (Fig. 1 D). Additionally, a distinct peak at α = 0 indicates a population of immobile or highly confined trajectories. Taken together, these results indicate that the experimentally observed trajectories are both more heterogeneous and more confined than simulated Brownian trajectories. The distributions of both DSM and α in this single cell are representative of those obtained by collecting trajectories from six distinct cells (Fig. 1, C and E), indicating that heterogeneity of motion within a single cell dominates over cell-to-cell variation.
A number of previous studies have reported that plasma membrane proteins and lipids exhibit heterogeneous motion in intact cells. For example, several studies reported that between 20% and 40% of plasma membrane proteins are immobile or highly confined (40–42). Furthermore, the mobile fraction often fits best to two populations of diffusers with different diffusion coefficients (40,43,44). Combinations of different modes of diffusion, including free Brownian, confined, and directed diffusion, have often been observed (40,42–45). The data presented in Fig. 1 are consistent with these previous findings. Distributions of DSM can minimally be described as a superposition of three states, one immobile and two confined mobile populations, although more complicated models could also describe this data set. On our microscope system, immobile trajectories yield a distribution of diffusion coefficients centered near 0.01 μm2/s due to localization error, as we experimentally determined by imaging chemically fixed cells (Fig. S2). For the purposes of this study, we report the mean DSM to estimate diffusion coefficients. For TM in this cell, the mean DSM is 0.13 μm2/s and 50% of the trajectories fall within the range of 0.03–0.23 μm2/s. The mean DSM is slightly lower when all trajectories recorded over six distinct cells are included (Table 1).
Diffusion is heterogeneous and confined for a series of structurally distinct plasma membrane anchors
In addition to the TM protein described above, we characterized the lateral diffusion of a series of proteins consisting of mEos3.2 anchored to the plasma membrane through a variety of motifs. These included a GPI-linked protein trafficked to the outer leaflet, an inner leaflet protein conjugated through PMs, a second inner leaflet protein with a polybasic stretch adjacent to a GG posttranslational modification, and the full-length β2 adrenergic receptor (β2AR), which is a seven-pass G protein-coupled receptor. Except for β2AR, all of the investigated proteins are biologically inert minimal anchor peptides conjugated to the fluorescent probe. The sequences of these constructs and their sources are listed in Table S1, and a schematic of their modes of anchoring with the membrane is depicted in Fig. 2 A.
Figure 2.

The motions of a series of plasma membrane anchors are both heterogeneous and confined in HeLa cells at 37°C. (A) Schematic representations of the five membrane proteins used in this study. (B and C) Distributions of single-molecule diffusion coefficients (DSM, B) and confinement exponents (α, C) tabulated from trajectories followed for at least 12 image frames. Each curve includes trajectories collected from at least five cells per condition. To see this figure in color, go online.
As was the case with our single-pass TM protein, the histograms of single-molecule diffusion coefficients are broad for all proteins investigated, although the average diffusion coefficients vary between constructs, as can be seen in Fig. 2 B and Table 1. Heterogeneous motion is observed for all anchor types, suggesting that although the detailed structure of the anchor affects absolute diffusion coefficients, it does not determine motional heterogeneity. Instead, structural features of the membrane itself likely dominate motional heterogeneity, such that all anchoring schemes are affected. This could arise from molecular crowding or corralling due to interactions with the underlying cytoskeletal network (46–49). Just as was the case with TM, histograms of DSM could be described using a superposition of one immobile and two mobile populations of diffusers. The mean and 25th–75th percentile DSM values for all proteins are listed in Table 1.
Overall, the ranges of diffusion coefficients measured for the proteins in Fig. 2 B and Table 1 are consistent with or lower than values previously obtained for similar proteins by a range of experimental methods. Previous studies measured GG and PM diffusion coefficients to be between 0.4 and 1.1 μm2/s (41,43,50), and GPI-anchored protein diffusion was measured to be between 0.17 and 1.1 μm2/s (41,51–54). Diffusion coefficients for minimal TM anchors similar to the one investigated here were reported to be within 0.14–0.58 μm2/s (41,51–53), and GPCRs were shown to diffuse at rates of 0.013–0.48 μm2/s (45,55–59). It is notable that the range of diffusion coefficients reported in the literature for even these simple proteins is broad. This is likely due to differences arising from the different methods and cell types used, as well as differences in the methods and models used to analyze results. The mean values in Table 1 are systematically on the lower end of the diffusion coefficients described in the literature. There are two likely reasons for this: First, in contrast to most previous studies, we did not attempt to neglect immobile trajectories, which in some cases are a substantial fraction of total trajectories. In our experiments, immobile trajectories showed a distribution of diffusion coefficients centered at roughly 0.01 μm2/s (Fig. S2). Second, the mean DSM reported in Table 1 underestimates the bulk diffusion coefficient even in simulated Brownian trajectories with our empirical track-length distribution (D in Table 1). Both of these factors act to lower our reported diffusion coefficients.
By examining the distributions of α shown in Fig. 2 C and Table 1, one can see that confinement is evident for all proteins investigated. In all cases, the histograms contain a population that is peaked around α = 0, corresponding to the immobile proteins in the diffusion histograms. With the exception of PM, histograms also contain a second peak centered at α < 1, indicating that the remaining trajectories are mobile but confined. For PM, we find that the mobile population is largely unconfined. PM is also the protein with the fastest diffusion coefficients, and it is possible that the reduced confinement detected for this protein is a result of the larger relative distance this protein travels between acquisition frames separated by 30 ms. If this distance is much larger than the characteristic distances of confined regions, we may not have the sensitivity to observe confinement. Previous studies have also reported confinement of similar membrane anchored proteins. Kenworthy et al. (41) found an 85–90% mobile fraction across multiple proteins. Lommerse et al. (43) found ∼40% confinement for proteins that are similar to PM and GG, a number that likely encompasses both immobile and highly confined mobile diffusers.
Hypoxia leads to homogeneous and unconfined motion in HeLa cells
There are significant advantages to conducting single fluorophore or superresolution localization microscopy measurements in low-oxygen and reducing conditions. For mEos proteins, reduced oxygen in the imaging buffer supports a higher quantum yield and reversible photoswitching (15), and low oxygen is required for efficient photoswitching of the majority of organic fluorophores used in superresolution fluorescence localization measurements (14,16,60). In addition, reduced oxygen leads to a reduced production of oxygen free radicals that are toxic to many cells. Extended exposure of HeLa cells to 560 nm light at the levels used in this study led to the production of blebs when cells were imaged in a conventional imaging buffer for ∼20 min (Fig. S3). For this reason, light exposure was limited to <5 min in the measurements described above. Light-induced blebbing was not observed in an imaging buffer that contained a reducing agent and oxygen-scavenging system. Cells did not stain with propidium iodide after incubation in a hypoxic and reducing imaging buffer for 30 min (Fig. S3).
Although low-oxygen conditions are preferable for SPT imaging using mEos3.2, we observed significant changes in the mobility of membrane-anchored proteins in HeLa cells under these conditions. Single-molecule trajectories explored larger areas when cells were imaged under low-oxygen conditions, and fewer confined trajectories were evident (Fig. 3). Also, images reconstructed using the first localized point of all trajectories appeared more self-clustered in normoxic versus hypoxic cells, possibly indicating that the proteins were heterogeneously distributed under normoxic conditions. The distributions of single-molecule diffusion coefficients narrowed and shifted to larger values for all proteins investigated under hypoxic conditions (Fig. 4). The distributions of confinement exponents also shifted to larger values and few trajectories were immobile for most proteins. One minor exception is GG (Fig. 4 B), which retained a significant immobile population. We attribute this to a fraction of this protein being deposited on the glass slide due to secretion or cell lysis (Fig. S4). Remarkably, the mobility parameters for all proteins investigated were well represented by a single population of Brownian diffusers, which can be seen by comparing the experimental observations with those extracted from simulated trajectories.
Figure 3.

Reconstructed images and trajectories for TM and GPI imaged under high- and low-oxygen conditions. Images were reconstructed using the first localized position in all trajectories acquired in ≤3 min of acquisition time independently of trajectory length, as described in Materials and Methods. The trajectories superimposed on this image were followed for at least 12 frames and are color-coded according to the tabulated single-molecule diffusion coefficient DSM. To see this figure in color, go online.
Figure 4.
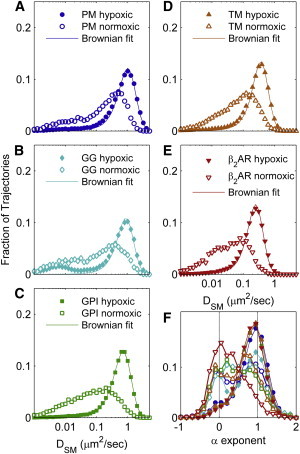
Diffusion coefficients increase and become Brownian in HeLa cells under low-oxygen conditions. (A–E) Broadly distributed histograms of DSM in HeLa cells imaged under normal oxygen conditions sharpen and shift to higher values when proteins are imaged in low-oxygen conditions. The distributions of DSM narrow to such an extent that their shape is well described by Brownian simulations with the same track length distribution as observed experimentally. Diffusion coefficients extracted by fitting to Brownian simulations are given in Table 2. (F) The confinement exponent α also shifts to larger values when cells are imaged under low-oxygen conditions. In all cases, distributions show a peak near α = 1 and closely resemble those observed for simulated Brownian trajectories. To see this figure in color, go online.
Changes in lateral diffusion in the photoprotective buffer are attributed to the oxygen depletion. Removing glutathione from the buffer had little effect on protein mobility (Fig. S5). Addition of an enzymatic oxygen-scavenging system (glucose, glucose oxidase, and catalase) to a normoxic imaging buffer resulted in a faster and apparently more Brownian motional profile in the same plate of cells within 10–15 min at 37°C (Fig. S6). Oxygen depletion was previously shown to cause a similar increase in lateral diffusion of membrane proteins in other cell types (61,62). In those studies, increased diffusion was attributed to both cytoskeletal remodeling (61) and increased peroxidation of lipids in the hypoxic state (61–63).
The hypoxic diffusion phenotype is less pronounced in other cell lines
As shown in Figs. 3 and 4, dramatic changes in diffusion were observed in HeLa cells incubated in an oxygen-scavenging buffer for a range of structurally distinct plasma membrane-anchored proteins and peptides. To explore whether this phenotype also occurs in other commonly used cell types, we examined the diffusion of plasma membrane proteins in four other laboratory cell lines under normal and oxygen-scavenging imaging conditions. Histograms of DSM and α were tabulated from trajectories acquired at 37°C and are shown in Fig. 5. CHO cells were derived from a hamster ovary primary culture and showed a decrease in the fraction of immobile trajectories of PM anchors under hypoxic conditions, although the diffusion coefficients of mobile trajectories remained largely unchanged. COS7 cells are transformed kidney fibroblasts derived from monkey. No significant change was observed in the number of mobile trajectories of the TM anchor, although a slight increase in diffusion coefficient was observed. RBL-2H3 cells are a mast cell line derived from rat. The diffusion coefficient of GPI increased slightly and became slightly more homogeneous in RBL cells imaged in a low-oxygen buffer. Lastly, CH27 cells are a mouse B cell lymphocyte cell line. The mobility of the PM anchor increased slightly when cells were imaged in a low-oxygen buffer. This is consistent with previous studies in RBL-2H3 and primary B cells that showed that cells retain robust calcium mobilization in response to immune receptor cross-linking in low-oxygen and reducing conditions (11,64), suggesting that functionally relevant plasma membrane remodeling does not occur in these cell types after acute exposure to a low-oxygen environment. Overall, these results indicate that low-oxygen and reducing conditions do affect the mobility of plasma membrane proteins in a range of cell types, but not necessarily to the extent observed in HeLa cells. The more subtle changes in probe mobility observed in these other cell types are more in line with previous observations upon perturbation of ATP depletion (65).
Figure 5.

Diffusion is moderately affected by a low-oxygen imaging environment in other cell types. The normoxic and hypoxic imaging buffers are described in Materials and Methods. PM was expressed in CHO and CH27 cells, GPI was expressed in RBL-2H3 cells, and TM was expressed in COS7 cells. Each curve contains trajectories from at least three separate cells. To see this figure in color, go online.
It may not be surprising that HeLa cells showed a more dramatic response to low-oxygen conditions compared with other cell types. The HeLa cell line is derived from human cervical cancer, a solid tumor in which cells must be able to adapt to a range of local oxygen environments to survive and proliferate. Low-oxygen conditions can stimulate cancer cells to migrate, trigger the activation of growth factor receptors, or lead to oxygen-responsive transcriptional regulation (66,67). It is also well documented that the degree of hypoxia measured in tumors correlates with aggression, treatment resistance, and lower survival rates for patients with solid cancers, including cervical cancer (68–70). It is possible that the cellular changes that lead to increased diffusion rates in HeLa cells are a consequence of signaling pathways that are activated under low-oxygen conditions or are involved in growth, proliferation, or migration.
Hypoxia leads to actin remodeling in HeLa cells
Brightfield images indicate that HeLa cells are more rounded in low-oxygen conditions than in high-oxygen conditions (Fig. 6 A). This is consistent with previous reports that cortical actin is remodeled in response to this condition (61). Cytoskeletal remodeling is also evident when actin is stained with phalloidin in chemically fixed cells, a probe that selectively binds F-actin. Fig. 6 A also shows epifluorescence and TIR images of HeLa cells that were chemically fixed in normoxic buffer, or after incubation in a hypoxic buffer for 30 min at 37°C. Notably, hypoxic HeLa cells contain a large number of actin-rich protrusions that are also present in normoxic HeLa cells, but to a much lesser extent. Similar protrusions are observed in HeLa cells immediately prior to cell division (71), so it is possible that this hypoxic condition in some way resembles cells in the G2 or M stages of the cell cycle. Phalloidin staining suggests that cortical actin may be depleted on the proximal surface in hypoxic cells relative to the protrusions and cell edges. We also probed for actin remodeling in the other cell types shown in Fig. 5. We found that although changes in phalloidin staining were observed in cells that were chemically fixed under normoxic and hypoxic conditions, they were not as dramatic as what was observed in HeLa cells (Fig. S7).
Figure 6.

(A) Incubation of HeLa cells with oxygen-scavenging buffer for 30 min at 37°C induces changes in morphology. HeLa cells, which are typically flat and geometric, become rounded in low oxygen when viewed under brightfield transmitted light. Actin, stained with phalloidin after fixation, becomes more pronounced in the cell cortex and actin-rich protrusions are evident in both epifluorescence and TIR images. Scale bars are 20 μm. (B) Single-molecule diffusion coefficients for the TM in isolated GPMVs, hypoxic, and normoxic cells. Cells were imaged at 37°C and DSM was determined for trajectories lasting at least 12 frames. GPMVs were imaged at 32°C and DSM was determined for trajectories lasting at least four frames, which served to broaden the distributions. To see this figure in color, go online.
Previous studies reported increased rates of diffusion of some membrane proteins and lipids in the presence of inhibitors of actin polymerization (65,72), and there is evidence that the majority of plasma membrane proteins are corralled by a direct or indirect interaction with actin on the timescales and distance scales probed in this study (73). Based on these previous findings and the actin staining results shown in Fig. 6 A, we hypothesized that actin remodeling at the proximal cell surface is responsible for the dramatically increased rates of diffusion in HeLa cells and more minor increases in other cell types. It should be noted that the diffusion coefficients in hypoxic HeLa cells remained much lower than those observed in plasma membrane vesicles isolated from cortical actin (Fig. 6 B), suggesting that any loss of actin-membrane coupling was only partial. We measured the mean DSM for TM in GPMVs to be 0.9 μm2/s at 32°C, which is more than a factor of 2 faster than the same protein in hypoxic HeLa cells at a higher temperature (D = 0.37 μm2/s at 37°C).
If the organization of membrane anchors is affected by local actin density, either through direct/indirect interactions or through the generation of membrane topology by actin-rich protrusions (74), reduced coupling to cortical actin could influence diffusion. To address this issue, we imaged chemically fixed and phalloidin-stained HeLa cells expressing either the TM or GPI, using superresolution fluorescence localization imaging methods (Fig. 7 A). Phalloidin was heterogeneously distributed on the proximal cell surface under both normoxic and hypoxic conditions, with normoxic cells showing stress fibers and hypoxic cells showing accumulation of phalloidin in protrusions and at the cell periphery. Lateral heterogeneity was not apparent for TM anchors under either fixed hypoxic or fixed normoxic conditions beyond the overcounting artifacts associated with this single-color measurement (32). This is in contrast to the reconstructed images from live cells shown in Fig. 3, where the TM appears more self-clustered in normoxic versus hypoxic cells. This discrepancy between live-cell and fixed-cell reconstructed images is most likely due to reversible blinking of immobile proteins in live-cell measurements. In chemically fixed cells, the vast majority of mEos3.2-labeled probes are sampled multiple times over the course of an imaging measurement. This is why the reconstructed images in Fig. 7 A appear as a collection of well-sampled spots. In live cells, the same overcounting occurs, but only contributes to a self-clustered appearance when probes do not diffuse over large distances between observations. Since there are many more immobile trajectories in normoxic HeLa cells than in hypoxic ones, this overcounting artifact likely leads to the appearance of more self-clustering in the former.
Figure 7.

Membrane anchors do not strongly colocalize with F-actin. (A) Reconstructed superresolution images of the TM and phalloidin in HeLa cells chemically fixed under normoxic and hypoxic conditions. (B) Colocalization was quantified using pair cross-correlation functions as described in Materials and Methods; error bounds denote the standard error of the mean between cells. Cross correlations remain close to one at all radii, indicating that all probes are only weakly colocalized with f-actin as stained with phalloidin. For comparison, similar measurements were also done with HeLa cells expressing the actin adaptor protein ezrin-mEos3.2, where larger cross correlations are observed at short radii. To see this figure in color, go online.
We quantified the codistribution of phalloidin and both TM and GPI anchors using pair cross-correlation functions, which measure the relative density of membrane anchors as a function of distance away from the average phalloidin probe or vice versa (Fig. 7 B). We obtained cross-correlation functions that remained close to one for all anchors and conditions, indicating that there was remarkably little colocalization between phalloidin and either the TM or GPI anchors in both normoxic and hypoxic cells. For comparison, we also imaged ezrin conjugated to mEos3.2, which showed greater colocalization with phalloidin under both fixation conditions, as indicated by cross-correlation values of >1 for radii of <100 nm. Ezrin is an adaptor protein that can bind to both actin and some plasma membrane proteins (30), and is largely immobile when expressed and tracked in live HeLa cells (Fig. S8). We observed a slightly reduced colocalization of ezrin with F-actin under hypoxic conditions, consistent with the notion that there is reduced coupling between cortical actin and the plasma membrane under these conditions.
The results presented in Fig. 7 suggest that the reduced diffusion of the TM and GPI anchors in normoxic cells is not due to selective recruitment of anchors to regions of high F-actin density. If actin is indeed responsible for the reduced and confined diffusion of minimal membrane anchors under normoxic conditions, it likely acts through a mechanism whereby probe dynamics are affected without altering probe organization. This could occur if actin structure influences membrane hydrodynamics (75) or if probe confinement occurs through passive corralling by actin or actin-associated components (47,76). Our finding that organization is not greatly correlated with actin for the TM and GPI anchors is expected, since they are minimal anchors that should not specifically interact with other cellular proteins. Previous studies have demonstrated colocalization of full-length proteins with actin using similar methods in a range of contexts (10,77,78)
Changes in lipid composition under hypoxic conditions do not correlate with diffusion changes
In a previous study, Yu et al. (79) showed that HeLa lipid composition was altered when the lipid was incubated in hypoxic buffer for 3 h and whole-cell lipid extracts were quantified by mass spectrometry. They found an overall reduction in the concentration of PI lipids. Based on that result, we hypothesized that a general loss of PI(4,5)P2 lipid at the plasma membrane could contribute to increased rates of diffusion, since this lipid is implicated in coupling the inner leaflet to cortical actin (80,81). To address this issue, we transiently expressed a PI(4,5)P2-sensitive PH domain conjugated to eGFP in HeLa cells and chemically fixed under both normoxic and hypoxic conditions. We did not observe any obvious change in membrane localization of the PH probe when imaged by epifluorescence microscopy (Fig. 8 A), suggesting that PI(4,5)P2 is retained at the plasma membrane under the hypoxic conditions explored in this study. Previous studies observed changes in the same PH domain localization under conditions that are known to disrupt membrane-actin coupling, through methods that induce blebbing (81).
Figure 8.

(A) Transiently expressed PH-eGFP is a marker of PI(4,5)P2 lipids and is localized to the plasma membrane in HeLa cells chemically fixed under both normoxic and hypoxic conditions. (B) GPMVs prepared from hypoxic HeLa cells contain two coexisting liquid phases at temperatures above those prepared from normoxic HeLa cells, indicating that they have a higher miscibility transition temperature. (C) Transition temperature shifts vary in sign and magnitude for the different cell types investigated. To see this figure in color, go online.
Yu et al. (79) also noted an increase in the general level of unsaturation under hypoxic conditions, and other groups have attributed an increase in lipid peroxidation to the release of ROS from mitochondria (62,68,82). This led us to hypothesize that increases in diffusion coefficients in hypoxic cells are a result of changes in the mixing properties of plasma membrane lipids. To investigate this hypothesis, we prepared GPMVs from normoxic and hypoxic cells, and then measured the average miscibility transition temperature of these vesicles. Miscibility transition temperatures were systematically higher in GPMVs prepared from hypoxic HeLa cells (21°C ± 1°C) compared with normoxic HeLa cells (16°C ± 1°C) (Fig. 8 B). This is consistent with a change in membrane lipid and/or protein composition, although the chemical nature of this change is unknown. Miscibility transition temperatures were also modulated by low-oxygen conditions in the other cell types investigated, although both the sign and magnitude of this change were cell-type dependent (Fig. 8 C). Taken together, these results indicate that reduced oxygen conditions lead to changes in membrane protein and lipid content, but this does not appear to directly correlate with changes in membrane anchor mobility.
Conclusions
In this work, we used photoswitchable, genetically encoded fluorophores in combination with single fluorophore tracking to probe the mobility of a range of plasma membrane-anchored proteins in intact HeLa cells at 37°C. In the absence of an oxygen-scavenging system in the imaging buffer, all of the investigated proteins exhibited heterogeneous and confined motions. The distributions of single-molecule mobility parameters had similar shapes, suggesting that both heterogeneity and confinement are a consequence of the generic plasma membrane structure and not the detailed structure of the anchors investigated. The absolute rates of diffusion depended on the structure of the membrane anchor, and the values measured here are in agreement with measurements of similar proteins in the literature.
A dramatic diffusion phenotype was observed in HeLa cells when an oxygen-scavenging system was included in the imaging buffer, but not in four other cell lines investigated. In hypoxic HeLa cells, single molecules diffused more quickly and their motion was unconfined, at least at the timescales (20–500 ms) and distance scales (30 nm to 10 μm) probed in this study. Surprisingly, the distributions of single-molecule mobility parameters were well described as a single population of Brownian diffusers, indicating that motion was homogeneous. Hypoxia in HeLa cells leads to cytoskeletal rearrangements and changes in cellular and plasma membrane lipid composition, and it is likely that these changes contribute to increased diffusion rates of plasma membrane proteins. Hypoxia is also linked to increased survival rates of many solid tumors, and it is intriguing to speculate that changes in plasma membrane structure and composition contribute to both the survival and proliferation of HeLa cells under hypoxic conditions. Since many superresolution imaging measurements either require or show improved performance in a low-oxygen environment, to properly interpret the experimental results, it is important to understand the biological and biophysical changes that occur in cells in this experimental condition.
Finally, although it is clear that hypoxic conditions represent a significant biological perturbation of HeLa cells, the greatly simplified single-molecule diffusion profiles may prove beneficial for some biophysical studies of protein mobility. From this study, we conclude that hypoxic HeLa cells represent a state that is intermediate between normoxic cells and isolated or purified membranes. This could prove to be a useful experimental system for exploring the physical basis of differences between the intact cellular environment and free-floating membranes, akin to recent studies that explored how diffusion in model systems is modulated by coupling to a reconstituted cortical actin cytoskeleton (83,84).
Acknowledgments
We thank Akira Ono, David Holowka, Barbara Baird, Roger Sunahara, Richard Lamb, Akira Ono, and Jonathan Grover for supplying constructs; Akira Ono for HeLa cells; Neetu Gupta for CH27 cells; Anne Kenworthy for COS7 cells; and Mukesh Nyati for CHO cells. We thank Benjamin Machta, Akira Ono, Jonathan Grover, Joe Schauerte, and Sarah Shelby for helpful conversations, and Kathleen Wisser and Efrosini Artikis for assistance with some experiments.
This research was supported by grants from the NIH (R00GM87810 and R01GM110052).
Supporting Material
TM mEos 3.2 diffusing laterally in the membrane of an intact cell at 37°C in high-oxygen imaging buffer. Data were acquired at 33.1 frames per second and are displayed in real time.
References
- 1.Gahlmann A., Moerner W.E. Exploring bacterial cell biology with single-molecule tracking and super-resolution imaging. Nat. Rev. Microbiol. 2014;12:9–22. doi: 10.1038/nrmicro3154. [DOI] [PMC free article] [PubMed] [Google Scholar]
- 2.Kusumi A., Shirai Y.M., Fujiwara T.K. Hierarchical organization of the plasma membrane: investigations by single-molecule tracking vs. fluorescence correlation spectroscopy. FEBS Lett. 2010;584:1814–1823. doi: 10.1016/j.febslet.2010.02.047. [DOI] [PubMed] [Google Scholar]
- 3.Levi V., Gratton E. Exploring dynamics in living cells by tracking single particles. Cell Biochem. Biophys. 2007;48:1–15. doi: 10.1007/s12013-007-0010-0. [DOI] [PubMed] [Google Scholar]
- 4.Sahl S.J., Leutenegger M., Eggeling C. Fast molecular tracking maps nanoscale dynamics of plasma membrane lipids. Proc. Natl. Acad. Sci. USA. 2010;107:6829–6834. doi: 10.1073/pnas.0912894107. [DOI] [PMC free article] [PubMed] [Google Scholar]
- 5.Türkcan S., Richly M.U., Masson J.-B. Probing membrane protein interactions with their lipid raft environment using single-molecule tracking and Bayesian inference analysis. PLoS ONE. 2013;8:e53073. doi: 10.1371/journal.pone.0053073. [DOI] [PMC free article] [PubMed] [Google Scholar]
- 6.Betzig E., Patterson G.H., Hess H.F. Imaging intracellular fluorescent proteins at nanometer resolution. Science. 2006;313:1642–1645. doi: 10.1126/science.1127344. [DOI] [PubMed] [Google Scholar]
- 7.Hess S.T., Girirajan T.P., Mason M.D. Ultra-high resolution imaging by fluorescence photoactivation localization microscopy. Biophys. J. 2006;91:4258–4272. doi: 10.1529/biophysj.106.091116. [DOI] [PMC free article] [PubMed] [Google Scholar]
- 8.Rust M.J., Bates M., Zhuang X. Sub-diffraction-limit imaging by stochastic optical reconstruction microscopy (STORM) Nat. Methods. 2006;3:793–795. doi: 10.1038/nmeth929. [DOI] [PMC free article] [PubMed] [Google Scholar]
- 9.Manley S., Gillette J.M., Lippincott-Schwartz J. High-density mapping of single-molecule trajectories with photoactivated localization microscopy. Nat. Methods. 2008;5:155–157. doi: 10.1038/nmeth.1176. [DOI] [PubMed] [Google Scholar]
- 10.Hess S.T., Gould T.J., Zimmerberg J. Dynamic clustered distribution of hemagglutinin resolved at 40 nm in living cell membranes discriminates between raft theories. Proc. Natl. Acad. Sci. USA. 2007;104:17370–17375. doi: 10.1073/pnas.0708066104. [DOI] [PMC free article] [PubMed] [Google Scholar]
- 11.Shelby S.A., Holowka D., Veatch S.L. Distinct stages of stimulated FcεRI receptor clustering and immobilization are identified through superresolution imaging. Biophys. J. 2013;105:2343–2354. doi: 10.1016/j.bpj.2013.09.049. [DOI] [PMC free article] [PubMed] [Google Scholar]
- 12.Qian H., Sheetz M.P., Elson E.L. Single particle tracking. Analysis of diffusion and flow in two-dimensional systems. Biophys. J. 1991;60:910–921. doi: 10.1016/S0006-3495(91)82125-7. [DOI] [PMC free article] [PubMed] [Google Scholar]
- 13.Saxton M.J. Single-particle tracking: the distribution of diffusion coefficients. Biophys. J. 1997;72:1744–1753. doi: 10.1016/S0006-3495(97)78820-9. [DOI] [PMC free article] [PubMed] [Google Scholar]
- 14.Dempsey G.T., Vaughan J.C., Zhuang X. Evaluation of fluorophores for optimal performance in localization-based super-resolution imaging. Nat. Methods. 2011;8:1027–1036. doi: 10.1038/nmeth.1768. [DOI] [PMC free article] [PubMed] [Google Scholar]
- 15.Endesfelder U., Malkusch S., Heilemann M. Chemically induced photoswitching of fluorescent probes—a general concept for super-resolution microscopy. Molecules. 2011;16:3106–3118. doi: 10.3390/molecules16043106. [DOI] [PMC free article] [PubMed] [Google Scholar]
- 16.Heilemann M., Margeat E., Tinnefeld P. Carbocyanine dyes as efficient reversible single-molecule optical switch. J. Am. Chem. Soc. 2005;127:3801–3806. doi: 10.1021/ja044686x. [DOI] [PubMed] [Google Scholar]
- 17.Carreau A., El Hafny-Rahbi B., Kieda C. Why is the partial oxygen pressure of human tissues a crucial parameter? Small molecules and hypoxia. J. Cell. Mol. Med. 2011;15:1239–1253. doi: 10.1111/j.1582-4934.2011.01258.x. [DOI] [PMC free article] [PubMed] [Google Scholar]
- 18.Mohyeldin A., Garzón-Muvdi T., Quiñones-Hinojosa A. Oxygen in stem cell biology: a critical component of the stem cell niche. Cell Stem Cell. 2010;7:150–161. doi: 10.1016/j.stem.2010.07.007. [DOI] [PubMed] [Google Scholar]
- 19.Spencer J.A., Ferraro F., Lin C.P. Direct measurement of local oxygen concentration in the bone marrow of live animals. Nature. 2014;508:269–273. doi: 10.1038/nature13034. [DOI] [PMC free article] [PubMed] [Google Scholar]
- 20.Vaupel P., Mayer A. Hypoxia in cancer: significance and impact on clinical outcome. Cancer Metastasis Rev. 2007;26:225–239. doi: 10.1007/s10555-007-9055-1. [DOI] [PubMed] [Google Scholar]
- 21.Ward P.S., Thompson C.B. Metabolic reprogramming: a cancer hallmark even warburg did not anticipate. Cancer Cell. 2012;21:297–308. doi: 10.1016/j.ccr.2012.02.014. [DOI] [PMC free article] [PubMed] [Google Scholar]
- 22.Aitken C.E., Marshall R.A., Puglisi J.D. An oxygen scavenging system for improvement of dye stability in single-molecule fluorescence experiments. Biophys. J. 2008;94:1826–1835. doi: 10.1529/biophysj.107.117689. [DOI] [PMC free article] [PubMed] [Google Scholar]
- 23.Semenza G.L. Regulation of mammalian O2 homeostasis by hypoxia-inducible factor 1. Annu. Rev. Cell Dev. Biol. 1999;15:551–578. doi: 10.1146/annurev.cellbio.15.1.551. [DOI] [PubMed] [Google Scholar]
- 24.Halliwell B., Cross C.E. Oxygen-derived species: their relation to human disease and environmental stress. Environ. Health Perspect. 1994;102(Suppl 10):5–12. doi: 10.1289/ehp.94102s105. [DOI] [PMC free article] [PubMed] [Google Scholar]
- 25.Zhang M., Chang H., Xu T. Rational design of true monomeric and bright photoactivatable fluorescent proteins. Nat. Methods. 2012;9:727–729. doi: 10.1038/nmeth.2021. [DOI] [PubMed] [Google Scholar]
- 26.Keller P., Toomre D., Simons K. Multicolour imaging of post-Golgi sorting and trafficking in live cells. Nat. Cell Biol. 2001;3:140–149. doi: 10.1038/35055042. [DOI] [PubMed] [Google Scholar]
- 27.Pyenta P.S., Holowka D., Baird B. Cross-correlation analysis of inner-leaflet-anchored green fluorescent protein co-redistributed with IgE receptors and outer leaflet lipid raft components. Biophys. J. 2001;80:2120–2132. doi: 10.1016/S0006-3495(01)76185-1. [DOI] [PMC free article] [PubMed] [Google Scholar]
- 28.Scolari S., Engel S., Herrmann A. Lateral distribution of the transmembrane domain of influenza virus hemagglutinin revealed by time-resolved fluorescence imaging. J. Biol. Chem. 2009;284:15708–15716. doi: 10.1074/jbc.M900437200. [DOI] [PMC free article] [PubMed] [Google Scholar]
- 29.Rasmussen S.G.F., Choi H.-J., Kobilka B.K. Crystal structure of the human β2 adrenergic G-protein-coupled receptor. Nature. 2007;450:383–387. doi: 10.1038/nature06325. [DOI] [PubMed] [Google Scholar]
- 30.Coscoy S., Waharte F., Amblard F. Molecular analysis of microscopic ezrin dynamics by two-photon FRAP. Proc. Natl. Acad. Sci. USA. 2002;99:12813–12818. doi: 10.1073/pnas.192084599. [DOI] [PMC free article] [PubMed] [Google Scholar]
- 31.Várnai P., Balla T. Visualization of phosphoinositides that bind pleckstrin homology domains: calcium- and agonist-induced dynamic changes and relationship to myo-[3H]inositol-labeled phosphoinositide pools. J. Cell Biol. 1998;143:501–510. doi: 10.1083/jcb.143.2.501. [DOI] [PMC free article] [PubMed] [Google Scholar]
- 32.Veatch S.L., Machta B.B., Baird B.A. Correlation functions quantify super-resolution images and estimate apparent clustering due to over-counting. PLoS ONE. 2012;7:e31457. doi: 10.1371/journal.pone.0031457. [DOI] [PMC free article] [PubMed] [Google Scholar]
- 33.Jaqaman K., Loerke D., Danuser G. Robust single-particle tracking in live-cell time-lapse sequences. Nat. Methods. 2008;5:695–702. doi: 10.1038/nmeth.1237. [DOI] [PMC free article] [PubMed] [Google Scholar]
- 34.Wieser S., Schütz G.J. Tracking single molecules in the live cell plasma membrane—do’s and don’t’s. Methods. 2008;46:131–140. doi: 10.1016/j.ymeth.2008.06.010. [DOI] [PubMed] [Google Scholar]
- 35.Scott R.E. Plasma membrane vesiculation: a new technique for isolation of plasma membranes. Science. 1976;194:743–745. doi: 10.1126/science.982044. [DOI] [PubMed] [Google Scholar]
- 36.Baumgart T., Hammond A.T., Webb W.W. Large-scale fluid/fluid phase separation of proteins and lipids in giant plasma membrane vesicles. Proc. Natl. Acad. Sci. USA. 2007;104:3165–3170. doi: 10.1073/pnas.0611357104. [DOI] [PMC free article] [PubMed] [Google Scholar]
- 37.Gray E., Karslake J., Veatch S.L. Liquid general anesthetics lower critical temperatures in plasma membrane vesicles. Biophys. J. 2013;105:2751–2759. doi: 10.1016/j.bpj.2013.11.005. [DOI] [PMC free article] [PubMed] [Google Scholar]
- 38.Grover J.R., Llewellyn G.N., Ono A. Roles played by capsid-dependent induction of membrane curvature and Gag-ESCRT interactions in tetherin recruitment to HIV-1 assembly sites. J. Virol. 2013;87:4650–4664. doi: 10.1128/JVI.03526-12. [DOI] [PMC free article] [PubMed] [Google Scholar]
- 39.Saxton M.J. A biological interpretation of transient anomalous subdiffusion. I. Qualitative model. Biophys. J. 2007;92:1178–1191. doi: 10.1529/biophysj.106.092619. [DOI] [PMC free article] [PubMed] [Google Scholar]
- 40.Saxton M.J., Jacobson K. Single-particle tracking: applications to membrane dynamics. Annu. Rev. Biophys. Biomol. Struct. 1997;26:373–399. doi: 10.1146/annurev.biophys.26.1.373. [DOI] [PubMed] [Google Scholar]
- 41.Kenworthy A.K., Nichols B.J., Lippincott-Schwartz J. Dynamics of putative raft-associated proteins at the cell surface. J. Cell Biol. 2004;165:735–746. doi: 10.1083/jcb.200312170. [DOI] [PMC free article] [PubMed] [Google Scholar]
- 42.Valentine C.D., Haggie P.M. Confinement of β(1)- and β(2)-adrenergic receptors in the plasma membrane of cardiomyocyte-like H9c2 cells is mediated by selective interactions with PDZ domain and A-kinase anchoring proteins but not caveolae. Mol. Biol. Cell. 2011;22:2970–2982. doi: 10.1091/mbc.E11-01-0034. [DOI] [PMC free article] [PubMed] [Google Scholar]
- 43.Lommerse P.H., Vastenhoud K., Schmidt T. Single-molecule diffusion reveals similar mobility for the Lck, H-ras, and K-ras membrane anchors. Biophys. J. 2006;91:1090–1097. doi: 10.1529/biophysj.105.079053. [DOI] [PMC free article] [PubMed] [Google Scholar]
- 44.Pyenta P.S., Schwille P., Baird B. Lateral diffusion of membrane lipid-anchored probes before and after aggregation of cell surface IgE-receptors. J. Phys. Chem. A. 2003;107:8310–8318. [Google Scholar]
- 45.Daumas F., Destainville N., Salomé L. Confined diffusion without fences of a g-protein-coupled receptor as revealed by single particle tracking. Biophys. J. 2003;84:356–366. doi: 10.1016/S0006-3495(03)74856-5. [DOI] [PMC free article] [PubMed] [Google Scholar]
- 46.Dix J.A., Verkman A.S. Crowding effects on diffusion in solutions and cells. Annu Rev Biophys. 2008;37:247–263. doi: 10.1146/annurev.biophys.37.032807.125824. [DOI] [PubMed] [Google Scholar]
- 47.Kusumi A., Suzuki K.G., Fujiwara T.K. Hierarchical mesoscale domain organization of the plasma membrane. Trends Biochem. Sci. 2011;36:604–615. doi: 10.1016/j.tibs.2011.08.001. [DOI] [PubMed] [Google Scholar]
- 48.Saxton M.J. Single-particle tracking: effects of corrals. Biophys. J. 1995;69:389–398. doi: 10.1016/S0006-3495(95)79911-8. [DOI] [PMC free article] [PubMed] [Google Scholar]
- 49.Sechi A.S., Wehland J. The actin cytoskeleton and plasma membrane connection: PtdIns(4,5)P(2) influences cytoskeletal protein activity at the plasma membrane. J. Cell Sci. 2000;113:3685–3695. doi: 10.1242/jcs.113.21.3685. [DOI] [PubMed] [Google Scholar]
- 50.Niv H., Gutman O., Henis Y.I. Activated K-Ras and H-Ras display different interactions with saturable nonraft sites at the surface of live cells. J. Cell Biol. 2002;157:865–872. doi: 10.1083/jcb.200202009. [DOI] [PMC free article] [PubMed] [Google Scholar]
- 51.Nishimura S.Y., Vrljic M., Moerner W.E. Cholesterol depletion induces solid-like regions in the plasma membrane. Biophys. J. 2006;90:927–938. doi: 10.1529/biophysj.105.070524. [DOI] [PMC free article] [PubMed] [Google Scholar]
- 52.Shvartsman D.E., Kotler M., Henis Y.I. Differently anchored influenza hemagglutinin mutants display distinct interaction dynamics with mutual rafts. J. Cell Biol. 2003;163:879–888. doi: 10.1083/jcb.200308142. [DOI] [PMC free article] [PubMed] [Google Scholar]
- 53.Umemura Y.M., Vrljic M., Kusumi A. Both MHC class II and its GPI-anchored form undergo hop diffusion as observed by single-molecule tracking. Biophys. J. 2008;95:435–450. doi: 10.1529/biophysj.107.123018. [DOI] [PMC free article] [PubMed] [Google Scholar]
- 54.Wieser S., Moertelmaier M., Schütz G.J. (Un)confined diffusion of CD59 in the plasma membrane determined by high-resolution single molecule microscopy. Biophys. J. 2007;92:3719–3728. doi: 10.1529/biophysj.106.095398. [DOI] [PMC free article] [PubMed] [Google Scholar]
- 55.Horvat R.D., Nelson S., Roess D.A. Intrinsically fluorescent luteinizing hormone receptor demonstrates hormone-driven aggregation. Biochem. Biophys. Res. Commun. 1999;255:382–385. doi: 10.1006/bbrc.1999.0185. [DOI] [PubMed] [Google Scholar]
- 56.Nelson S., Horvat R.D., Clay C.M. Characterization of an intrinsically fluorescent gonadotropin-releasing hormone receptor and effects of ligand binding on receptor lateral diffusion. Endocrinology. 1999;140:950–957. doi: 10.1210/endo.140.2.6518. [DOI] [PubMed] [Google Scholar]
- 57.Saulière-Nzeh Ndong A., Millot C., Salomé L. Agonist-selective dynamic compartmentalization of human Mu opioid receptor as revealed by resolutive FRAP analysis. J. Biol. Chem. 2010;285:14514–14520. doi: 10.1074/jbc.M109.076695. [DOI] [PMC free article] [PubMed] [Google Scholar]
- 58.Suzuki K., Ritchie K., Kusumi A. Rapid hop diffusion of a G-protein-coupled receptor in the plasma membrane as revealed by single-molecule techniques. Biophys. J. 2005;88:3659–3680. doi: 10.1529/biophysj.104.048538. [DOI] [PMC free article] [PubMed] [Google Scholar]
- 59.Young S.H., Walsh J.H., Slice L.W. Agonist-dependent immobilization of chimeric bombesin/GRP receptors: dependence on c-Src activity and dissociation from internalization. Exp. Cell Res. 2001;267:37–44. doi: 10.1006/excr.2001.5245. [DOI] [PubMed] [Google Scholar]
- 60.Heilemann M., van de Linde S., Sauer M. Subdiffraction-resolution fluorescence imaging with conventional fluorescent probes. Angew. Chem. Int. Ed. Engl. 2008;47:6172–6176. doi: 10.1002/anie.200802376. [DOI] [PubMed] [Google Scholar]
- 61.Paller M.S. Lateral diffusion of lipids in renal cells: effects of hypoxia and reoxygenation and role of cytoskeleton. Am. J. Physiol. 1993;264:C201–C208. doi: 10.1152/ajpcell.1993.264.1.C201. [DOI] [PubMed] [Google Scholar]
- 62.Celedón G., González G., Behn C. Membrane lipid diffusion and band 3 protein changes in human erythrocytes due to acute hypobaric hypoxia. Am. J. Physiol. 1998;275:C1429–C1431. doi: 10.1152/ajpcell.1998.275.6.C1429. [DOI] [PubMed] [Google Scholar]
- 63.Behn C., Araneda O.F., González G. Hypoxia-related lipid peroxidation: evidences, implications and approaches. Respir. Physiol. Neurobiol. 2007;158:143–150. doi: 10.1016/j.resp.2007.06.001. [DOI] [PubMed] [Google Scholar]
- 64.Pore D., Parameswaran N., Gupta N. Ezrin tunes the magnitude of humoral immunity. J. Immunol. 2013;191:4048–4058. doi: 10.4049/jimmunol.1301315. [DOI] [PMC free article] [PubMed] [Google Scholar]
- 65.Day C.A., Kenworthy A.K. Mechanisms underlying the confined diffusion of cholera toxin B-subunit in intact cell membranes. PLoS ONE. 2012;7:e34923. doi: 10.1371/journal.pone.0034923. [DOI] [PMC free article] [PubMed] [Google Scholar]
- 66.Ivan M., Kondo K., Kaelin W.G., Jr. HIFalpha targeted for VHL-mediated destruction by proline hydroxylation: implications for O2 sensing. Science. 2001;292:464–468. doi: 10.1126/science.1059817. [DOI] [PubMed] [Google Scholar]
- 67.Ohh M., Park C.W., Kaelin W.G. Ubiquitination of hypoxia-inducible factor requires direct binding to the β-domain of the von Hippel-Lindau protein. Nat. Cell Biol. 2000;2:423–427. doi: 10.1038/35017054. [DOI] [PubMed] [Google Scholar]
- 68.Giaccia A.J., Simon M.C., Johnson R. The biology of hypoxia: the role of oxygen sensing in development, normal function, and disease. Genes Dev. 2004;18:2183–2194. doi: 10.1101/gad.1243304. [DOI] [PMC free article] [PubMed] [Google Scholar]
- 69.Hoogsteen I.J., Marres H.A.M., Kaanders J.H.A.M. Expression of EGFR under tumor hypoxia: identification of a subpopulation of tumor cells responsible for aggressiveness and treatment resistance. Int. J. Radiat. Oncol. Biol. Phys. 2012;84:807–814. doi: 10.1016/j.ijrobp.2012.01.002. [DOI] [PubMed] [Google Scholar]
- 70.Liu L.-B., Xie F., Yu J.-J. Hypoxia promotes the proliferation of cervical carcinoma cells through stimulating the secretion of IL-8. Int. J. Clin. Exp. Pathol. 2014;7:575–583. [PMC free article] [PubMed] [Google Scholar]
- 71.Heng Y.-W., Koh C.-G. Actin cytoskeleton dynamics and the cell division cycle. Int. J. Biochem. Cell Biol. 2010;42:1622–1633. doi: 10.1016/j.biocel.2010.04.007. [DOI] [PubMed] [Google Scholar]
- 72.Lenne P.-F., Wawrezinieck L., Marguet D. Dynamic molecular confinement in the plasma membrane by microdomains and the cytoskeleton meshwork. EMBO J. 2006;25:3245–3256. doi: 10.1038/sj.emboj.7601214. [DOI] [PMC free article] [PubMed] [Google Scholar]
- 73.Kusumi A., Nakada C., Fujiwara T. Paradigm shift of the plasma membrane concept from the two-dimensional continuum fluid to the partitioned fluid: high-speed single-molecule tracking of membrane molecules. Annu. Rev. Biophys. Biomol. Struct. 2005;34:351–378. doi: 10.1146/annurev.biophys.34.040204.144637. [DOI] [PubMed] [Google Scholar]
- 74.Adler J., Shevchuk A.I., Parmryd I. Plasma membrane topography and interpretation of single-particle tracks. Nat. Methods. 2010;7:170–171. doi: 10.1038/nmeth0310-170. [DOI] [PubMed] [Google Scholar]
- 75.Tserkovnyak Y., Nelson D.R. Conditions for extreme sensitivity of protein diffusion in membranes to cell environments. Proc. Natl. Acad. Sci. USA. 2006;103:15002–15007. doi: 10.1073/pnas.0606992103. [DOI] [PMC free article] [PubMed] [Google Scholar]
- 76.Machta B.B., Papanikolaou S., Veatch S.L. Minimal model of plasma membrane heterogeneity requires coupling cortical actin to criticality. Biophys. J. 2011;100:1668–1677. doi: 10.1016/j.bpj.2011.02.029. [DOI] [PMC free article] [PubMed] [Google Scholar]
- 77.Andrews N.L., Lidke K.A., Lidke D.S. Actin restricts FcepsilonRI diffusion and facilitates antigen-induced receptor immobilization. Nat. Cell Biol. 2008;10:955–963. doi: 10.1038/ncb1755. [DOI] [PMC free article] [PubMed] [Google Scholar]
- 78.Gudheti M.V., Curthoys N.M., Hess S.T. Actin mediates the nanoscale membrane organization of the clustered membrane protein influenza hemagglutinin. Biophys. J. 2013;104:2182–2192. doi: 10.1016/j.bpj.2013.03.054. [DOI] [PMC free article] [PubMed] [Google Scholar]
- 79.Yu Y., Vidalino L., Guella G. A lipidomics investigation of the induced hypoxia stress on HeLa cells by using MS and NMR techniques. Mol. Biosyst. 2014;10:878–890. doi: 10.1039/c3mb70540d. [DOI] [PubMed] [Google Scholar]
- 80.Janmey P.A., Lindberg U. Cytoskeletal regulation: rich in lipids. Nat. Rev. Mol. Cell Biol. 2004;5:658–666. doi: 10.1038/nrm1434. [DOI] [PubMed] [Google Scholar]
- 81.Keller H., Lorizate M., Schwille P. PI(4,5)P2 degradation promotes the formation of cytoskeleton-free model membrane systems. ChemPhysChem. 2009;10:2805–2812. doi: 10.1002/cphc.200900598. [DOI] [PubMed] [Google Scholar]
- 82.De Groot H., Noll T. The role of physiological oxygen partial pressures in lipid peroxidation. Theoretical considerations and experimental evidence. Chem. Phys. Lipids. 1987;44:209–226. doi: 10.1016/0009-3084(87)90051-x. [DOI] [PubMed] [Google Scholar]
- 83.Heinemann F., Vogel S.K., Schwille P. Lateral membrane diffusion modulated by a minimal actin cortex. Biophys. J. 2013;104:1465–1475. doi: 10.1016/j.bpj.2013.02.042. [DOI] [PMC free article] [PubMed] [Google Scholar]
- 84.Honigmann A., Sadeghi S., Vink R. A lipid bound actin meshwork organizes liquid phase separation in model membranes. eLife. 2014;3:e01671. doi: 10.7554/eLife.01671. [DOI] [PMC free article] [PubMed] [Google Scholar]
Associated Data
This section collects any data citations, data availability statements, or supplementary materials included in this article.
Supplementary Materials
TM mEos 3.2 diffusing laterally in the membrane of an intact cell at 37°C in high-oxygen imaging buffer. Data were acquired at 33.1 frames per second and are displayed in real time.