

Abstract
Soft x-ray tomography (SXT) is increasingly being recognized as a valuable method for visualizing and quantifying the ultrastructure of cryopreserved cells. Here, we describe the combination of SXT with cryogenic confocal fluorescence tomography (CFT). This correlative approach allows the incorporation of molecular localization data, with isotropic precision, into high-resolution three-dimensional (3-D) SXT reconstructions of the cell. CFT data are acquired first using a cryogenically adapted confocal light microscope in which the specimen is coupled to a high numerical aperture objective lens by an immersion fluid. The specimen is then cryo-transferred to a soft x-ray microscope (SXM) for SXT data acquisition. Fiducial markers visible in both types of data act as common landmarks, enabling accurate coalignment of the two complementary tomographic reconstructions. We used this method to identify the inactive X chromosome (Xi) in female v-abl transformed thymic lymphoma cells by localizing enhanced green fluorescent protein-labeled macroH2A with CFT. The molecular localization data were used to guide segmentation of Xi in the SXT reconstructions, allowing characterization of the Xi topological arrangement in near-native state cells. Xi was seen to adopt a number of different topologies with no particular arrangement being dominant.
Introduction
Correlated imaging is a very effective method for interrogating cell function. Each modality contributes unique information and perspectives on the specimen. Consequently, the combination of complementary data paints a richer picture of the specimen than is possible using an individual imaging technique (1–3). Although much progress has been made in correlative light and electron microscopies, there remains a need for new correlative methods where cell structure is visualized by an alternative contrast mechanism to that produced by electrons (4–8). Soft x-ray tomography (SXT) is now an established technique for imaging cells and the subcellular architecture. Because soft x-rays are more deeply penetrating than electrons, SXT can image intact, fully hydrated cells, including eukaryotic cells up to 15 μm thick (9). Image contrast in SXT is generated by the differential attenuation of specimen illumination by the cell contents. Typically, cells are imaged using illuminating photons at energies within the water window (284–543 eV) (10). In this regime water is an order of magnitude less absorbing than biomolecules. Attenuation follows the Beer-Lambert law; i.e., is a function of chemical species and thickness and is, therefore, linear and quantitative (11). Subcellular structures with a high density of biomolecules, such as membranes and lipid bodies, attenuate the illumination more strongly than regions with high water content, for example, vacuoles (12–14). As a result, SXT reconstructions of cells have excellent signal/noise and high contrast. However, as with electron tomography, SXT reconstructions do not provide direct access to molecular localization information (6,15–17). Molecules must be localized either by tagging them with highly absorbing, electron dense labels and viewing these directly in the SXT reconstruction or by correlation of SXT data with information from another imaging modality, in particular fluorescence. The latter is the preferred option because this does not require the specimen be exposed to chemical processing, and therefore visualizes specimens that closely represent the in vivo state (18,19).
Correlating tomographic fluorescence data with SXT required a number of technical and methodological developments. Most significantly, maintaining concordance in the spatial organization of the specimen in data acquired using two modalities requires that cells be cryopreserved before imaging and throughout data acquisition. In most correlative studies using cryogenic specimens, the fluorescent imaging component is carried out using microscopes equipped with low numerical aperture air lenses (15,16,18,20). In such instruments, the mismatch in refractive indices between air and the specimen degrades both the maximum spatial resolution and fidelity of the image. To overcome this handicap we developed a novel, to our knowledge, cryogenic confocal microscope (CCM) where the specimen, mounted in a thin-walled glass capillary to allow full-rotation tomography, is immersed in a cryogenic liquid (typically propane), shown in Fig. S1 in the Supporting Material (21). Coupling the specimen and the lenses with an immersion liquid permits use of high-numerical aperture objective lenses (N.A. 1.3), thus eliminating changes in refractive index as light traverses boundaries between air and the specimen (6,22–24).
The CCM was fitted with a custom-built cryo-rotation stage to enable tomographic data collection (i.e., cryogenic fluorescence tomography, or CFT). To ensure full compatibility the CCM and SXM have near-identical specimen rotation stages. In both instruments, the specimen is imaged in the glass capillary. Once imaged by CFT, cryopreserved specimens are transferred to the transmission SXM for acquisition of SXT data. A final challenge was optimizing fiducials that could be visualized using both modalities, because this gives rise to common landscape marks in both data, which in turn allows for accurate and efficient coalignment of the two types of data (6,20,25). Once co-aligned, CFT-SXT correlative reconstructions produce a unified view that localizes fluorescent molecules directly in the context of the cell. The general scheme of this work is described in Fig. 1, A–E. BODIPY (4,4-Difluoro-1,3,5,7,8-Pentamethyl-4-Bora-3a,4a-Diaza-s-Indacene) stained organelles were used as a test-bed for the method (shown in Fig. 2). To illustrate the practical use of CFT-SXT, we visualized the topological arrangement of the inactive X-chromosome (Xi). Previously, obtaining this type of information was difficult, if not impossible, due to inherent limitations in available microscopies (26).
Figure 1.
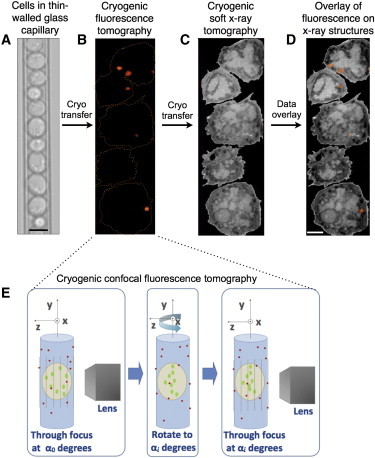
Workflow used to image a specimen by correlated CFT-SXT. (A) Cells in their growth media are transferred into a thin-walled (200 nm) glass capillary and rapidly vitrified by high-speed immersion into liquid propane. (B) The capillary is cryo-transferred into the high numerical aperture cryogenic spinning disk microscope, and through-focus fluorescence tomographic data acquired (referred to as CFT throughout the text). The fluorescence signal is then reconstructed in 3-D by aligning and summing the through-focus data sets and then deconvolving the resultant 3-D volume using a PSF appropriate for tomographic imaging in a capillary. (C) Once CFT data has been collected the specimen capillary is cryogenically transferred to the soft x-ray microscope for collection of SXT data. Cells are reconstructed in 3-D using standard tomographic algorithms. (D) The CFT and SXT reconstructions are coaligned using fiducial markers visible in both modalities; this permits overlay of the 3-D fluorescence signal on structures in the 3-D SXT reconstruction. (E) The method used to collect CFT data: A series of through-focus data sets are collected with the capillary at a given orientation relative to the rotation axis (y axis). The capillary is rotated to a new position, and another through-focus data set collected. This process is repeated until a full tomographic series has been collected (i.e., a through-focus data set is collected every 10° over a total rotation of 360°). Key: light blue, glass capillary; beige, cell; green, fluorescent protein labels; red, fiducial markers on the external surface of the specimen capillary.
Figure 2.
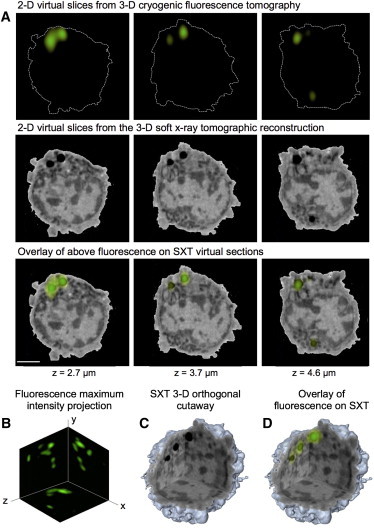
Correlated CFT-SXT of BODIPY (4,4-difluoro-4-bora-3a,4a-diaza-s-indacene) labeled neutral lipids in a mouse v-abl transformed thymic lymphoma cell. Neutral lipids have characteristic LAC values between 0.61 and 1.2 μm−1 (significantly higher than any other subcellular feature). Two droplets are visible in virtual slices through the SXT reconstruction of this cell. (A) 2-D virtual slices from 3-D reconstructions taken at 2.7, 3.7, and 4.6 μm deep into the cell: top panel, CFT; middle panel, SXT; bottom panel, combined CFT-SXT reconstruction. (B) Maximum intensity distribution of macroH2A-EGFP throughout the nucleus projected onto three orthogonal planes. (C) Cutaway view of a volume rendering of the reconstructed 3-D SXT data. (D) Volume rendering of the CFT data overlaid on the SXT volume rendered data shown in C.
Somatic female mammalian cells typically contain two X chromosomes, one of which—the Xi—is transcriptionally silenced (27). In human amniotic cells, Xi and the active X chromosome (Xa) were observed to occupy similar volumes, but have a different shape and surface area (28), suggesting the spatial arrangement is similar in both. Xi is distinguishable from the transcriptionally Xa by the presence of extensive epigenetic modifications (29). How these epigenetic features interplay with higher order forms of organization, such as chromosome topology, to maintain the X chromosome silencing is not understood (30).
Xi appears as a dense nuclear territory called the Barr body in stained female nuclei (31). Since its discovery in 1949, the Barr body has been studied extensively using various microscopic approaches (30,32–35). Unfortunately, limitations in available imaging modalities have made it difficult to obtain reliable information on the physical characteristics of Xi in nucleo (26,36,37). Transmission electron microscopy (TEM) is, of course, ideally suited to visualizing ultrastructure information. However, using TEM to image chromatin presents a number of technical challenges (36). First, the nucleus must be sectioned or otherwise debulked because eukaryotic nuclei are too thick to be imaged intact using electrons (38). Second, the lack of inherent contrast upon interaction of electrons with nuclear structures requires the use of nonspecific stains or procedures such as immunogold labeling, which is often preceded by detergent extraction of the nucleoplasm (19). Because chromatin is known to be very sensitive to even small changes in buffer, the procedures carried out before TEM imaging potentially cause significant changes in chromatin ultrastructure (30). Moreover, when a molecule or organelle is imaged by virtue of a bound exogenous label—as is the case with most TEM images of chromatin—the measured concentrations are a function of the propensity for binding the label, rather than being a quantitative measure of some cellular characteristic or feature (2). As a result, there has been a long-standing need for new imaging modalities that can both quantitatively visualize chromatin structure and determine the location of specific components of the transcriptional machinery, and do so without perturbing the delicate architecture of the nucleus (26). Here, we report the use of correlated CFT-SXT to visualize and characterize Xi in the nuclei of intact, unstained near-native state cells.
Materials and Methods
BODIPY labeling of lipid bodies
Performed according to the manufacturer’s protocol: 5 × 10⁶ cells were pelleted by centrifugation at 300 rcf × 5 min and then resuspended for 10 min at room temperature in 10 μM BODIPY (4,4-Difluoro-1,3,5,7,8-Pentamethyl-4-Bora-3a,4a-Diaza-s-Indacene) (BODIPY 493/503), catalog # D-3922, Invitrogen, Grand Island, NY) in Hanks Buffered Saline Solution (catalog # 14025, GIBCO/Invitrogen, Life Technologies, Carlsbad, CA). Unbound dye was rinsed by pelleting the cells and then resuspending them in Leibovitz’s (L-15) Media (Leibovitz’s +Glutamine, -Phenol Red, Gibco by Life Technologies, Invitrogen).
Generation and preparation of macroH2A-GFP cells
Female v-abl transformed thymic lymphoma cells were electroporated (Neon electroporator, Invitrogen) with a macroH2A-enhanced green fluorescent protein (EGFP) construct (39). Transfected cells were initially selected with Blasticidin and then further selected for the presence of EGFP using fluorescence activated cell sorting (FACSAria Cell Sorter, BD Biosciences, Franklin Lakes, NJ).
Specimen capillaries
Thin-walled glass capillaries were pulled and assembled as described previously (40). Cells loaded in a capillary are shown in Fig. 1 A. Before being loaded, specimen capillaries were dipped in poly-L-lysine (0.01% solution, Tissue Culture Grade, Sigma Aldrich, St. Louis, MO) and then immediately dipped in a solution of 100 nm gold nanoparticles (EMGC100, BBI International, Cardiff, CF14 5DX, UK), which were subsequently used as fiducial markers to align the x-ray projections.
Adding fluorescence fiducial markers to specimen capillaries
Specimen capillaries were also dipped in a solution of red polystyrene microspheres (FluoSpheres Carboxylate-Modified Microspheres, 0.2 μm, Dark Red Fluorescent (660 excitation/ 680 emission), Life Technologies, Invitrogen), which served as fluorescence fiducials.
Cell mounting and cryopreservation
Cells were pelleted to a high titer and loaded into specimen capillaries using a standard micropipette (40). Immediately after being mounted in capillaries, cells were rapidly frozen by fast plunging in ∼−165°C liquid propane using a custom fast-freezing apparatus. Frozen specimens were cryo-transferred into custom boxes using a home-built cryo-transfer device and stored in liquid nitrogen.
Cryogenic confocal light microscopy
We performed this work using a home-built cryogenic spinning disk confocal fluorescence microscope, shown in Fig. S1. Confocal scanning and detection were achieved using a commercial dual spinning disk head (CSU-X1, Yokogawa, Tokyo, Japan). Lasers at 491 nm (PSF, BODIPY, and macroH2A-EGFP), 561 nm (MitoTracker), or 633 nm (fluorescence and joint fiducials) were controlled with an acousto-optical tunable filter using an integrated system (Andor Laser Combiner, model LC-501A).
Experimental measurement of the CCM point spread function (PSF)
Green fluorescent polystyrene microspheres (FluoSpheres Carboxylate-Modified Microspheres, 0.2 μm, Yellow-Green Fluorescent (505 excitation/ 515 emission), Life Technologies, Invitrogen) were used to experimentally determine the PSF for imaging within a specimen capillary with the spinning disk confocal fluorescence cryo-microscope. A microsphere solution was pipetted into a specimen capillary before being cryopreserved; through-focus data sets were then collected as described. Twenty individual PSFs were selected from the data set, resampled into smaller voxels, aligned, and averaged using the Amira software package (Amira Microscopy Option 5.3, FEI, Houston, TX).
Acquisition of CFT data
Cells in capillary tubes were cryo-transferred to the CCM and aligned with respect to the rotation axis. Through-focus, or z-stacks were taken while the capillary was incrementally displaced in z (Driver: model E-501.00, PI, Auburn, MA; Linear stage: Phera 201, Physik Instrumente, Karlsruhe, Germany) using a step size of 0.78 μm. A long-pass mirror (T660LPXR, Chroma Technology, Bellows Falls, VT) split the fluorescence into deep red and green-orange channels. Each channel was imaged using separate electron-multiplying charge-coupled devices (iXon models DV887ECS-BV and DU897E-CSO-#BV-500, Andor Technologies, Belfast, UK) using standard bandpass emission filters (HQ525/50 and HQ700/75 from Chroma Technology) Each electron-multiplying charge-coupled device has 512 × 512 pixels and each pixel is 16 μm × 16 μm. The magnification of the microscope is ∼65×, corresponding to 0.24 μm × 0.24 μm pixels at the specimen. For fluorescence tomography the capillary was rotated about an axis normal to the objective lens using a motorized goniometer driven by custom LabView code (National Instruments, Austin, TX). Each tomographic data series consisted of 37 through-focus stacks (0° through 360° with 10° increments). Once CCM measurements were completed the capillary was cryo-transferred back to liquid nitrogen storage using the cryo-transfer device. A through-focus stack of a flat specimen containing small microspheres visible in both channels (TetraSpeck microspheres, 0.5μm, fluorescent blue/green/orange/dark red, Life Technologies, Invitrogen) was then used to determine the transformation between the red (fiducial) and green-orange (specimen) channels.
Fluorescence preprocessing: photobleaching correction
Acquisition of a fluorescence tomographic data set requires a total of 2000 images of the specimen. Though photobleaching at low temperature is suppressed from that experienced at room temperature (21,41), there is still a gradual loss in fluorescence intensity during image acquisition. The extent of photobleaching that occurred throughout the fluorescence data collection was measured by comparing the first and last through-focus data sets. The fractional loss of fluorescence intensity (Ifinal-Iinitial)/Iinitial, was measured to be 0.17 (BODIPY), and 0.15 (macroH2A-GFP). We applied a linear bleaching correction to each through-focus stack for photobleaching. Inclusion of a photobleaching correction reduced anisotropy in the fluorescence tomographic reconstructions.
Fluorescence preprocessing: through-focus correction, z-drop correction, and voxel resampling
Fluorescence through-focus stacks were cropped in x,y to only include the flat field of view (40 μm × 40 μm). Images were high-pass filtered and the fiducials identified by intensity thresholding. The centroid of each approximately Gaussian intensity distribution was calculated to give its x,y coordinate in each slice of the z-stack. Lists of fiducial coordinates were connected into trajectories using a tracking function (42). The function begins with the list of coordinates in the first image in the stack (z = 0) and then considers all possible identifications of the positions in the subsequent stack (z = 1). It chooses identifications for the fiducials that minimize the total squared displacement of all fiducials. For well-isolated fiducials located on a rigid body undergoing slight x,y displacements, identification of the fiducial coordinates into trajectories is facile. The fiducial trajectories were used to generate histograms of the fiducials’ x,y displacements during each z-step of the through-focus data set. These histograms revealed that typical displacements were 120 nm (x) and 60 nm (y) for each 1 um step in z. The mean x and y displacements for all fiducials in all through-focus images were used as correction factors. MATLAB (The MathWorks, Natick, MA) scripts used bicubic interpolation to generate stacks that corrected for this off-axis movement and also resampled in z to make stacks with equal-length voxels. Through-focus stacks were further processed to correct for the drop in fluorescence excitation/collection that occurs along z (the z drop) when imaging inside a capillary tube. Small, 200 nm polystyrene microspheres with very low <5% coefficient of variation (FluoSpheres Carboxylate-Modified Microspheres, 0.2 μm, Yellow-Green Fluorescent (505 excitation/515 emission), Life Technologies/Molecular Probes, Grand Island, NY) were used to estimate the z-drop in a tube with the same nominal diameter as the specimen. Visual inspection of corrected stacks showed that the z-drop could be corrected to ±10% using an exponential decay, I = I0e−kz, with k = 0.04 μm−1 decay constant as a correction factor.
Alignment of through-focus stacks using fluorescence fiducials
Well-isolated fluorescent fiducials were chosen manually from the raw fluorescence stacks and a 3-D centroid algorithm refined the bead position to subpixel accuracy (Amira). The fiducial coordinates were used to write a new image stack (MATLAB) containing a spherically symmetrical representation of the fiducials, which we termed the fiducial model. The highest intensity values in the fiducial model correspond to the position of the center; surrounding voxels’ intensity values fall off as a function of distance from the center. The voxel dimensions of the fiducial models were first sampled to match the preprocessed data set (0.244 μm × 0.244 μm × 0.244 μm) and then reduced stepwise until the errors in aligning the data sets plateaued (measured by the distances between fiducial centers), which occurred using fiducial models with 80 nm × 80 nm × 80 nm voxels. The goniometer on the cryo-light microscope rotated the tube with ±1° accuracy, which allowed manual alignment between the two data sets, such that there was partial overlap between corresponding fiducial models. From this initial condition, we used an iterative optimization function with correlation between the fiducial models as the metric to further optimize the alignment using the software package Amira. Six parameters were optimized for each alignment: three translations and three rotations (a rigid affine transformation). By limiting the search space to optimize correspondence between bead pairs that had been visually verified to be true fiducial correspondences, this alignment strategy was relatively fast and robust. The entire fluorescence fiducial alignment optimization process was visualized in Amira. Visualization was helpful for inspecting the results and troubleshooting rare cases where the optimization settled into a local maximum that was obviously not the real solution.
Fluorescence reconstruction and deconvolution
Preprocessed, aligned through-focus stacks were reconstructed into a single object by simply summing the through-focus datasets (Amira). The effective PSF for tomographic imaging in a specimen capillary was used as the convolution kernel to deconvolve the fluorescence reconstruction. We used an iterative function (Amira) for the deconvolution. The algorithm found the fluorophore distribution that was most likely, assuming the PSF was spatially invariant, and that image formation followed Poisson statistics, see Fig. S2.
Soft x-ray microscopy data collection and reconstruction
SXT was collected using the National Center for X-ray Tomography soft x-ray microscope XM-2 located at the Advanced Light Source in Berkeley and reconstructed according to previously published protocols (40,43).
Soft x-ray LAC values and segmenting SXT reconstructions
Segmentation is the process of computationally isolating, visualizing, and quantifying specific cellular components in a tomographic reconstruction. Each voxel in an SXT reconstruction is a direct measurement of the x-ray linear absorption coefficient (LAC) at the corresponding location in the cell. Because biological materials attenuate soft x-ray photons according to Beer’s Law, the LAC values for identical sized voxels depends solely on the concentration and composition of biomolecules present, with water having an order of magnitude lower LAC than molecules such as lipids and proteins. LAC values for homogeneous solutions of isolated biomolecules can also be calculated using tables of known absorption coefficients. For example, pure water in the form of ice has a calculated LAC of 0.109 μm−1, whereas a model protein with the chemical composition C94H139N24O31S was calculated to have a theoretical LAC of 1.35μm−1 (11). In practice, most of the voxels in a 50 nm resolution SXT reconstruction of a cell will contain a heterogeneous mixture of biomolecules. Using SXT data acquired at a single wavelength it is not possible to distinguish the precise chemical species present. However, at this level of spatial resolution organelles and other subcellular structures are sufficiently similar in their biochemical composition to allow them to be readily identified from the surrounding cell contents. The relatively high water content in vacuoles makes them readily distinguishable from organelles with a greater density of biomolecules, for example, nuclei and mitochondria. Even relatively small variations in organelle LAC can be distinguished, for example, the boundaries between nuclei and nucleoli are very clear, as is the distinction between euchromatin and heterochromatin domains in the nucleus. LACs were calculated and cells segmented using the protocols describe in complete detail in (40).
Alignment of through-focus fluorescence stacks to the SXT reconstruction using joint fiducials
Joint fiducials, or fluorescent microspheres visible in both light- and soft x-ray images (0.5 μm deep red carboxylated microspheres, Phosphorex, Hopkinton, MA) guided CFT data overlay with the soft x-ray reconstruction. The alignment process was optimized by converting the raw fluorescence into a bead model, and aligning the fluorescent bead model to the x-ray reconstruction of the beads using an iterative optimization of the overlay.
Results and Discussion
Validating CFT-SXT methodology
To confirm the accuracy of our dual tomographic approach we first imaged BODIPY-stained lipid bodies in female lymphoma cells (Fig. 2 A). Lipid bodies are carbon-dense organelles that attenuate soft x-rays more strongly than any other subcellular component, and can, therefore, be identified unambiguously in an SXT reconstruction (Fig. 2 A). As can be seen from (Fig. 2, A–D), the location of lipid bodies in the SXT reconstruction correlates very well with the overlaid 3-D tomographic reconstruction of the fluorescence signal.
Localization of Xi using CFT-SXT
Xi was identified by first collecting CFT data to localize EGFP-labeled histone variant macro-H2A in intact female mouse v-abl transformed thymic lymphoma cells (see Fig. 3, A and D). The histone variant macro-H2A is enriched in the inactive X chromosome (44–47), and therefore can act as a high confidence marker for Xi in vivo. After imaging by CFT, the same specimens were visualized using SXT (see Fig. 3, B and E). The two 3-D tomographic data sets were coaligned and overlaid (see Fig. 3, C and F). Using the CFT signal for guidance, Xi was segmented from the other nuclear contents based on LAC (Fig. 3 G). LAC values are a direct measure of the attenuation of soft x-rays as they traverse the specimen (40,43). The LAC value at each voxel in an SXT reconstruction is a direct reflection of biomolecule density; high LAC values correspond to high density of biomolecules.
Figure 3.

Correlated CFT-SXT imaging of female v-abl macroH2A-EGFP transformed thymic lymphoma cells. (A) Four virtual sections from the deconvolved CFT reconstruction. (B) The corresponding virtual sections from the SXT reconstruction. White arrow shows the closest contact between Xi and the nucleolus. (C) The same sections in the combined CFT-SXT reconstruction. (D) A 2-D projection of the Xi CFT reconstruction. (E) Cutaway of a volume rendered SXT reconstruction. The surface of the cell is colored light blue. LAC values are represented in gray scale, ranging from high (dark) to low (light). (F) The CFT reconstruction shown in (D) overlaid into the volume rendered SXT reconstruction shown in (E). (G) Surface rendering of the inactive X chromosome segmented from the SXT reconstruction after identification by macroH2A-EGFP CFT. The deep blue shaded areas are regions of high LAC that contact the nuclear envelope.
Characterizing Xi topological arrangement
Fig. S3 shows the distribution of LAC values for the entire chromatin component of the nucleus. Heterochromatin typically has LAC values in the range 0.25–0.36 μm−1, whereas the remainder of the nucleus has much lower LAC values, ranging from 0.13 to 0.25 μm−1. The topological organization of Xi was seen to vary from cell to cell, with no single arrangement being prevalent among the specimens imaged (Xi segmented from eight different, randomly chosen cells are shown in Fig S4). Segmented Xi from the cell shown in Fig. 3 is presented in greater detail in Fig. 4. In this example, Xi has assumed a bilobal configuration and had a total volume of 5.2 μm3. The hinge region between lobes has high LAC values (0.34–0.36 μm-1), as do the regions that make direct contact with the nuclear envelope (surface area of 0.28 μm2). This is at the very upper limit of the LAC values measured for heterochromatin. Xi makes very minimal contact with the nucleolus (closest points of contact shown by arrowhead in Fig. 3). Fig. 5 depicts Xi in a different nuclear conformation. In this cell, Xi has a volume of 3.9 μm3 and makes considerably more contact with both the nuclear envelope (NE) and the nucleolus (Nu) (see Fig. 5 B). The overall topology of Xi resembles a hook with a thick base that comes into extended contact with the NE (2.43 μm2). Analysis of Xi LAC values reveals a more homogeneous distribution, with the highest LAC values being in the NE contact region. The Xi region in contact with the Nu has lower LAC values, suggesting lower condensation of chromatin.
Figure 4.

Detailed analysis of LAC values measured from the SXT Xi reconstruction shown in Fig. 3. Representation of soft x-ray LAC values for Xi segmented from the SXT reconstruction, shown from two perspectives 180° apart. LAC values are categorized as high (0.34–0.36 μm-1), medium (0.32–0.34 μm-1), or low (0.30–0.32 μm-1). From left to right the pairs show combinations of the high, medium, and low LAC values measured in the reconstruction. LAC color code: high, dark blue; medium, light blue; low, gold. Right-most segmentations show all LAC values combined, together with a section of NE that makes contact with Xi (indicated by dashed ovals).
Figure 5.
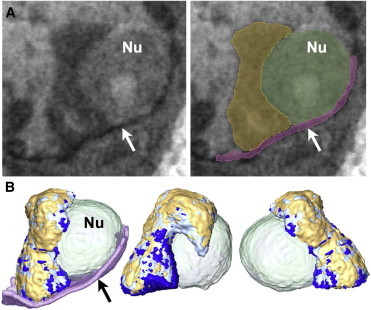
LAC analysis of segmented Xi from two different cells. (A) Left figure: A virtual section through the SXT reconstruction in the region of nucleus identified as Xi by the overlay of the CFT signal. Right figure: Representation of segmentation boundaries. Key: Xi, yellow; nucleolus (Nu), green; nuclear envelope (NE, arrow), purple. (B) Three different views of the segmented Xi, Nu, and NE based on data shown in (A); Xi is color coded according to ranges of measured LAC values.
Cryogenic fluorescence microscopy is a valuable new addition to the fluorescence imaging toolbox and well positioned to make a considerable contribution to the field of molecular localization, both in the context of correlative imaging and as a standalone technique (15). The availability of cryogenic immersion lenses represents a significant evolution of the technique over cryogenic light microscopy using air lenses (15,21). Collecting fluorescence data from a number of different perspectives—i.e., a tilt or rotation series—allows calculation of 3-D tomographic reconstructions of the signal. Here, we demonstrated the improvement in the effective PSF of the CCM, especially in terms of the precision of localization in the z direction, brought about by taking a tomographic approach to data acquisition and analysis, particularly when fluorescence data are collected at different foci and deconvolved, shown in Fig. S2. In CFT, the specimen is highly sampled both from different rotation angles and focal positions. This degree of sampling overcomes anisotropic spatial resolution, a common issue in fluorescence-based protein localization (48).
Correlated CFT-SXT can be applied to a wide spectrum of cellular imaging tasks and fully intact eukaryotic cells. Currently, the maximum spatial resolution of the CCM is limited by mechanical and optical shortcomings of the microscope, and not a fundamental limitation of the technique. Consequently, the next generation instrument—with improved stability and optical features—is currently under construction. Experience with the current CCM is guiding the design of a lens optimized for operation at low temperature. As a result, this new, to our knowledge, microscope will be capable of tomographic imaging at a spatial resolution beyond the diffraction limit. Recent work by Kaufmann and colleagues showed that standard fluorescent labels are amenable to super-resolution cryogenic imaging (15). Even a low numerical aperture microscope can show three- to fivefold increase in localization precision if operated at cryogenic temperatures. Combining these two highly complementary techniques—CFT and SXT—enables localizing molecules directly in the context of quantitative, 3-D reconstructions of cells. Cells are imaged in the near-native state, without the need to use contrast-enhancing agents, or other potentially damaging procedures such as dehydration, chemical fixation, or sectioning. Specimens are simply cryopreserved to retain the native organization, and mitigate molecular movements and photon-induced damage during imaging. At the current resolution limits, freezing damage is not apparent in images; however, at significantly higher spatial resolutions it may become necessary to use more sophisticated cryopreservation methods, for example, high-pressure freezing, to retain the in vivo organization of finer structural details. Using this correlated approach, we explored the topological arrangement of Xi and discovered wide variation in the LAC profile adopted by the chromosome. Although X-chromosome inactivation (XCI) relies on the 3-D organization of the X chromosome during the initial stages of the inactivation, there is no such dependency for maintaining transcriptional silencing in Xi. We found XCI is not associated with a specific spatial organization of the nucleus, or distinct patterns of chromosome LAC values. Rather, the global organization of Xi was seen to be unique to each cell imaged.
Conclusions
Correlated CFT-SXT is an excellent new, to our knowledge, method for linking molecular events with cell ultrastructure. In particular, linking the structural phenotype of the cell with the abundance and location of particular molecules can effectively address questions such as “Where in the cell is a specific molecule sequestered?” or “What are the consequences of experimental manipulations on sub-cellular organization”? In correlated CFT-SXT the specimen is imaged free from potential artifacts due to the use of contrast enhancing agents, dehydration, chemical fixation, and/or sectioning. The contrast mechanisms in CFT and SXT are highly complementary, with each being suited to providing an important class of information, namely the location of labeled molecules (CFT), and visualizing and quantifying subcellular structures (SXT).
The results characterizing Xi are a first step in a broader imaging study aimed at understanding XCI. In future work correlated CFT-SXT will be used to follow the topological arrangement of Xi from the early stages of initiation, and establish if chromosome LAC profiles are a function of chromosome-wide transcriptional silencing. This information is of fundamental importance in basic cell biology and has potential application in the development of therapies for X-linked diseases.
Acknowledgments
The National Center for X-ray Tomography is supported by the National Institute of General Medical Sciences of the National Institutes of Health (P41GM103445) and the U.S. Department of Energy, Office of Biological and Environmental Research (DE-AC02-05CH11231). C.A.L., M.A.L., and E.A.S. are supported by the Gordon and Betty Moore Foundation (3497); B.P. is supported by the National Institute of General Medical Sciences (GM10034). K.L. is supported by a Ruth L. Kirschstein National Research Service Award (F2GM099389).
Contributor Information
Mark A. Le Gros, Email: mark.legros@ucsf.edu.
Carolyn A. Larabell, Email: carolyn.larabell@ucsf.edu.
Supporting Material
References
- 1.McDermott G., Le Gros M.A., Larabell C.A. Visualizing cell architecture and molecular location using soft x-ray tomography and correlated cryo-light microscopy. Annu. Rev. Phys. Chem. 2012;63:225–239. doi: 10.1146/annurev-physchem-032511-143818. [DOI] [PMC free article] [PubMed] [Google Scholar]
- 2.Ellisman M.H., Deerinck T.J., Sosinsky G.E. Picking faces out of a crowd: genetic labels for identification of proteins in correlated light and electron microscopy imaging. Methods Cell Biol. 2012;111:139–155. doi: 10.1016/B978-0-12-416026-2.00008-X. [DOI] [PMC free article] [PubMed] [Google Scholar]
- 3.Jahn K.A., Barton D.A., Braet F. Correlative microscopy: providing new understanding in the biomedical and plant sciences. Micron. 2012;43:565–582. doi: 10.1016/j.micron.2011.12.004. [DOI] [PubMed] [Google Scholar]
- 4.Kopek B.G., Shtengel G., Hess H.F. Correlative 3D super resolution fluorescence and electron microscopy reveal the relationship of mitochondrial nucleoids to membranes. Proc. Natl. Acad. Sci. USA. 2012;109:6136–6141. doi: 10.1073/pnas.1121558109. [DOI] [PMC free article] [PubMed] [Google Scholar]
- 5.Lidke D.S., Lidke K.A. Advances in high-resolution imaging—techniques for three-dimensional imaging of cellular structures. J. Cell Sci. 2012;125:2571–2580. doi: 10.1242/jcs.090027. [DOI] [PMC free article] [PubMed] [Google Scholar]
- 6.Cinquin B.P., Do M., Larabell C.A. Putting molecules in their place. J. Cell. Biochem. 2014;115:209–216. doi: 10.1002/jcb.24658. [DOI] [PMC free article] [PubMed] [Google Scholar]
- 7.Kopek B.G., Shtengel G., Hess H.F. Correlative photoactivated localization and scanning electron microscopy. PLoS ONE. 2013;8:e77209. doi: 10.1371/journal.pone.0077209. [DOI] [PMC free article] [PubMed] [Google Scholar]
- 8.Schellenberger P., Kaufmann R., Grunewald K. High-precision correlative fluorescence and electron cryo microscopy using two independent alignment markers. Ultramicroscopy. 2014;143:41–51. doi: 10.1016/j.ultramic.2013.10.011. [DOI] [PMC free article] [PubMed] [Google Scholar]
- 9.Larabell C.A., Nugent K.A. Imaging cellular architecture with X-rays. Curr. Opin. Struct. Biol. 2010;20:623–631. doi: 10.1016/j.sbi.2010.08.008. [DOI] [PMC free article] [PubMed] [Google Scholar]
- 10.Attwood D.T. Cambridge University Press; Cambridge, NY: 1999. Soft X-rays and Extreme Ultraviolet Radiation: Principles and Applications. [Google Scholar]
- 11.Weiss D., Schneider G., Schmahl G. Computed tomography of cryogenic biological specimens based on X-ray microscopic images. Ultramicroscopy. 2000;84:185–197. doi: 10.1016/s0304-3991(00)00034-6. [DOI] [PubMed] [Google Scholar]
- 12.Uchida M., Sun Y., Larabell C.A. Quantitative analysis of yeast internal architecture using soft X-ray tomography. Yeast. 2011;28:227–236. doi: 10.1002/yea.1834. [DOI] [PMC free article] [PubMed] [Google Scholar]
- 13.Uchida M., McDermott G., Larabell C.A. Soft X-ray tomography of phenotypic switching and the cellular response to antifungal peptoids in Candida albicans. Proc. Natl. Acad. Sci. USA. 2009;106:19375–19380. doi: 10.1073/pnas.0906145106. [DOI] [PMC free article] [PubMed] [Google Scholar]
- 14.McDermott G., Le Gros M.A., Larabell C.A. Soft X-ray tomography and cryogenic light microscopy: the cool combination in cellular imaging. Trends Cell Biol. 2009;19:587–595. doi: 10.1016/j.tcb.2009.08.005. [DOI] [PMC free article] [PubMed] [Google Scholar]
- 15.Kaufmann R., Hagen C., Grünewald K. Fluorescence cryo-microscopy: current challenges and prospects. Curr. Opin. Chem. Biol. 2014;20:86–91. doi: 10.1016/j.cbpa.2014.05.007. [DOI] [PMC free article] [PubMed] [Google Scholar]
- 16.Duke E.M., Razi M., Collinson L.M. Imaging endosomes and autophagosomes in whole mammalian cells using correlative cryo-fluorescence and cryo-soft X-ray microscopy (cryo-CLXM) Ultramicroscopy. 2014;143:77–87. doi: 10.1016/j.ultramic.2013.10.006. [DOI] [PMC free article] [PubMed] [Google Scholar]
- 17.Carzaniga R., Domart M.C., Duke E. Cryo-soft X-ray tomography: a journey into the world of the native-state cell. Protoplasma. 2014;251:449–458. doi: 10.1007/s00709-013-0583-y. [DOI] [PMC free article] [PubMed] [Google Scholar]
- 18.Zeev-Ben-Mordehai T., Hagen C., Grünewald K. A cool hybrid approach to the herpesvirus ‘life’ cycle. Curr Opin Virol. 2014;5:42–49. doi: 10.1016/j.coviro.2014.01.008. [DOI] [PMC free article] [PubMed] [Google Scholar]
- 19.Leis A., Rockel B., Baumeister W. Visualizing cells at the nanoscale. Trends Biochem. Sci. 2009;34:60–70. doi: 10.1016/j.tibs.2008.10.011. [DOI] [PubMed] [Google Scholar]
- 20.Hagen C., Guttmann P., Grünewald K. Correlative VIS-fluorescence and soft X-ray cryo-microscopy/tomography of adherent cells. J. Struct. Biol. 2012;177:193–201. doi: 10.1016/j.jsb.2011.12.012. [DOI] [PMC free article] [PubMed] [Google Scholar]
- 21.Le Gros M.A., McDermott G., Larabell C.A. High-aperture cryogenic light microscopy. J. Microsc. 2009;235:1–8. doi: 10.1111/j.1365-2818.2009.03184.x. [DOI] [PMC free article] [PubMed] [Google Scholar]
- 22.Smith E.A., Cinquin B.P., Larabell C.A. Correlative microscopy methods that maximize specimen fidelity and data completeness, and improve molecular localization capabilities. J. Struct. Biol. 2013;184:12–20. doi: 10.1016/j.jsb.2013.03.006. [DOI] [PMC free article] [PubMed] [Google Scholar]
- 23.Smith E.A., Cinquin B.P., Larabell C.A. Correlative cryogenic tomography of cells using light and soft x-rays. Ultramicroscopy. 2014;143:33–40. doi: 10.1016/j.ultramic.2013.10.013. [DOI] [PMC free article] [PubMed] [Google Scholar]
- 24.Hell S., Reiner G., Stelzer E.H.K. Aberrations in confocal fluorescence microscopy induced by mismatches in refractive-index. J. Microsc. 1993;169:391–405. [Google Scholar]
- 25.Hagen C., Werner S., Grünewald K. Multimodal nanoparticles as alignment and correlation markers in fluorescence/soft X-ray cryo-microscopy/tomography of nucleoplasmic reticulum and apoptosis in mammalian cells. Ultramicroscopy. 2014;146C:46–54. doi: 10.1016/j.ultramic.2014.05.009. [DOI] [PMC free article] [PubMed] [Google Scholar]
- 26.Luger K., Dechassa M.L., Tremethick D.J. New insights into nucleosome and chromatin structure: an ordered state or a disordered affair? Nat. Rev. Mol. Cell Biol. 2012;13:436–447. doi: 10.1038/nrm3382. [DOI] [PMC free article] [PubMed] [Google Scholar]
- 27.Lyon M.F. Gene action in the X-chromosome of the mouse (Mus musculus L.) Nature. 1961;190:372–373. doi: 10.1038/190372a0. [DOI] [PubMed] [Google Scholar]
- 28.Eils R., Dietzel S., Cremer T. Three-dimensional reconstruction of painted human interphase chromosomes: active and inactive X chromosome territories have similar volumes but differ in shape and surface structure. J. Cell Biol. 1996;135:1427–1440. doi: 10.1083/jcb.135.6.1427. [DOI] [PMC free article] [PubMed] [Google Scholar]
- 29.Dedecker P., De Schryver F.C., Hofkens J. Fluorescent proteins: shine on, you crazy diamond. J. Am. Chem. Soc. 2013;135:2387–2402. doi: 10.1021/ja309768d. [DOI] [PubMed] [Google Scholar]
- 30.Rego A., Sinclair P.B., Belmont A.S. The facultative heterochromatin of the inactive X chromosome has a distinctive condensed ultrastructure. J. Cell Sci. 2008;121:1119–1127. doi: 10.1242/jcs.026104. [DOI] [PubMed] [Google Scholar]
- 31.Barr M.L., Bertram E.G. A morphological distinction between neurones of the male and female, and the behaviour of the nucleolar satellite during accelerated nucleoprotein synthesis. Nature. 1949;163:676–677. doi: 10.1038/163676a0. [DOI] [PubMed] [Google Scholar]
- 32.Eils R., Dietzel S., Cremer T. Three-dimensional reconstruction of painted human interphase chromosomes: active and inactive X chromosome territories have similar volumes but differ in shape and surface structure. J. Cell. Biochem. 1996;135:1427–1440. doi: 10.1083/jcb.135.6.1427. [DOI] [PMC free article] [PubMed] [Google Scholar]
- 33.Cremer T., Kreth G., Cremer C. Chromosome territories, interchromatin domain compartment, and nuclear matrix: an integrated view of the functional nuclear architecture. Crit. Rev. Eukaryot. Gene Expr. 2000;10:179–212. [PubMed] [Google Scholar]
- 34.Eils R., Saracoglu K., Cremer C. 3-Dimensional imaging approaches and Monte-Carlo simulations-development of tools to study the morphology and distribution of chromosome territories and subchromosomal targets in human cell-nuclei. Zool. Stud. 1995;34:7–10. [Google Scholar]
- 35.Yang S., Illner D., Rohr K. Structural analysis of interphase X-chromatin based on statistical shape theory. Biochim. Biophys. Acta. 2008;1783:2089–2099. doi: 10.1016/j.bbamcr.2008.08.007. [DOI] [PubMed] [Google Scholar]
- 36.Horowitz-Scherer R.A., Woodcock C.L. Organization of interphase chromatin. Chromosoma. 2006;115:1–14. doi: 10.1007/s00412-005-0035-3. [DOI] [PubMed] [Google Scholar]
- 37.Heard E., Disteche C.M. Dosage compensation in mammals: fine-tuning the expression of the X chromosome. Genes Dev. 2006;20:1848–1867. doi: 10.1101/gad.1422906. [DOI] [PubMed] [Google Scholar]
- 38.Leis A., Rockel B., Baumeister W. Visualizing cells at the nanoscale. Trends Biochem. Sci. 2009;34:60–70. doi: 10.1016/j.tibs.2008.10.011. [DOI] [PubMed] [Google Scholar]
- 39.Nusinow D.A., Hernández-Muñoz I., Panning B. Poly(ADP-ribose) polymerase 1 is inhibited by a histone H2A variant, MacroH2A, and contributes to silencing of the inactive X chromosome. J. Biol. Chem. 2007;282:12851–12859. doi: 10.1074/jbc.M610502200. [DOI] [PubMed] [Google Scholar]
- 40.Parkinson D.Y., Epperly L.R., Larabell C.A. Nanoimaging cells using soft X-ray tomography. Methods Mol. Biol. 2013;950:457–481. doi: 10.1007/978-1-62703-137-0_25. [DOI] [PubMed] [Google Scholar]
- 41.Moerner W.E., Orrit M. Illuminating single molecules in condensed matter. Science. 1999;283:1670–1676. doi: 10.1126/science.283.5408.1670. [DOI] [PubMed] [Google Scholar]
- 42.Crocker J.C., Grier D.G. When like charges attract: the effects of geometrical confinement on long-range colloidal interactions. Phys. Rev. Lett. 1996;77:1897–1900. doi: 10.1103/PhysRevLett.77.1897. [DOI] [PubMed] [Google Scholar]
- 43.Le Gros M.A., Knoechel C.G., Larabell C.A. Visualizing sub-cellular organization using soft x-ray tomography. In: Edward H.E., editor. Comprehensive Biophysics. Elsevier; Amsterdam: 2012. pp. 90–110. [Google Scholar]
- 44.Costanzi C., Pehrson J.R. Histone macroH2A1 is concentrated in the inactive X chromosome of female mammals. Nature. 1998;393:599–601. doi: 10.1038/31275. [DOI] [PubMed] [Google Scholar]
- 45.Plath K., Mlynarczyk-Evans S., Panning B. Xist RNA and the mechanism of X chromosome inactivation. Annu. Rev. Genet. 2002;36:233–278. doi: 10.1146/annurev.genet.36.042902.092433. [DOI] [PubMed] [Google Scholar]
- 46.Nusinow D.A., Sharp J.A., Panning B. The histone domain of macroH2A1 contains several dispersed elements that are each sufficient to direct enrichment on the inactive X chromosome. J. Mol. Biol. 2007;371:11–18. doi: 10.1016/j.jmb.2007.05.063. [DOI] [PMC free article] [PubMed] [Google Scholar]
- 47.Chu F., Nusinow D.A., Burlingame A.L. Mapping post-translational modifications of the histone variant MacroH2A1 using tandem mass spectrometry. Mol. Cell. Proteomics. 2006;5:194–203. doi: 10.1074/mcp.M500285-MCP200. [DOI] [PubMed] [Google Scholar]
- 48.Huang B., Babcock H., Zhuang X. Breaking the diffraction barrier: super-resolution imaging of cells. Cell. 2010;143:1047–1058. doi: 10.1016/j.cell.2010.12.002. [DOI] [PMC free article] [PubMed] [Google Scholar]
Associated Data
This section collects any data citations, data availability statements, or supplementary materials included in this article.